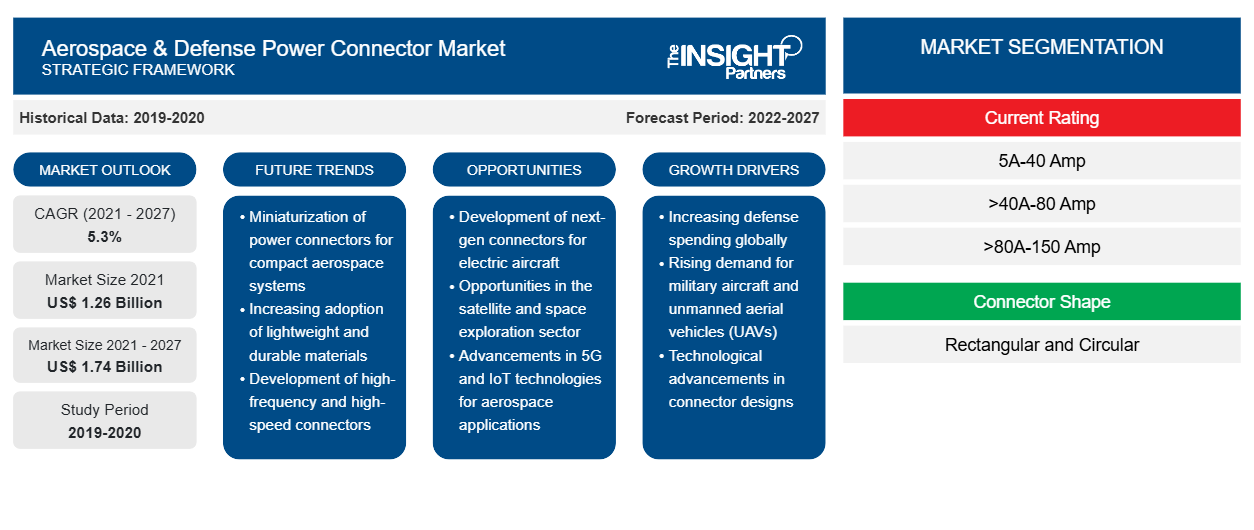
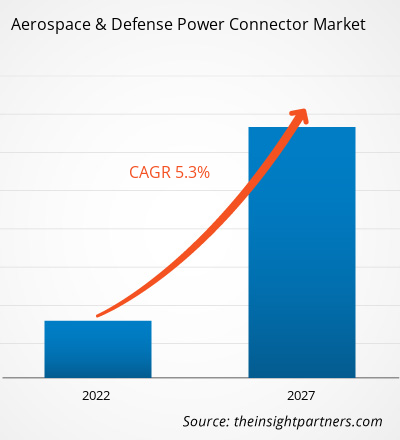
航空宇宙および防衛用電源コネクタ市場は、2021年の12億6,271万米ドルから2027年には17億3,778万米ドルに成長すると予想されています。航空宇宙および防衛用電源コネクタ市場は、2021年から2027年の予測期間中に5.3%のCAGRで成長すると予想されています。
世界の航空機製造業界は、世界中で商用機と軍用機の需要が高まっているため、大幅な成長を遂げています。発展途上国での可処分所得の増加と、ボーイングやエアバスなどのトッププレーヤーの存在は、これらの航空機の需要を牽引している要因の一部です。世界的な状況では、不確実な燃料価格やさまざまな国でのその他の規制の変更など、民間航空会社が直面するいくつかの課題にもかかわらず、商用飛行機は今後数年間にわたって継続的な成長を維持すると予想されています。これに加えて、各国での防衛機器への投資の増加は、2020年から2027年の予測期間中に軍用機の需要を促進すると予想されます。航空機の生産の増加により、エンジン制御、航空電子機器、キャビンシステム、機内エンターテイメントシステムなどの高度な機器の統合に対する需要が高まり、これらのシステムに電力を供給するために電源コネクタが必要になります。電源コネクタは、航空宇宙および防衛基準を満たすように設計されています。これらすべての要因により、さまざまな地域で電源コネクタの需要が高まり、世界市場で活動する航空宇宙および防衛電源コネクタ市場のプレーヤーに将来の成長機会が提供されると予想されます。
航空機製造業界は、ロボット技術にもかかわらず、手作業に大きく依存しています。いくつかの国で課された厳しいロックダウン規制を受けて、航空機製造部門では、それぞれの航空機および部品製造施設で労働者数が大幅に減少しています。航空機製造部門は主に北米とヨーロッパに集中しているため、この2つの地域は、アウトブレイクで製造ペースを維持するのに非常に大きな課題に直面しています。ヨーロッパ諸国は、さまざまな航空機部品、防衛機器、車両を製造しています。しかし、ヨーロッパの国の大多数は、継続的なアウトブレイクの拡大に悩まされています。世界中の航空機メーカーは、部品調達の深刻な落ち込みを目の当たりにしています。航空機部品の生産の低下は、労働力不足の結果です。
航空宇宙および防衛用電源コネクタの市場は、電流定格、コネクタの形状、用途、および地域に基づいてセグメント化されています。電流定格に基づいて、市場は5A~40A、>40A~80A、>80A~150A、>150A~300A、>300A~600A、>600~900Aに分類されています。5A~40Aセグメントは、予測期間を通じて市場全体で最大のシェアを占めました。コネクタの形状に基づいて、市場は長方形と円形に分類されています。用途に基づいて、市場は航空宇宙、軍用地上車両、身体装着型機器、および海軍艦艇に分類されています。航空宇宙セグメントは、エンジン制御システム、航空電子機器、客室機器、およびその他のセグメントにさらに分かれています。地理的に見ると、市場は北米、ヨーロッパ、アジア太平洋 (APAC)、中東およびアフリカ (MEA)、南米 (SAM) の 5 つの主要地域に分割されています。
要件に合わせてレポートをカスタマイズする
このレポートの一部、国レベルの分析、Excelデータパックなど、あらゆるレポートを無料でカスタマイズできます。また、スタートアップや大学向けのお得なオファーや割引もご利用いただけます。
航空宇宙および防衛用電源コネクタ市場:
- このレポートの主要な市場動向を入手してください。この無料サンプルには、市場動向から見積もりや予測に至るまでのデータ分析が含まれます。
航空宇宙および防衛用電源コネクタ市場の洞察
兵士の近代化に対する需要の刺激
戦場のシナリオが激化する中、軍隊は兵士に高度な技術を装備することが求められています。世界中の軍隊は、効率的な防弾チョッキと個人防護具による兵士の保護の最適化に重点を置いています。中国や米国など、さまざまな技術先進国は、軍隊の近代化を急速に進めており、高度な防衛技術の研究開発にも多額の投資を行っています。また、人工知能(AI)、ロボット工学、量子情報科学、生体認証など、幅広い防衛関連技術の研究も行っています。政府は軍事・防衛装備に数十億ドルを投資する意向が非常に強く、例えばストックホルム国際平和研究所(SIPRI)によると、2019年の世界の軍事費は1兆9,170億ドルに上り、これには現在の軍事力と活動、武器と装備の購入、軍事建設、研究開発、指揮と支援への支出が含まれています。
現在の評価に基づく市場分析
航空宇宙および防衛用電源コネクタ市場で活動する市場プレーヤーは、顧客の需要を満たすために、さまざまな電流定格の製品を提供しています。電源コネクタの用途は幅広く、用途ごとに異なるアンペア数のコネクタが求められます。航空宇宙および防衛用電源コネクタ市場は、5A~40A、>40A~80A、>80A~150A、>150A~300A、>300A~600A、>600A~900Aなど、さまざまな電流定格に基づいて分析されています。
コネクタ形状に基づく市場分析
電気機器の場合、安定した信頼性の高い電源供給が不可欠です。適切な電源コネクタの選択は、アプリケーションの性質と顧客の特定の要件に完全に依存します。高電圧バージョンや特定の規格から設計の多様性まで、電源コネクタのポートフォリオは、ユーザーの個々のアプリケーション目標を満たすための幅広く実用的な選択肢を提供します。高アンペア、高電力アプリケーションでの使用に適した長方形および円筒形の製品が多数あります。
アプリケーションベースの市場分析
電源コネクタは、航空宇宙分野および防衛分野のさまざまな用途で頻繁に使用されています。電源コネクタは、航空機、軍用地上車両、海軍艦艇、身体装着型機器に不可欠なコンポーネントです。世界中に多数の航空宇宙および防衛請負業者が存在するため、電源コネクタ市場のプレーヤーは自社製品に対する大きな需要を経験することができ、それが航空宇宙および防衛電源コネクタ市場を毎年促進しています。
航空宇宙および防衛電源コネクタ市場で事業を展開している企業は、市場イニシアチブ、買収、製品発売などの戦略に重点を置いて、航空宇宙および防衛電源コネクタ市場での地位を維持しています。航空宇宙および防衛電源コネクタ市場の主要企業によるいくつかの開発は次のとおりです。
2020 年 2 月、AMETEK はハーメチック コネクタの生産拡大の大幅な完了を発表しました。これにより、1 年以上にわたって供給不足が続いていた製品のリード タイムが約 35% 短縮されました。オハイオ州とカリフォルニア州の拠点では、設備、施設、人員が増強されました。
2020 年 7 月、Radiall は EPX™ シリーズを拡張し、新しい iEPX コネクタを追加しました。これは、一体型のストレイン リリーフとプレスイン EMI バックシェルを備え、航空機システムへのより迅速でコスト効率の高い統合をサポートする、重量が最適化された EPXB2 切断シェルです。
航空宇宙および防衛用電源コネクタ市場レポートの範囲
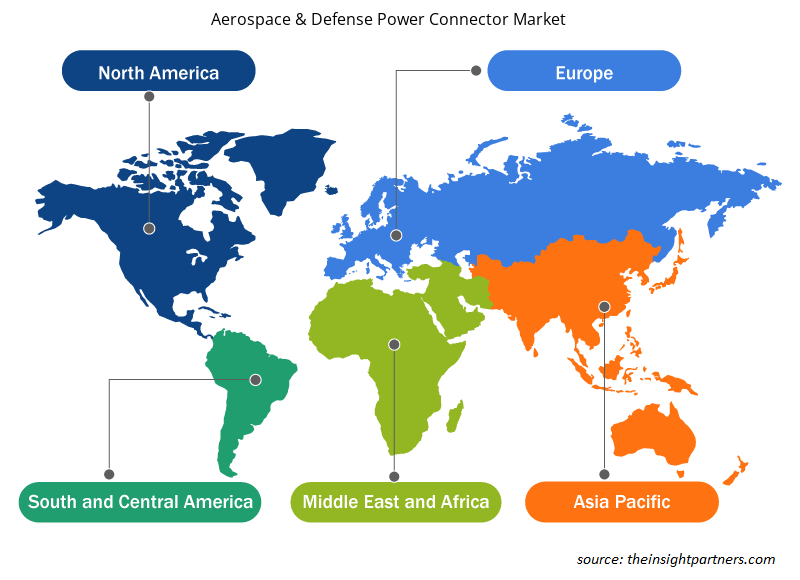
航空宇宙および防衛用電源コネクタ市場の地域別分析
予測期間を通じて航空宇宙および防衛電源コネクタ市場に影響を与える地域的な傾向と要因は、Insight Partners のアナリストによって徹底的に説明されています。このセクションでは、北米、ヨーロッパ、アジア太平洋、中東およびアフリカ、南米および中米にわたる航空宇宙および防衛電源コネクタ市場のセグメントと地理についても説明します。
- 航空宇宙および防衛用電源コネクタ市場の地域別データを入手
航空宇宙および防衛用電源コネクタ市場レポートの範囲
| レポート属性 | 詳細 |
|---|---|
| 2021年の市場規模 | 12億6千万米ドル |
| 2027年までの市場規模 | 17億4千万米ドル |
| 世界のCAGR(2021年~2027年) | 5.3% |
| 履歴データ | 2019-2020 |
| 予測期間 | 2022-2027 |
| 対象セグメント | 現在の評価
|
| 対象地域と国 | 北米
|
| 市場リーダーと主要企業プロフィール |
|
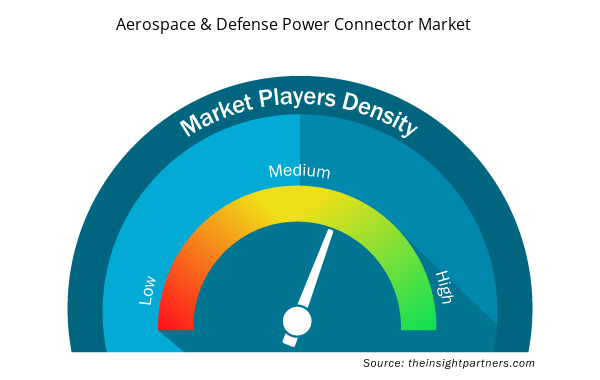
市場プレーヤーの密度:ビジネスダイナミクスへの影響を理解する
航空宇宙および防衛用電源コネクタ市場は、消費者の嗜好の変化、技術の進歩、製品の利点に対する認識の高まりなどの要因により、エンドユーザーの需要が高まり、急速に成長しています。需要が高まるにつれて、企業は提供を拡大し、消費者のニーズを満たすために革新し、新たなトレンドを活用し、市場の成長をさらに促進しています。
市場プレーヤー密度とは、特定の市場または業界内で活動している企業または会社の分布を指します。これは、特定の市場スペースに、その市場規模または総市場価値に対してどれだけの競合相手 (市場プレーヤー) が存在するかを示します。
航空宇宙および防衛電源コネクタ市場で事業を展開している主要企業は次のとおりです。
- アメテック株式会社
- アンフェノールコーポレーション
- アローエレクトロニクス株式会社
- コリンズ・エアロスペース(レイセオン・テクノロジーズ・コーポレーション)
- イートンコーポレーション
免責事項:上記の企業は、特定の順序でランク付けされていません。
- 航空宇宙および防衛用電源コネクタ市場のトップキープレーヤーの概要を入手
航空宇宙および防衛用電源コネクタ市場 – コンポーネント別
- 5アンペア~40アンペア
- >40アンペア~80アンペア
- >80アンペア~150アンペア
- >150アンペア~300アンペア
- >300アンペア~600アンペア
- >600アンペア~900アンペア
航空宇宙および防衛用電源コネクタ市場 – コネクタ形状別
- 長方形
- 円形
航空宇宙および防衛用電源コネクタ市場 – 用途別
- 航空宇宙
- 軍用地上車両
- 身体装着型機器
- 海軍艦艇
航空宇宙および防衛用電源コネクタ市場 – 地域別
- 北米
- 私たち
- カナダ
- メキシコ
- ヨーロッパ
- フランス
- ドイツ
- ロシア
- 英国
- イタリア
- その他のヨーロッパ
- アジア太平洋(APAC)
- 中国
- インド
- 日本
- オーストラリア
- 韓国
- その他のアジア太平洋地域
- 外務省
- サウジアラビア
- アラブ首長国連邦
- 南アフリカ
- MEAの残り
- サム
- ブラジル
- 残りのSAM
航空宇宙および防衛用電源コネクタ市場 – 企業プロファイル
- アメテック株式会社
- アンフェノールコーポレーション
- アローエレクトロニクス株式会社
- コリンズ・エアロスペース(レイセオン・テクノロジーズ・コーポレーション)
- イートンコーポレーション
- フィッシャーコネクターズSA
- ITTコーポレーション
- モレックス LLC
- ラディアル
- TEコネクティビティ
- 過去2年間の分析、基準年、CAGRによる予測(7年間)
- PEST分析とSWOT分析
- 市場規模価値/数量 - 世界、地域、国
- 業界と競争環境
- Excel データセット
- 3D Audio Market
- Energy Recovery Ventilator Market
- Drain Cleaning Equipment Market
- Sodium Bicarbonate Market
- Malaria Treatment Market
- Excimer & Femtosecond Ophthalmic Lasers Market
- Legal Case Management Software Market
- Educational Furniture Market
- Pharmacovigilance and Drug Safety Software Market
- Queue Management System Market

Report Coverage
Revenue forecast, Company Analysis, Industry landscape, Growth factors, and Trends

Segment Covered
This text is related
to segments covered.

Regional Scope
North America, Europe, Asia Pacific, Middle East & Africa, South & Central America

Country Scope
This text is related
to country scope.
よくある質問
The power connectors with current ratings ranging from 5Amps to 40Amps are the most prominent connector in the aerospace & defense power connector market. This is due to the fact that these power connectors are widely used across the aerospace industry and defense industry. Some of the application areas of power connectors with amperage ranging from 5Ams to 40Amps include commercial aircraft cabin systems and unmanned airborne systems. These connectors are capable of mating quickly and are able to provide superior durability and ensure proper connection via connector position assurance (CPA).
The North America region led the aerospace & defense power connector market in 2019. The demand for various military equipment is on the rise as governments across the North American region are increasingly focusing on military modernization owing to the increasing security concerns. The sustained and uncertainty complexity of the international security environment worldwide is expected to boost defense spending by the authorities in the region over the next five years.
The growing commercial aircraft demands for several equipment, which are equipped within the aircraft such as avionics systems and engine control and monitoring system that, operate at peak efficiency. In these equipment, power connectors play a crucial role as they are used to connect engine control units with the cables of the commercial aircraft electrical system, where they guarantee a consistent transmission of electric signals and power.
Trends and growth analysis reports related to Aerospace and Defense : READ MORE..
The List of Companies - Aerospace & Defense Power Connector Market
- AMETEK. Inc.
- Amphenol Corporation
- Arrow Electronics, Inc.
- Collins Aerospace (Raytheon Technologies Corporation)
- Eaton Corporation plc
- Fischer Connectors SA
- ITT Corporation
- Molex, LLC
- Radiall
- TE Connectivity
The Insight Partners performs research in 4 major stages: Data Collection & Secondary Research, Primary Research, Data Analysis and Data Triangulation & Final Review.
- Data Collection and Secondary Research:
As a market research and consulting firm operating from a decade, we have published and advised several client across the globe. First step for any study will start with an assessment of currently available data and insights from existing reports. Further, historical and current market information is collected from Investor Presentations, Annual Reports, SEC Filings, etc., and other information related to company’s performance and market positioning are gathered from Paid Databases (Factiva, Hoovers, and Reuters) and various other publications available in public domain.
Several associations trade associates, technical forums, institutes, societies and organization are accessed to gain technical as well as market related insights through their publications such as research papers, blogs and press releases related to the studies are referred to get cues about the market. Further, white papers, journals, magazines, and other news articles published in last 3 years are scrutinized and analyzed to understand the current market trends.
- Primary Research:
The primarily interview analysis comprise of data obtained from industry participants interview and answers to survey questions gathered by in-house primary team.
For primary research, interviews are conducted with industry experts/CEOs/Marketing Managers/VPs/Subject Matter Experts from both demand and supply side to get a 360-degree view of the market. The primary team conducts several interviews based on the complexity of the markets to understand the various market trends and dynamics which makes research more credible and precise.
A typical research interview fulfils the following functions:
- Provides first-hand information on the market size, market trends, growth trends, competitive landscape, and outlook
- Validates and strengthens in-house secondary research findings
- Develops the analysis team’s expertise and market understanding
Primary research involves email interactions and telephone interviews for each market, category, segment, and sub-segment across geographies. The participants who typically take part in such a process include, but are not limited to:
- Industry participants: VPs, business development managers, market intelligence managers and national sales managers
- Outside experts: Valuation experts, research analysts and key opinion leaders specializing in the electronics and semiconductor industry.
Below is the breakup of our primary respondents by company, designation, and region:

Once we receive the confirmation from primary research sources or primary respondents, we finalize the base year market estimation and forecast the data as per the macroeconomic and microeconomic factors assessed during data collection.
- Data Analysis:
Once data is validated through both secondary as well as primary respondents, we finalize the market estimations by hypothesis formulation and factor analysis at regional and country level.
- Macro-Economic Factor Analysis:
We analyse macroeconomic indicators such the gross domestic product (GDP), increase in the demand for goods and services across industries, technological advancement, regional economic growth, governmental policies, the influence of COVID-19, PEST analysis, and other aspects. This analysis aids in setting benchmarks for various nations/regions and approximating market splits. Additionally, the general trend of the aforementioned components aid in determining the market's development possibilities.
- Country Level Data:
Various factors that are especially aligned to the country are taken into account to determine the market size for a certain area and country, including the presence of vendors, such as headquarters and offices, the country's GDP, demand patterns, and industry growth. To comprehend the market dynamics for the nation, a number of growth variables, inhibitors, application areas, and current market trends are researched. The aforementioned elements aid in determining the country's overall market's growth potential.
- Company Profile:
The “Table of Contents” is formulated by listing and analyzing more than 25 - 30 companies operating in the market ecosystem across geographies. However, we profile only 10 companies as a standard practice in our syndicate reports. These 10 companies comprise leading, emerging, and regional players. Nonetheless, our analysis is not restricted to the 10 listed companies, we also analyze other companies present in the market to develop a holistic view and understand the prevailing trends. The “Company Profiles” section in the report covers key facts, business description, products & services, financial information, SWOT analysis, and key developments. The financial information presented is extracted from the annual reports and official documents of the publicly listed companies. Upon collecting the information for the sections of respective companies, we verify them via various primary sources and then compile the data in respective company profiles. The company level information helps us in deriving the base number as well as in forecasting the market size.
- Developing Base Number:
Aggregation of sales statistics (2020-2022) and macro-economic factor, and other secondary and primary research insights are utilized to arrive at base number and related market shares for 2022. The data gaps are identified in this step and relevant market data is analyzed, collected from paid primary interviews or databases. On finalizing the base year market size, forecasts are developed on the basis of macro-economic, industry and market growth factors and company level analysis.
- Data Triangulation and Final Review:
The market findings and base year market size calculations are validated from supply as well as demand side. Demand side validations are based on macro-economic factor analysis and benchmarks for respective regions and countries. In case of supply side validations, revenues of major companies are estimated (in case not available) based on industry benchmark, approximate number of employees, product portfolio, and primary interviews revenues are gathered. Further revenue from target product/service segment is assessed to avoid overshooting of market statistics. In case of heavy deviations between supply and demand side values, all thes steps are repeated to achieve synchronization.
We follow an iterative model, wherein we share our research findings with Subject Matter Experts (SME’s) and Key Opinion Leaders (KOLs) until consensus view of the market is not formulated – this model negates any drastic deviation in the opinions of experts. Only validated and universally acceptable research findings are quoted in our reports.
We have important check points that we use to validate our research findings – which we call – data triangulation, where we validate the information, we generate from secondary sources with primary interviews and then we re-validate with our internal data bases and Subject matter experts. This comprehensive model enables us to deliver high quality, reliable data in shortest possible time.
 このレポートの無料サンプルを入手する