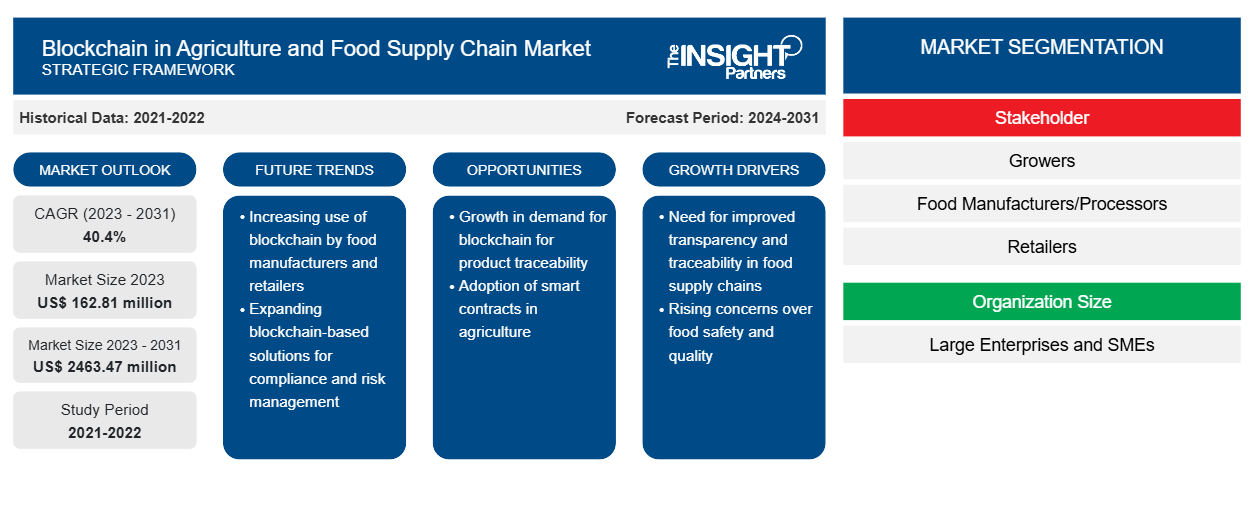
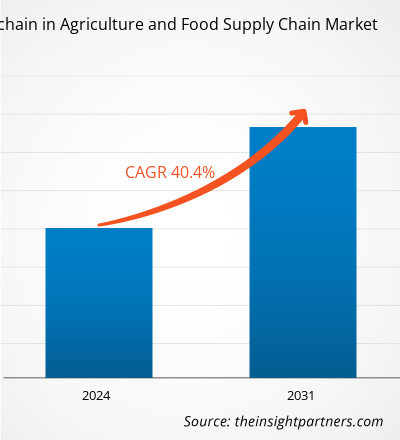
農業および食品サプライチェーンにおけるブロックチェーンの市場規模は、2023年の1億6,281万米ドルから2031年には2億4,6347万米ドルに成長すると予想されており、2023年から2031年にかけて40.4%のCAGRで拡大すると予想されています。トレーサビリティと透明性の向上、透明性に対する消費者の需要、サプライチェーンの効率、食品偽装や汚染の防止、食品廃棄物の削減が、農業および食品サプライチェーン市場におけるブロックチェーンの成長を後押ししています。
農業と食品サプライチェーン市場分析におけるブロックチェーン
中小企業からのブロックチェーン技術に対する需要の高まりにより、農業および食品サプライチェーン市場におけるブロックチェーンの存在感が高まりました。さらに、モノのインターネット(IoT) デバイスの統合により、予測期間中に市場の拡大が加速すると予測されています。さらに、大手企業はポートフォリオと世界的な存在感を拡大するためにさまざまな取り組みを行っており、これが農業および食品サプライチェーン市場のトレンドにおける主要なブロックチェーンとなっています。
農業と食品サプライチェーンにおけるブロックチェーン市場の概要
- 農業関連企業は、ブロックチェーン技術への関心をますます高めています。サプライチェーンの知識がどのように生み出されるか、また、技術の発展によって強化されたデータ管理能力によって取引のボトルネックが軽減されるかを示すことで、企業は徐々に差別化を図っています。
- 農業分野では、取引コストの削減、物流の合理化、追跡可能性の向上、食品安全手順の強化においてテクノロジーがいかに価値があるかが強調されています。
- ブロックチェーン技術は、世界の農業サプライチェーンにおける透明性の向上、抵抗の軽減、取引関連の効率性の向上を実現する素晴らしい機会をもたらします。
要件に合わせてレポートをカスタマイズする
このレポートの一部、国レベルの分析、Excelデータパックなど、あらゆるレポートを無料でカスタマイズできます。また、スタートアップや大学向けのお得なオファーや割引もご利用いただけます。
農業と食品サプライチェーン市場におけるブロックチェーン:
- このレポートの主要な市場動向を入手してください。この無料サンプルには、市場動向から見積もりや予測に至るまでのデータ分析が含まれます。
農業と食品サプライチェーンにおけるブロックチェーンの市場機会
モノのインターネット (IoT) デバイスの統合により、農業および食品サプライチェーン市場の成長におけるブロックチェーンの機会が創出される
- 農業や食品サプライチェーン向けのブロックチェーン技術とモノのインターネット (IoT) デバイスを統合すると、データ収集とリアルタイム監視が改善され、透明性、追跡可能性、品質管理が向上し、サプライチェーンの効率も向上します。
- 企業はブロックチェーンを使用して、モノのインターネット デバイス内のデータを保護しています。ブロックチェーン テクノロジーを IoT デバイスと組み合わせて使用すると、スマート デバイスはスケーラブルで安全かつ信頼性の高い方法でデータを交換し、その他の金融活動を行えます。
- さらに、ブロックチェーン技術と IoT を組み合わせることで、組織は集中的な制御や管理を必要とせずにデータの交換やアクセスが可能になり、農業や食品サプライチェーン市場におけるブロックチェーンの成長がさらに促進されます。
農業と食品サプライチェーン市場レポートのセグメンテーション分析におけるブロックチェーン
- 組織規模に基づいて、農業および食品サプライチェーン市場におけるブロックチェーンは、大企業と中小企業に分類されます。大企業セグメントは、2023年に農業および食品サプライチェーン市場におけるブロックチェーンの大きなシェアを占めると予想されます。
- 大規模な組織は、農業や食品サプライチェーンを強化するためにブロックチェーンなどの先進技術への投資に継続的に取り組んでおり、それが市場におけるこの分野の成長を促進しています。
- 中小企業もブロックチェーン技術の導入に取り組んでおり、これはバリューチェーン全体を通じて穀物を追跡・管理する上で役立ち、予測期間中の市場成長をさらに促進することになる。
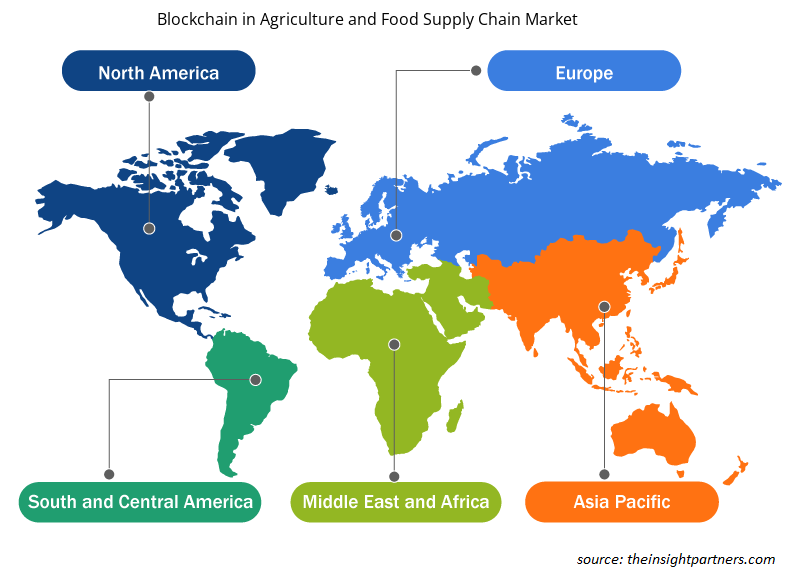
農業と食品サプライチェーンにおけるブロックチェーンの地域別市場シェア分析
農業および食品サプライチェーン市場におけるブロックチェーンの範囲は、主に北米、ヨーロッパ、アジア太平洋、中東およびアフリカ、南米の 5 つの地域に分かれています。北米は急速な成長を遂げており、農業および食品サプライチェーン市場におけるブロックチェーンの大きなシェアを占めると予想されています。北米は、農業および食品サプライチェーンを管理するために他の地域よりもはるかに速いペースで最新技術を採用し、最大の市場シェアを獲得しました。さらに、米国とカナダは、この地域で最も経済的に安定した国であり、市場のかなりの部分を占めています。
農業と食品サプライチェーン市場におけるブロックチェーンの地域的洞察
予測期間を通じて農業および食品サプライチェーン市場におけるブロックチェーンに影響を与える地域的な傾向と要因は、Insight Partners のアナリストによって徹底的に説明されています。このセクションでは、北米、ヨーロッパ、アジア太平洋、中東、アフリカ、南米および中米にわたる農業および食品サプライチェーン市場におけるブロックチェーンのセグメントと地理についても説明します。
- 農業および食品サプライチェーン市場におけるブロックチェーンの地域別データを入手
農業と食品サプライチェーン市場レポートのブロックチェーン範囲
| レポート属性 | 詳細 |
|---|---|
| 2023年の市場規模 | 1億6,281万米ドル |
| 2031年までの市場規模 | 24億6,347万米ドル |
| 世界のCAGR(2023年~2031年) | 40.4% |
| 履歴データ | 2021-2022 |
| 予測期間 | 2024-2031 |
| 対象セグメント | ステークホルダー別
|
| 対象地域と国 | 北米
|
| 市場リーダーと主要企業プロフィール |
|
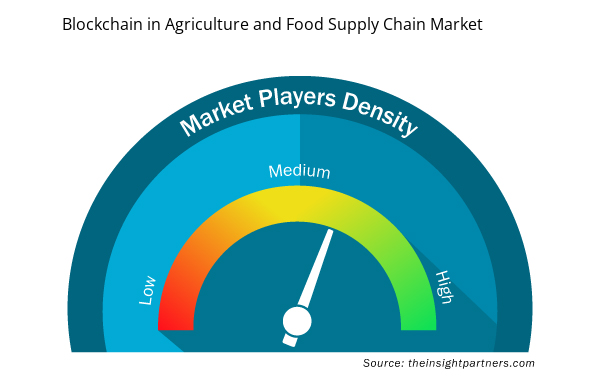
農業と食品サプライチェーンにおけるブロックチェーン市場のプレーヤー密度: ビジネスダイナミクスへの影響を理解する
農業および食品サプライチェーン市場におけるブロックチェーンは、消費者の嗜好の変化、技術の進歩、製品の利点に対する認識の高まりなどの要因により、エンドユーザーの需要が高まり、急速に成長しています。需要が高まるにつれて、企業は提供を拡大し、消費者のニーズを満たすために革新し、新たなトレンドを活用し、市場の成長をさらに促進しています。
市場プレーヤー密度とは、特定の市場または業界内で活動している企業または会社の分布を指します。これは、特定の市場スペースに、その規模または総市場価値と比較して、どれだけの競合相手 (市場プレーヤー) が存在するかを示します。
農業および食品サプライチェーン市場におけるブロックチェーンで事業を展開している主要企業は次のとおりです。
- IBM
- マイクロソフト
- TE-FOODインターナショナルGmbH
- アンブロサス
- ACR-NET
- SAP SE
免責事項:上記の企業は、特定の順序でランク付けされていません。
- 農業と食品サプライチェーン市場におけるブロックチェーンの主要プレーヤーの概要
「農業と食品サプライチェーンにおけるブロックチェーンの市場分析」調査は、利害関係者、組織規模、アプリケーション、および地理に基づいて実施されました。利害関係者に基づいて、市場は生産者、食品製造業者/加工業者、小売業者に分類されます。組織規模に基づいて、市場は大企業と中小企業に分類されます。アプリケーションに基づいて、農業および食品サプライチェーン市場におけるブロックチェーンは、製品の追跡可能性、支払いと決済、スマートコントラクト、ガバナンスリスクとコンプライアンス管理に分類されます。地理に基づいて、市場は北米、ヨーロッパ、アジア太平洋、中東およびアフリカ、南米に分割されます。
農業と食品サプライチェーンにおけるブロックチェーンの市場ニュースと最近の動向
農業および食品サプライチェーン市場において、企業はブロックチェーンにおける合併や買収などの無機的および有機的な戦略を採用しています。最近の主要な市場動向をいくつか以下に示します。
- 2021 年 3 月、エンタープライズ ブロックチェーン プラットフォーム プロバイダーの BlockApps は、Amazon Web Services (AWS) を使用した TraceHarvest ネットワークの拡張を発表しました。BlockApps の TraceHarvest ブロックチェーン ソリューションは、AWS を活用して、TraceHarvest の農業関連ビジネス顧客にクラウドへの高速で柔軟なアクセスを提供します。TraceHarvest により、顧客はブロックチェーンを使用して、種子源から農産物のライフサイクル全体を追跡およびトレースできます。
[出典: BlockApps、企業ウェブサイト]
- 2020年1月、Farmer ConnectとIBMは「Thank My Farmer」という新しい消費者向けモバイルアプリケーションを発表しました。このアプリケーションにより、コーヒーを飲む人はコーヒーを追跡してその品質と原産地を理解し、さらには豆を栽培した農家を支援することさえできるようになります。Farmer Connectは、コーヒーサプライチェーンの追跡可能性、効率性、公平性を向上させるために設計された、IBM Blockchainを搭載した追跡プラットフォームです。
[出典: IBM、企業ウェブサイト]
農業と食品サプライチェーンにおけるブロックチェーン市場レポートのカバレッジと成果物
農業および食品サプライチェーンにおけるブロックチェーン市場の予測は、主要な企業の出版物、協会データ、データベースなど、さまざまな二次および一次調査結果に基づいて推定されています。市場レポート「農業および食品サプライチェーンにおけるブロックチェーン市場の規模と予測(2021〜2031年)」では、以下の分野をカバーする市場の詳細な分析を提供しています。
- 対象範囲に含まれるすべての主要市場セグメントについて、世界、地域、国レベルでの市場規模と予測。
- 推進要因、制約、主要な機会などの市場の動向。
- 今後の主な動向。
- 詳細なPESTおよびSWOT分析
- 主要な市場動向、主要プレーヤー、規制、最近の市場動向を網羅した世界および地域の市場分析。
- 市場集中、ヒートマップ分析、主要プレーヤー、最近の動向を網羅した業界の状況と競争分析。
- 詳細な企業プロフィール。
- 過去2年間の分析、基準年、CAGRによる予測(7年間)
- PEST分析とSWOT分析
- 市場規模価値/数量 - 世界、地域、国
- 業界と競争環境
- Excel データセット

Report Coverage
Revenue forecast, Company Analysis, Industry landscape, Growth factors, and Trends

Segment Covered
This text is related
to segments covered.

Regional Scope
North America, Europe, Asia Pacific, Middle East & Africa, South & Central America

Country Scope
This text is related
to country scope.
よくある質問
The global blockchain in agriculture and food supply chain market was estimated to be US$ 162.81 billion in 2023 and is expected to grow at a CAGR of 40.4% during the forecast period 2023 - 2031.
Rising demand for traceability and transparency from stakeholders are the major factors that propel the global blockchain in agriculture and food supply chain market.
The strategic initiatives by market players are anticipated to play a significant role in the global blockchain in agriculture and food supply chain market in the coming years.
The global blockchain in agriculture and food supply chain market is expected to reach US$ 2463.47 million by 2031.
The key players holding majority shares in the global blockchain in agriculture and food supply chain market are IBM, Microsoft, TE-FOOD International GmbH, Ambrosus, and ACR-NET.
Trends and growth analysis reports related to Banking, Financial Services, and Insurance : READ MORE..
- IBM
- Microsoft
- TE-FOOD International GmbH
- Ambrosus
- ACR-NET
- SAP SE
- OriginTrail
- Provenance
- Chainvine
- Ripe.io
The Insight Partners performs research in 4 major stages: Data Collection & Secondary Research, Primary Research, Data Analysis and Data Triangulation & Final Review.
- Data Collection and Secondary Research:
As a market research and consulting firm operating from a decade, we have published and advised several client across the globe. First step for any study will start with an assessment of currently available data and insights from existing reports. Further, historical and current market information is collected from Investor Presentations, Annual Reports, SEC Filings, etc., and other information related to company’s performance and market positioning are gathered from Paid Databases (Factiva, Hoovers, and Reuters) and various other publications available in public domain.
Several associations trade associates, technical forums, institutes, societies and organization are accessed to gain technical as well as market related insights through their publications such as research papers, blogs and press releases related to the studies are referred to get cues about the market. Further, white papers, journals, magazines, and other news articles published in last 3 years are scrutinized and analyzed to understand the current market trends.
- Primary Research:
The primarily interview analysis comprise of data obtained from industry participants interview and answers to survey questions gathered by in-house primary team.
For primary research, interviews are conducted with industry experts/CEOs/Marketing Managers/VPs/Subject Matter Experts from both demand and supply side to get a 360-degree view of the market. The primary team conducts several interviews based on the complexity of the markets to understand the various market trends and dynamics which makes research more credible and precise.
A typical research interview fulfils the following functions:
- Provides first-hand information on the market size, market trends, growth trends, competitive landscape, and outlook
- Validates and strengthens in-house secondary research findings
- Develops the analysis team’s expertise and market understanding
Primary research involves email interactions and telephone interviews for each market, category, segment, and sub-segment across geographies. The participants who typically take part in such a process include, but are not limited to:
- Industry participants: VPs, business development managers, market intelligence managers and national sales managers
- Outside experts: Valuation experts, research analysts and key opinion leaders specializing in the electronics and semiconductor industry.
Below is the breakup of our primary respondents by company, designation, and region:

Once we receive the confirmation from primary research sources or primary respondents, we finalize the base year market estimation and forecast the data as per the macroeconomic and microeconomic factors assessed during data collection.
- Data Analysis:
Once data is validated through both secondary as well as primary respondents, we finalize the market estimations by hypothesis formulation and factor analysis at regional and country level.
- Macro-Economic Factor Analysis:
We analyse macroeconomic indicators such the gross domestic product (GDP), increase in the demand for goods and services across industries, technological advancement, regional economic growth, governmental policies, the influence of COVID-19, PEST analysis, and other aspects. This analysis aids in setting benchmarks for various nations/regions and approximating market splits. Additionally, the general trend of the aforementioned components aid in determining the market's development possibilities.
- Country Level Data:
Various factors that are especially aligned to the country are taken into account to determine the market size for a certain area and country, including the presence of vendors, such as headquarters and offices, the country's GDP, demand patterns, and industry growth. To comprehend the market dynamics for the nation, a number of growth variables, inhibitors, application areas, and current market trends are researched. The aforementioned elements aid in determining the country's overall market's growth potential.
- Company Profile:
The “Table of Contents” is formulated by listing and analyzing more than 25 - 30 companies operating in the market ecosystem across geographies. However, we profile only 10 companies as a standard practice in our syndicate reports. These 10 companies comprise leading, emerging, and regional players. Nonetheless, our analysis is not restricted to the 10 listed companies, we also analyze other companies present in the market to develop a holistic view and understand the prevailing trends. The “Company Profiles” section in the report covers key facts, business description, products & services, financial information, SWOT analysis, and key developments. The financial information presented is extracted from the annual reports and official documents of the publicly listed companies. Upon collecting the information for the sections of respective companies, we verify them via various primary sources and then compile the data in respective company profiles. The company level information helps us in deriving the base number as well as in forecasting the market size.
- Developing Base Number:
Aggregation of sales statistics (2020-2022) and macro-economic factor, and other secondary and primary research insights are utilized to arrive at base number and related market shares for 2022. The data gaps are identified in this step and relevant market data is analyzed, collected from paid primary interviews or databases. On finalizing the base year market size, forecasts are developed on the basis of macro-economic, industry and market growth factors and company level analysis.
- Data Triangulation and Final Review:
The market findings and base year market size calculations are validated from supply as well as demand side. Demand side validations are based on macro-economic factor analysis and benchmarks for respective regions and countries. In case of supply side validations, revenues of major companies are estimated (in case not available) based on industry benchmark, approximate number of employees, product portfolio, and primary interviews revenues are gathered. Further revenue from target product/service segment is assessed to avoid overshooting of market statistics. In case of heavy deviations between supply and demand side values, all thes steps are repeated to achieve synchronization.
We follow an iterative model, wherein we share our research findings with Subject Matter Experts (SME’s) and Key Opinion Leaders (KOLs) until consensus view of the market is not formulated – this model negates any drastic deviation in the opinions of experts. Only validated and universally acceptable research findings are quoted in our reports.
We have important check points that we use to validate our research findings – which we call – data triangulation, where we validate the information, we generate from secondary sources with primary interviews and then we re-validate with our internal data bases and Subject matter experts. This comprehensive model enables us to deliver high quality, reliable data in shortest possible time.
 このレポートの無料サンプルを入手する