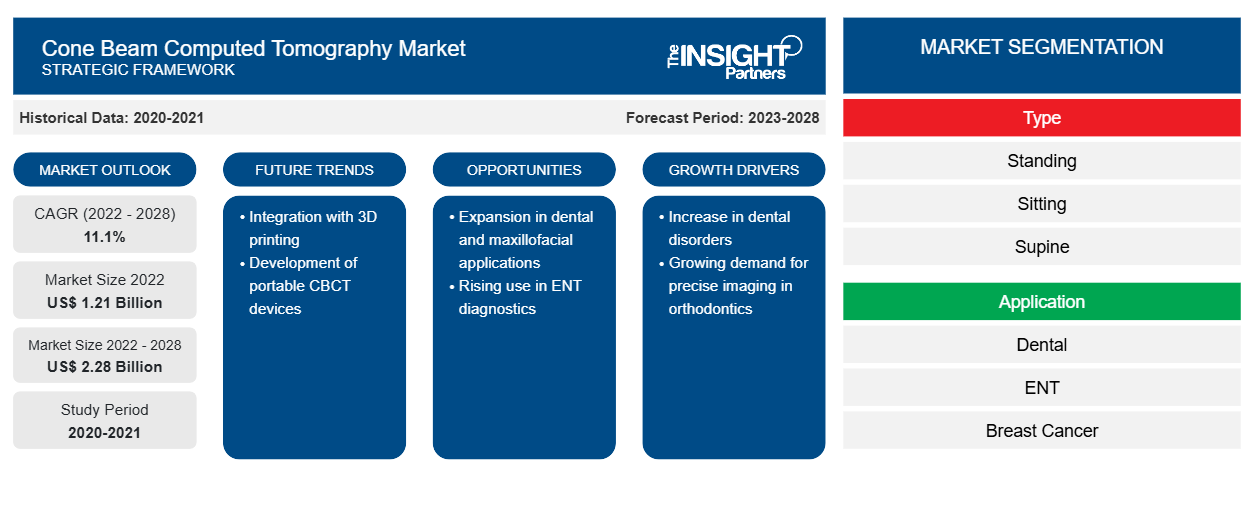
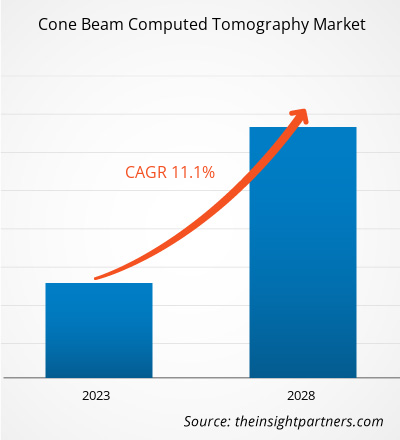
コーンビームCT市場は、2022年の12億1,451万米ドルから2028年には22億7,841万米ドルに達すると予想されており、 2022年から2028年にかけて11.1%のCAGRで成長すると予測されています。
コーンビーム CT は、従来の CT システムを改良したものです。歯科専門家が使用するコーンビーム CT システムは、患者の周囲を回転しながら、円錐形の X 線ビームを使用してデータを取得します。これらのデータは、歯科 (歯)、口腔および顎顔面領域 (口、顎、首)、耳、鼻、喉の 3 次元画像を再構成するために使用されます。
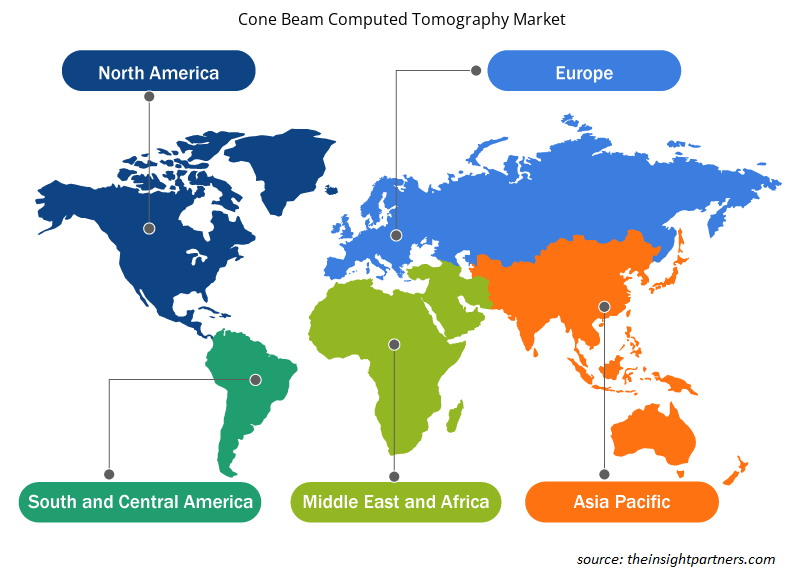
コーンビーム CT 市場は、タイプ、アプリケーション、エンド ユーザー、および地域に基づいてセグメント化されています。地域に基づいて、市場は北米、ヨーロッパ、アジア太平洋、中東およびアフリカ、および中南米に大まかにセグメント化されています。レポートでは、市場の動向、技術の進歩、および市場のダイナミクスに重点を置き、市場の洞察と詳細な分析を提供します。また、世界の主要市場プレーヤーの競争環境の分析も提供します。
要件に合わせてレポートをカスタマイズする
このレポートの一部、国レベルの分析、Excelデータパックなど、あらゆるレポートを無料でカスタマイズできます。また、スタートアップや大学向けのお得なオファーや割引もご利用いただけます。
- このレポートの主要な市場動向を入手してください。この無料サンプルには、市場動向から見積もりや予測に至るまでのデータ分析が含まれます。
市場分析
CBCTデバイスへのソフトウェアツールの統合により 市場の成長が促進される
CBCTシステムにソフトウェア ツールを統合することで、ユーザーは複雑な診断手順を自動化および標準化し、患者エクスペリエンスと診断結果を改善し、ケアのコストを削減できるとともに、 CBCTシステムの機能性も向上させることができます。CBCT スキャン データの分析と解釈は、経験豊富な臨床専門家にとっても困難な場合があります。ソフトウェア システムは、歯科技工所、歯科医、インプラント専門医、外科医に最大限の柔軟性と精度を提供するために開発されました。CBCT とのソフトウェア統合により、医師は診断の範囲を広げ、治療計画中に患者の根本的な解剖学的構造の可視性を向上させることができます。画像保管および通信システム ( PACS ) とCBCTシステムの統合により、カメラ画像のキャプチャと編集、クラウド経由の画像共有、効率的な治療計画の提供が可能になります。PACSは、主にデジタル電子画像の保存と安全な送信に使用される医療用画像技術です。これにより、異なる場所にいる医師が同じデータを同時に確認できます。デジタル ヘルス企業は、 CBCTシステム用のソフトウェアの開発に投資しています。したがって、 CBCT装置とソフトウェア ツールを統合してデータの分析、解釈、アーカイブを簡素化することが、コーンビーム コンピューター断層撮影市場の成長に貢献しています。
CBCT市場に新たなトレンドをもたらす技術の進歩と研究開発
技術の進歩、特にデジタル画像システムにより、診断および外科手術の手順が改善されました。これは、高度な画像システムが患者の放射線被ばくを減らしながら医療従事者に詳細な情報を提供できるようになったことに起因しています。CBCT技術により、歯科医はより少ない放射線量でより多くのデータを収集できるようになりました。以前は、医師は診断と治療計画に 2 次元画像に依存していました。しかし、2D 技術では多くの場合、複数の被ばくが必要になります。そのため、診断では 3D スキャンがますます普及しています。
CBCT 市場に関連する進歩のいくつかを以下に示します。
- 2019 年 3 月、Planmeca Oy は、高品質の CBCT 画像を提供する高度な Planmeca Viso G5 を Planmeca Viso ファミリーに導入しました。
- 2021 年 12 月、RaySearch Laboratories AB は、適応型ワークフロー、小線源療法、イオン放射線療法向けの新しい機能を Ray Station 11B に導入しました。Ray Station 11B は、光子療法の毎日の画像に対する線量計算の精度が向上して動作します。毎日の CBCT は、治療プロセスの早い段階で撮影され、完全な治療を計画するために使用される従来の CT よりも、治療時の患者の解剖学的構造をより適切に表現します。
- 2022 年 4 月、Carestream Dental は CS 8200 3D ファミリーの Neo Edition を発売しました。これにより、CBCT スキャンが非常に直感的になりました。Neo Edition は CS 8200 3D の進化版で、使いやすさを保証し、より良い臨床経験に貢献し、より成功した結果につながるオプションの Scan Ceph モジュールを備えています。すでに CS 8200 3D を使用している医師は、新しい Neo Edition に簡単にアップグレードできます。
- 2022 年 6 月、Xoran Technologies は、モジュール式コーンビーム コンピューター断層撮影システム アセンブリの特許を取得しました。
したがって、さまざまな市場プレーヤーによるこのような技術の進歩は、今後数年間でコーンビームコンピューター断層撮影市場に新たなトレンドをもたらす可能性があります。
エンドユーザーの洞察
エンドユーザーに基づいて、コーンビームコンピューター断層撮影市場は、病院と診療所、診断センター、その他に分かれています。病院と診療所セグメントは2021年に最大の市場シェアを占め、診断センターセグメントは予測期間中に最高のCAGRを記録すると予想されています。診断ラボには、患者に最高品質の包括的なスクリーニングと診断サービスを提供するフルサービスの画像診断設備が備わっています。診断センターには、CTスキャン、超音波、X線、マンモグラフィーなど、最新の画像診断装置がすべて備わっています。これらの施設の現場の放射線科医は、患者に完全な検査を提供し、数時間以内にレポートを引き渡します。短いターンアラウンドタイムで迅速かつ正確な結果をもたらす画像技術の進歩と、早期の病気診断の需要の急増は、診断ラボセグメントのコーンビームコンピューター断層撮影市場の成長に有利な要因です。
製品の発売や合併・買収は、世界のコーンビーム CT 市場のプレーヤーによって広く採用されている戦略です。最近の主要な製品開発のいくつかを以下に示します。
- 2021 年 5 月、PreXion Corporation は最新モデルの PreXion 3D Explorer PRO を発売しました。このマシンのこのバージョンには、統合されたセファロ X 線アームが搭載されています。
- 2021 年 2 月、ブレインラボは Loop-X モバイル イメージング ロボットと Cirq ロボット手術システムについて FDA の認可を取得しました。CE マークの承認に続き、ブレインラボはこれらの製品を米国市場に投入するための FDA の認可も取得しました。Cirq は脊椎手術用のロボット アライメント モジュールであり、Loop-X は初の完全ロボット手術中イメージング デバイスです。
- キヤノンは、2022年11月にCanon Healthcare USA, INC.を設立し、医療事業を強化しました。影響力の大きい米国の医療市場での存在感を高めることで、キヤノンは医療事業の成長を加速させることを目指します。
アジア太平洋地域では、COVID-19パンデミックが中国とインドに深刻な影響を及ぼしました。これらの国ではすでに慢性疾患に苦しむ患者が多くいます。これらの国の医療専門家は、パンデミックの状況に対処するために選択的処置をキャンセルしました。さらに、患者とその家族は感染から身を守るために病院に行くことを避け、代わりにオンライン相談を選択しました。その結果、慢性疾患に対して実施される診断処置が大幅に減少しました。一方、COVID-19症例の急増により、肺への感染の広がりを確認するために使用されていたX線およびコーンビームCTシステムの需要が高まりました。CBCTイメージングは、胸部放射線治療で毎日使用され、放射線技師による肺の外観の定性評価を通じて、治療前に患者の位置と解剖学的構造の変化を確認します。これを考慮して、アジア太平洋地域のさまざまな市場プレーヤーは、診断手順全体を容易にするための新しい革新的な製品を発売しました。したがって、COVID-19パンデミックは、コーンビームCT市場に中程度のプラスの影響を与えています。
コーンビームCT市場地域別分析
予測期間を通じてコーンビーム コンピューター断層撮影市場に影響を与える地域的な傾向と要因は、Insight Partners のアナリストによって徹底的に説明されています。このセクションでは、北米、ヨーロッパ、アジア太平洋、中東、アフリカ、南米、中米にわたるコーンビーム コンピューター断層撮影市場のセグメントと地域についても説明します。

- コーンビームCT市場の地域別データを入手
コーンビームCT市場レポートの範囲
| レポート属性 | 詳細 |
|---|---|
| 2022年の市場規模 | 12億1千万米ドル |
| 2028年までの市場規模 | 22億8千万米ドル |
| 世界のCAGR(2022年 - 2028年) | 11.1% |
| 履歴データ | 2020-2021 |
| 予測期間 | 2023-2028 |
| 対象セグメント | タイプ別
|
| 対象地域と国 | 北米
|
| 市場リーダーと主要企業プロフィール |
|
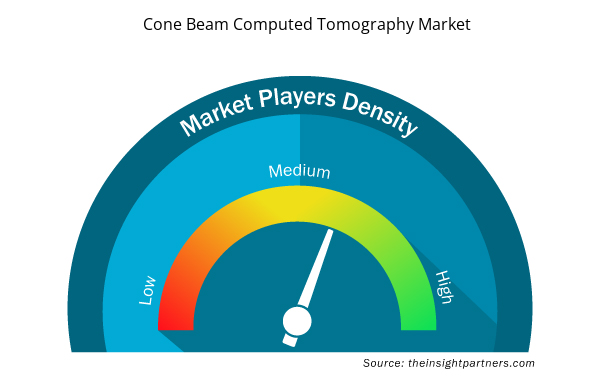
市場プレーヤーの密度:ビジネスダイナミクスへの影響を理解する
コーンビーム コンピューター断層撮影市場は、消費者の嗜好の変化、技術の進歩、製品の利点に対する認識の高まりなどの要因により、エンドユーザーの需要が高まり、急速に成長しています。需要が高まるにつれて、企業は提供内容を拡大し、消費者のニーズを満たすために革新し、新たなトレンドを活用し、市場の成長をさらに促進しています。
市場プレーヤー密度とは、特定の市場または業界内で活動している企業または会社の分布を指します。これは、特定の市場スペースに、その規模または総市場価値と比較して、どれだけの競合相手 (市場プレーヤー) が存在するかを示します。
コーンビームコンピューター断層撮影市場で事業を展開している主要企業は次のとおりです。
- デンツプライシロナ株式会社
- ニュートム
- ケアストリームデンタルLLC
- フュッセングループ
- プレシオン
免責事項:上記の企業は、特定の順序でランク付けされていません。

- コーンビームCT市場のトップキープレーヤーの概要を入手
コーンビームCT - 市場セグメンテーション
患者の体位に基づいて、コーンビーム CT 市場は、立位、座位、仰臥位に分類されます。アプリケーション別には、歯科、耳鼻咽喉科、乳がん、頭蓋底、整形外科、その他に分類されます。エンドユーザーの観点からは、コーンビーム CT 市場は、病院と診療所、診断センター、その他に分類されます。地理に基づいて、市場は北米 (米国、カナダ、メキシコ)、ヨーロッパ (フランス、ドイツ、英国、スペイン、イタリア、その他のヨーロッパ)、アジア太平洋 (中国、インド、日本、オーストラリア、韓国、その他の APAC)、中東およびアフリカ (サウジアラビア、UAE、南アフリカ、その他の MEA)、南米および中米 (ブラジル、アルゼンチン、その他の南米および中米) に分類されます。
企業プロフィール
- デンツプライシロナ株式会社
- ニュートム
- ケアストリームデンタルLLC
- フュッセングループ
- プレシオン
- ブレインラボAG
- アイデテックメディカルイメージング
- ヴァテック株式会社
- プランメカ株式会社
- キヤノンメディカルシステムズ
- 過去2年間の分析、基準年、CAGRによる予測(7年間)
- PEST分析とSWOT分析
- 市場規模価値/数量 - 世界、地域、国
- 業界と競争環境
- Excel データセット


Report Coverage
Revenue forecast, Company Analysis, Industry landscape, Growth factors, and Trends

Segment Covered
This text is related
to segments covered.

Regional Scope
North America, Europe, Asia Pacific, Middle East & Africa, South & Central America

Country Scope
This text is related
to country scope.
よくある質問
The dental segment held the largest share of the market in 2022. The ENT segment is estimated to register the highest CAGR in the market during the forecast period.
The Asia Pacific is expected to be the fastest-growing region in the cone beam computed tomography market over the forecast period due to the various advantages offered by CBCT devices such as short processing time, better image quality, and high conversion efficiency.
The Biosimilars market is estimated to be valued at US$ 1,214.51 million in 2022.
The Biosimilars market is expected to be valued at US$ 2,278.41 million in 2028.
The CAGR value of the cone beam computed tomography market during the forecasted period of 2022-2028 is 11.1%.
The cone beam computed tomography market majorly consists of the players, such as Dentsply Sirona Inc, Newtom, Carestream Dental LLC.; Fussen Group, PreXion, Brainlab AG, IDETEC MEDICAL IMAGING, Vatech Co., Ltd.; Planmeca Oy, and Canon Medical Systems.
The factors that are driving the growth of the cone beam computed tomography market are the driving factors the growth of the standing segment are various advantages offered by CBCT devices such as short processing time, better image quality, and high conversion efficiency. Also, the increasing cases of dental disorders. These are some of the major factors contributing to the growth of the cone beam computed tomography industry.
Cone beam computed tomography (CBCT) is a radiographic imaging modality that provides accurate, three-dimensional (3D) imaging of hard tissue structures. CBCT is the most significant medical diagnostic imaging modality to emerge. This imaging modality can provide submillimeter resolution images of higher diagnostic quality with shorter scan times. Cone beam computed tomography provides endodontists with three-dimensional patient views. In certain cases, CBCT improves the physician's ability to diagnose, evaluate, treat, and care for patients.
Trends and growth analysis reports related to Life Sciences : READ MORE..
The List of Companies - Cone Beam Computed Tomography (CBCT) Market
- Dentsply Sirona Inc
- Newtom
- Carestream Dental LLC
- Fussen Group
- PreXion
- Brainlab AG
- IDETEC MEDICAL IMAGING
- Vatech Co., Ltd.
- Planmeca Oy
- Canon Medical Systems
The Insight Partners performs research in 4 major stages: Data Collection & Secondary Research, Primary Research, Data Analysis and Data Triangulation & Final Review.
- Data Collection and Secondary Research:
As a market research and consulting firm operating from a decade, we have published and advised several client across the globe. First step for any study will start with an assessment of currently available data and insights from existing reports. Further, historical and current market information is collected from Investor Presentations, Annual Reports, SEC Filings, etc., and other information related to company’s performance and market positioning are gathered from Paid Databases (Factiva, Hoovers, and Reuters) and various other publications available in public domain.
Several associations trade associates, technical forums, institutes, societies and organization are accessed to gain technical as well as market related insights through their publications such as research papers, blogs and press releases related to the studies are referred to get cues about the market. Further, white papers, journals, magazines, and other news articles published in last 3 years are scrutinized and analyzed to understand the current market trends.
- Primary Research:
The primarily interview analysis comprise of data obtained from industry participants interview and answers to survey questions gathered by in-house primary team.
For primary research, interviews are conducted with industry experts/CEOs/Marketing Managers/VPs/Subject Matter Experts from both demand and supply side to get a 360-degree view of the market. The primary team conducts several interviews based on the complexity of the markets to understand the various market trends and dynamics which makes research more credible and precise.
A typical research interview fulfils the following functions:
- Provides first-hand information on the market size, market trends, growth trends, competitive landscape, and outlook
- Validates and strengthens in-house secondary research findings
- Develops the analysis team’s expertise and market understanding
Primary research involves email interactions and telephone interviews for each market, category, segment, and sub-segment across geographies. The participants who typically take part in such a process include, but are not limited to:
- Industry participants: VPs, business development managers, market intelligence managers and national sales managers
- Outside experts: Valuation experts, research analysts and key opinion leaders specializing in the electronics and semiconductor industry.
Below is the breakup of our primary respondents by company, designation, and region:

Once we receive the confirmation from primary research sources or primary respondents, we finalize the base year market estimation and forecast the data as per the macroeconomic and microeconomic factors assessed during data collection.
- Data Analysis:
Once data is validated through both secondary as well as primary respondents, we finalize the market estimations by hypothesis formulation and factor analysis at regional and country level.
- Macro-Economic Factor Analysis:
We analyse macroeconomic indicators such the gross domestic product (GDP), increase in the demand for goods and services across industries, technological advancement, regional economic growth, governmental policies, the influence of COVID-19, PEST analysis, and other aspects. This analysis aids in setting benchmarks for various nations/regions and approximating market splits. Additionally, the general trend of the aforementioned components aid in determining the market's development possibilities.
- Country Level Data:
Various factors that are especially aligned to the country are taken into account to determine the market size for a certain area and country, including the presence of vendors, such as headquarters and offices, the country's GDP, demand patterns, and industry growth. To comprehend the market dynamics for the nation, a number of growth variables, inhibitors, application areas, and current market trends are researched. The aforementioned elements aid in determining the country's overall market's growth potential.
- Company Profile:
The “Table of Contents” is formulated by listing and analyzing more than 25 - 30 companies operating in the market ecosystem across geographies. However, we profile only 10 companies as a standard practice in our syndicate reports. These 10 companies comprise leading, emerging, and regional players. Nonetheless, our analysis is not restricted to the 10 listed companies, we also analyze other companies present in the market to develop a holistic view and understand the prevailing trends. The “Company Profiles” section in the report covers key facts, business description, products & services, financial information, SWOT analysis, and key developments. The financial information presented is extracted from the annual reports and official documents of the publicly listed companies. Upon collecting the information for the sections of respective companies, we verify them via various primary sources and then compile the data in respective company profiles. The company level information helps us in deriving the base number as well as in forecasting the market size.
- Developing Base Number:
Aggregation of sales statistics (2020-2022) and macro-economic factor, and other secondary and primary research insights are utilized to arrive at base number and related market shares for 2022. The data gaps are identified in this step and relevant market data is analyzed, collected from paid primary interviews or databases. On finalizing the base year market size, forecasts are developed on the basis of macro-economic, industry and market growth factors and company level analysis.
- Data Triangulation and Final Review:
The market findings and base year market size calculations are validated from supply as well as demand side. Demand side validations are based on macro-economic factor analysis and benchmarks for respective regions and countries. In case of supply side validations, revenues of major companies are estimated (in case not available) based on industry benchmark, approximate number of employees, product portfolio, and primary interviews revenues are gathered. Further revenue from target product/service segment is assessed to avoid overshooting of market statistics. In case of heavy deviations between supply and demand side values, all thes steps are repeated to achieve synchronization.
We follow an iterative model, wherein we share our research findings with Subject Matter Experts (SME’s) and Key Opinion Leaders (KOLs) until consensus view of the market is not formulated – this model negates any drastic deviation in the opinions of experts. Only validated and universally acceptable research findings are quoted in our reports.
We have important check points that we use to validate our research findings – which we call – data triangulation, where we validate the information, we generate from secondary sources with primary interviews and then we re-validate with our internal data bases and Subject matter experts. This comprehensive model enables us to deliver high quality, reliable data in shortest possible time.


 このレポートの無料サンプルを入手する