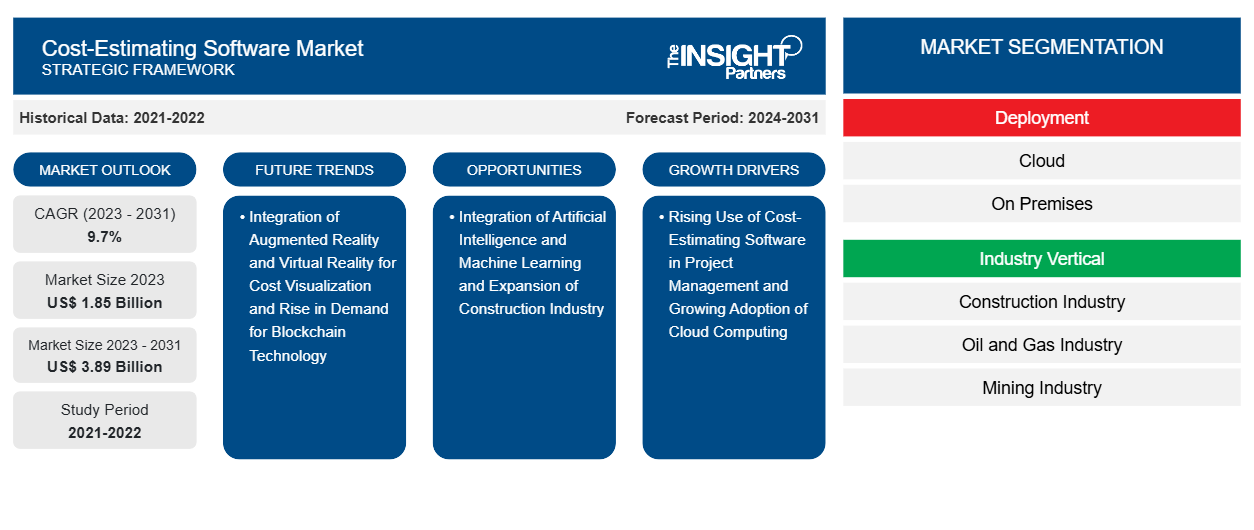
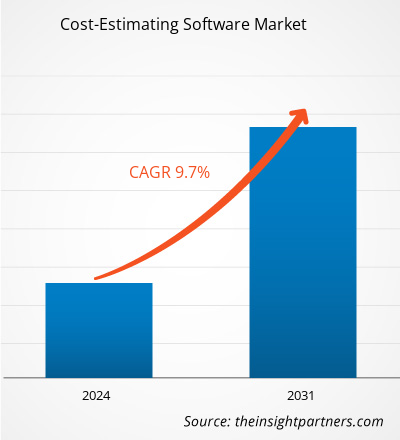
コスト見積ソフトウェアの市場規模は、2023 年の 18 億 5,000 万米ドルから 2031 年には 38 億 9,000 万米ドルに達すると予想されています。市場は 2023 年から 2031 年にかけて 9.7% の CAGR を記録すると予測されています。コストの視覚化のための拡張現実と仮想現実の統合は、引き続き主要な市場トレンドとなると思われます。
コスト見積ソフトウェア市場分析
コスト見積りソフトウェア市場は、プロジェクト管理におけるソフトウェアの使用増加により、予測期間中に大幅に成長すると予測されています。ソフトウェアは、プロジェクトマネージャー、エンジニア、およびコスト見積り担当者が、プロジェクトをそのパラメータ内で完了するために必要な財務リソースを見積もるのに役立ちます。さらに、コスト見積りのためのクラウドコンピューティングの採用が拡大するにつれて、企業は関連データにすばやくアクセスし、正確な見積りをシームレスに生成できます。さらに、人工知能(AI)や機械学習(ML)などの高度なテクノロジーの採用が拡大することで、より正確な予測が提供され、コスト見積りの精度が大幅に向上します。また、建設活動の増加により、プロジェクトの費用を迅速かつ正確に見積もることができるため、コスト見積りソフトウェアの需要が促進されると予想されます。さらに、VRとARによるコストの視覚化の需要の高まりと、透明性のあるコスト見積りのためのブロックチェーンテクノロジーの統合により、予測期間中にコスト見積りソフトウェア市場の成長が促進されると予想されます。
コスト見積ソフトウェア市場の概要
コスト見積ソフトウェアは、複数のアプローチとリソースを組み合わせて、正確なコスト見積を提供します。このソフトウェアは、過去のデータと現在の市場動向を組み合わせることで、組織がより情報に基づいた財務上の決定を下せるよう支援します。このソフトウェアには、ユーザーが詳細な予算編成と経費分析を行えるようにするさまざまな機能が組み込まれています。難しい計算を自動化することで、人為的ミスの可能性が大幅に減ります。さらに、リアルタイムのデータ修正が可能になり、プロジェクトのライフサイクル全体にわたって見積りの妥当性が保証されます。
要件に合わせてレポートをカスタマイズする
このレポートの一部、国レベルの分析、Excelデータパックなど、あらゆるレポートを無料でカスタマイズできます。また、スタートアップや大学向けのお得なオファーや割引もご利用いただけます。
コスト見積ソフトウェア市場:
- このレポートの主要な市場動向を入手してください。この無料サンプルには、市場動向から見積もりや予測に至るまでのデータ分析が含まれます。
コスト見積ソフトウェア市場の推進要因と機会
プロジェクト管理におけるコスト見積ソフトウェアの利用増加
効率と正確性は、常に変化するプロジェクト管理の分野では非常に重要です。コスト見積ソフトウェアを使用すると、これらの領域が大幅に改善され、いくつかの利点が得られます。洗練されたアルゴリズムを使用してエラーを削減することで精度が大幅に向上し、より正確な予算見積りが保証されます。さらに、ソフトウェアは見積り手順を加速します。数時間または数日かかっていたタスクも、ソフトウェアを使用すると数分で完了できます。時間の節約に加えて、この有効性により、プロジェクト マネージャーは変更に迅速に対応し、遅延を回避できます。
コスト見積りソフトウェアは、標準化された計算方法を使用するため、すべてのプロジェクト見積りの一貫性が確保され、優れた一貫性を提供します。この一貫性は、さまざまなプロジェクトや提案の正確な比較と分析に必要です。このソフトウェアは意思決定も改善します。管理者が正確で信頼できるデータを自由に使用できる場合、プロジェクトの実行可能性と予算の割り当てについてより適切な決定を下すことができます。その結果、プロジェクトはより戦略的に計画および実行され、リソースが最大化され、無駄が削減されます。コスト見積りソフトウェアは、プロジェクトチームメンバー間の説明責任とオープン性も促進します。詳細なコストの内訳にアクセスできるため、経費の追跡と予算上の選択の擁護が容易になり、関係者間の信頼が構築され、プロジェクトの成功が促進されます。したがって、コスト見積りソフトウェアは、説明責任と戦略的意思決定を促進するために精度と効率を高めるのに役立つため、その需要が高まり、コスト見積りソフトウェア市場の成長が世界的に促進されています。
人工知能と機械学習の統合
従来のコスト見積もりモデルは、手動で選択した特性に依存することが多く、時間がかかり、偏りが生じやすいものです。しかし、AI や ML などのテクノロジーを使用すると、より正確な予測を提供することで、コスト見積もりの精度を大幅に向上させることができます。大規模なデータセットは、AI アルゴリズムによって迅速に分析できます。その結果、人間のアナリストが見逃す傾向やパターンを見つけることができます。この機能により、さまざまな変数を考慮した複雑なコスト予測を作成できます。AI システムは常に最新のデータから学習します。これは、時間の経過とともに精度が向上する結果、見積もりがより正確になることを意味します。
同様に、機械学習は予測の精度向上にも役立ちます。洗練されたモデルを使用することで、ML は多くのシナリオで費用を予測できます。プロジェクト コストに影響を与える可能性のあるさまざまな要因を考慮します。たとえば、分析には労働賃金や材料費の変化が自動的に組み込まれます。柔軟性があるため、プロジェクトの状況が変わっても、見積もりは正確で関連性が保たれます。さらに、AI と ML により見積もりにかかる時間が大幅に短縮され、計画段階がスピードアップし、市場の変化に迅速に対応できるようになります。したがって、AI や ML などの高度なテクノロジーの統合により、予測期間中にコスト見積もりソフトウェア市場の成長が促進されると予想されます。
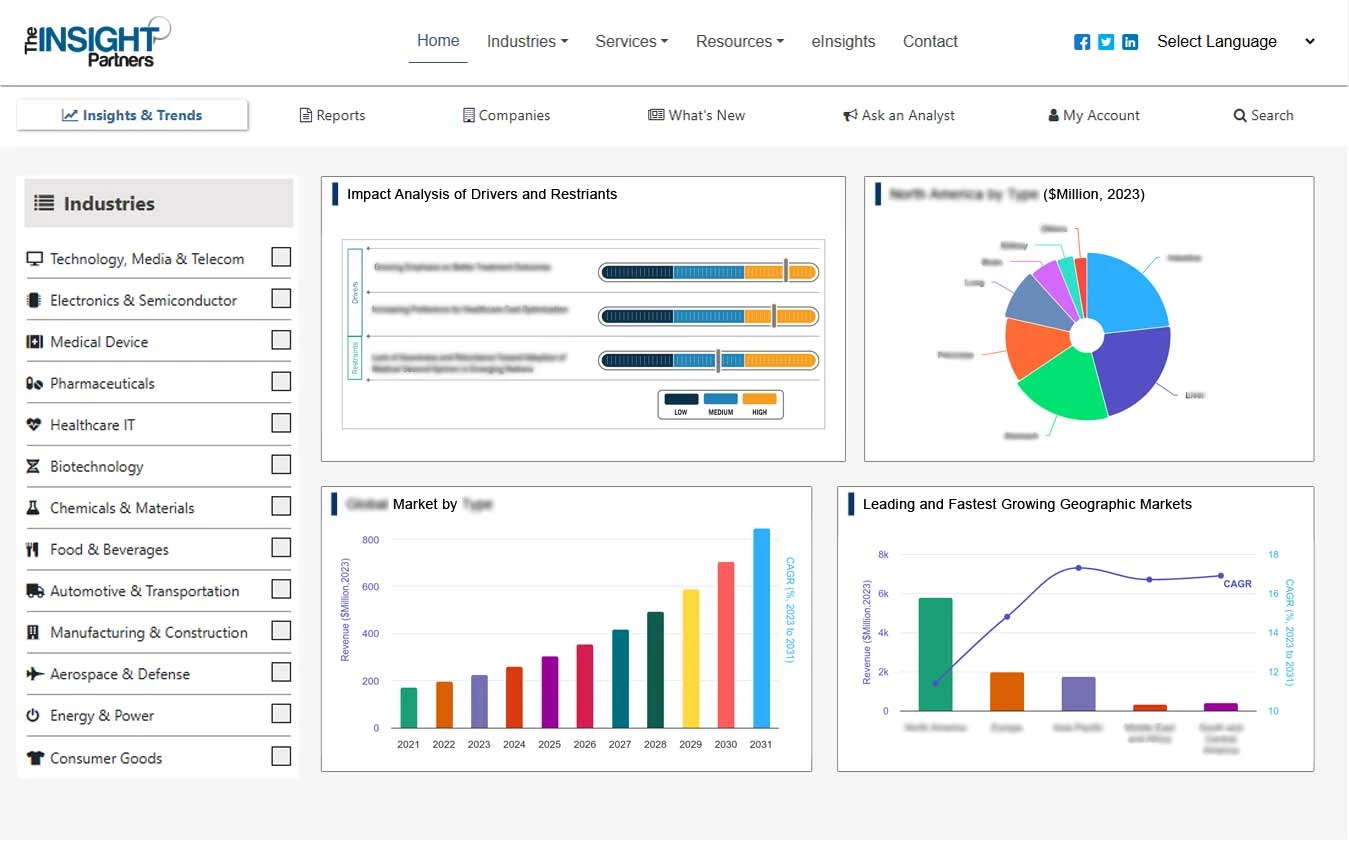
コスト見積ソフトウェア市場レポートのセグメンテーション分析
コスト見積ソフトウェア市場分析の導出に貢献した主要なセグメントは、展開と業界垂直です。
- 展開によって、市場はクラウドとオンプレミスに分かれています。2023 年にはクラウド セグメントが市場を支配しました。
- 業界別では、市場は建設業界、石油・ガス業界、鉱業、エネルギー業界、その他に分類されています。2023年には建設業界セグメントが市場を支配しました。
地域別のコスト見積ソフトウェア市場シェア分析
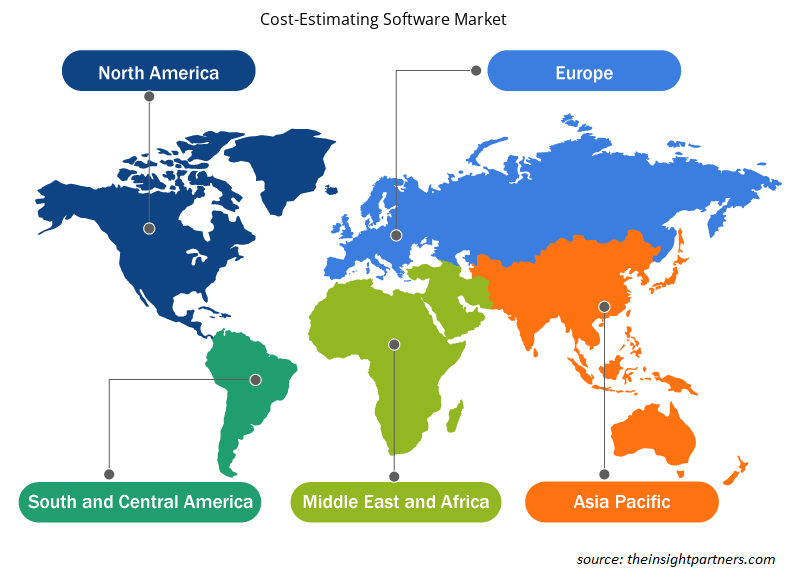
- コスト見積ソフトウェア市場は、北米、ヨーロッパ、アジア太平洋 (APAC)、中東およびアフリカ (MEA)、南米および中米の 5 つの主要地域に分割されています。2023 年には北米が市場を支配し、ヨーロッパと APAC がそれに続きました。
- 北米のコスト見積りソフトウェア市場は、建設業界への投資増加により、大幅に成長しています。北米市場では米国がリードしており、カナダとメキシコが市場シェアで僅差で追っています。さらに、さまざまな企業が北米でコスト見積りソフトウェアを提供しています。たとえば、RSMeans Data Online は北米でトップの建設見積りソフトウェアとされています。これは共同アクセスを必要とする企業によく使われるオプションで、建設見積りの要件に合わせて 3 つのレベルが用意されています。同社は、材料、設備、労働力、生産性の詳細を含む、北米の建設コストの完全なデータベースを提供しています。
コスト見積ソフトウェア市場の地域別分析
予測期間を通じてコスト見積ソフトウェア市場に影響を与える地域的な傾向と要因は、Insight Partners のアナリストによって徹底的に説明されています。このセクションでは、北米、ヨーロッパ、アジア太平洋、中東およびアフリカ、南米および中米にわたるコスト見積ソフトウェア市場のセグメントと地理についても説明します。
- コスト見積ソフトウェア市場の地域別データを入手
コスト見積ソフトウェア市場レポートの範囲
| レポート属性 | 詳細 |
|---|---|
| 2023年の市場規模 | 18億5千万米ドル |
| 2031年までの市場規模 | 38億9000万米ドル |
| 世界のCAGR(2023年~2031年) | 9.7% |
| 履歴データ | 2021-2022 |
| 予測期間 | 2024-2031 |
| 対象セグメント | 展開別
|
| 対象地域と国 | 北米
|
| 市場リーダーと主要企業プロフィール |
|
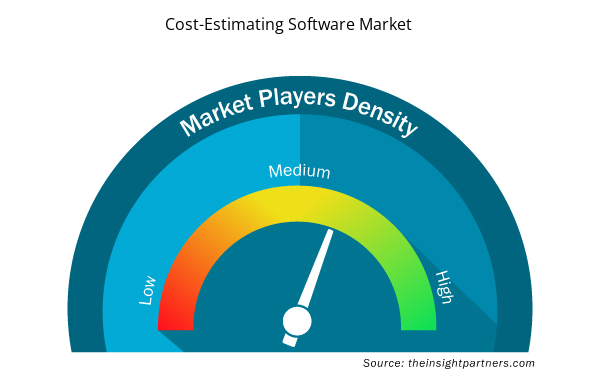
コスト見積ソフトウェア市場のプレーヤー密度: ビジネスダイナミクスへの影響を理解する
コスト見積ソフトウェア市場は、消費者の嗜好の変化、技術の進歩、製品の利点に対する認識の高まりなどの要因により、エンドユーザーの需要が高まり、急速に成長しています。需要が高まるにつれて、企業は提供内容を拡大し、消費者のニーズを満たすために革新し、新たなトレンドを活用し、市場の成長をさらに促進しています。
市場プレーヤー密度とは、特定の市場または業界内で活動している企業または会社の分布を指します。これは、特定の市場スペースに、その市場規模または総市場価値に対してどれだけの競合相手 (市場プレーヤー) が存在するかを示します。
コスト見積ソフトウェア市場で事業を展開している主要企業は次のとおりです。
- セールスフォース株式会社
- オラクル社
- セージグループ
- トリンブル株式会社
- プロコアテクノロジーズ株式会社
- オートデスク株式会社
免責事項:上記の企業は、特定の順序でランク付けされていません。
- コスト見積ソフトウェア市場のトップキープレーヤーの概要を入手
コスト見積ソフトウェア市場のニュースと最近の動向
コスト見積りソフトウェア市場は、主要な企業出版物、協会データ、データベースなどの一次調査と二次調査後の定性的および定量的データを収集することによって評価されます。コスト見積りソフトウェア市場におけるいくつかの動向を以下に示します。
- CRM の世界的リーダーである Salesforce は、ハイデラバードのセンター オブ エクセレンス (CoE) の拡張を発表し、インドにおける同社のプレゼンスを大幅に強化しました。Salesforce は過去 10 年間インドに投資してきました。ハイデラバードの CoE は 2016 年にオープンし、インドを同社の主要な人材とグローバル イノベーションの中心地として確固たる地位に押し上げました。Salesforce は、インドのベンガルール、ムンバイ、デリー、ハイデラバード、プネ、ジャイプールのオフィスに 9,000 人を超える従業員を擁しています。
(出典:Salesforce、プレスリリース、2023年3月)
- Oracle は、エンジニアリングおよび建設業界向けの AI および分析アプリケーションの新しいスイートである Oracle Construction Intelligence Cloud Service を発表しました。建設プロジェクトでは、生産性、安全性、収益性に影響を与える問題に直面することがよくあります。新しいスイートでは、機械学習を使用して、Oracle Construction and Engineering ソリューションで管理されているプロジェクト データを継続的に分析し、潜在的なリスクや非効率性を早期に特定して、組織がより良い意思決定を行えるようにします。
(出典:Oracle、プレスリリース、2021年2月)
コスト見積ソフトウェア市場レポートの対象範囲と成果物
「コスト見積ソフトウェア市場の規模と予測(2021〜2031年)」では、以下の分野をカバーする市場の詳細な分析を提供します。
- 対象範囲に含まれるすべての主要市場セグメントについて、世界、地域、国レベルでのコスト見積ソフトウェア市場規模と予測
- コスト見積りソフトウェア市場の動向、および推進要因、制約、主要な機会などの市場動向
- 詳細なPESTおよびSWOT分析
- 主要な市場動向、世界および地域の枠組み、主要プレーヤー、規制、最近の市場動向を網羅したコスト見積ソフトウェア市場分析
- 市場集中、ヒートマップ分析、主要プレーヤー、コスト見積ソフトウェア市場の最近の動向を網羅した業界の状況と競争分析
- 詳細な企業プロフィール
- 過去2年間の分析、基準年、CAGRによる予測(7年間)
- PEST分析とSWOT分析
- 市場規模価値/数量 - 世界、地域、国
- 業界と競争環境
- Excel データセット

Report Coverage
Revenue forecast, Company Analysis, Industry landscape, Growth factors, and Trends

Segment Covered
This text is related
to segments covered.

Regional Scope
North America, Europe, Asia Pacific, Middle East & Africa, South & Central America

Country Scope
This text is related
to country scope.
よくある質問
Asia Pacific is anticipated to grow at the fastest CAGR over the forecast period.
The key players operating in the cost-estimating software market include Salesforce Inc, Oracle Corp, Sage Group Plc, Trimble Inc, Procore Technologies Inc, Autodesk Inc, RIB Software, Elecosoft, ConstructConnect, and MTI Systems, Inc.
The cloud segment led the cost-estimating software market with a significant share in 2023.
Integration of augmented reality and virtual reality for cost visualization is expected to drive the growth of the cost-estimating software market in the coming years.
The cost-estimating software market is expected to reach US$ 3.89 Billion by 2031.
The rising use of cost-estimating software in project management and the growing adoption of cloud computing are driving factors in the cost-estimating software market.
The cost-estimating software market was estimated to be valued at US$ 1.85 billion in 2023 and is anticipated to grow at a CAGR of 9.7% over the forecast period.
Trends and growth analysis reports related to Technology, Media and Telecommunications : READ MORE..
The List of Companies - Cost-Estimating Software Market
- Salesforce Inc
- Oracle Corp
- Sage Group Plc
- Trimble Inc
- Procore Technologies Inc
- Autodesk Inc
- RIB Software
- Elecosoft
- ConstructConnect
- MTI Systems, Inc
The Insight Partners performs research in 4 major stages: Data Collection & Secondary Research, Primary Research, Data Analysis and Data Triangulation & Final Review.
- Data Collection and Secondary Research:
As a market research and consulting firm operating from a decade, we have published and advised several client across the globe. First step for any study will start with an assessment of currently available data and insights from existing reports. Further, historical and current market information is collected from Investor Presentations, Annual Reports, SEC Filings, etc., and other information related to company’s performance and market positioning are gathered from Paid Databases (Factiva, Hoovers, and Reuters) and various other publications available in public domain.
Several associations trade associates, technical forums, institutes, societies and organization are accessed to gain technical as well as market related insights through their publications such as research papers, blogs and press releases related to the studies are referred to get cues about the market. Further, white papers, journals, magazines, and other news articles published in last 3 years are scrutinized and analyzed to understand the current market trends.
- Primary Research:
The primarily interview analysis comprise of data obtained from industry participants interview and answers to survey questions gathered by in-house primary team.
For primary research, interviews are conducted with industry experts/CEOs/Marketing Managers/VPs/Subject Matter Experts from both demand and supply side to get a 360-degree view of the market. The primary team conducts several interviews based on the complexity of the markets to understand the various market trends and dynamics which makes research more credible and precise.
A typical research interview fulfils the following functions:
- Provides first-hand information on the market size, market trends, growth trends, competitive landscape, and outlook
- Validates and strengthens in-house secondary research findings
- Develops the analysis team’s expertise and market understanding
Primary research involves email interactions and telephone interviews for each market, category, segment, and sub-segment across geographies. The participants who typically take part in such a process include, but are not limited to:
- Industry participants: VPs, business development managers, market intelligence managers and national sales managers
- Outside experts: Valuation experts, research analysts and key opinion leaders specializing in the electronics and semiconductor industry.
Below is the breakup of our primary respondents by company, designation, and region:

Once we receive the confirmation from primary research sources or primary respondents, we finalize the base year market estimation and forecast the data as per the macroeconomic and microeconomic factors assessed during data collection.
- Data Analysis:
Once data is validated through both secondary as well as primary respondents, we finalize the market estimations by hypothesis formulation and factor analysis at regional and country level.
- Macro-Economic Factor Analysis:
We analyse macroeconomic indicators such the gross domestic product (GDP), increase in the demand for goods and services across industries, technological advancement, regional economic growth, governmental policies, the influence of COVID-19, PEST analysis, and other aspects. This analysis aids in setting benchmarks for various nations/regions and approximating market splits. Additionally, the general trend of the aforementioned components aid in determining the market's development possibilities.
- Country Level Data:
Various factors that are especially aligned to the country are taken into account to determine the market size for a certain area and country, including the presence of vendors, such as headquarters and offices, the country's GDP, demand patterns, and industry growth. To comprehend the market dynamics for the nation, a number of growth variables, inhibitors, application areas, and current market trends are researched. The aforementioned elements aid in determining the country's overall market's growth potential.
- Company Profile:
The “Table of Contents” is formulated by listing and analyzing more than 25 - 30 companies operating in the market ecosystem across geographies. However, we profile only 10 companies as a standard practice in our syndicate reports. These 10 companies comprise leading, emerging, and regional players. Nonetheless, our analysis is not restricted to the 10 listed companies, we also analyze other companies present in the market to develop a holistic view and understand the prevailing trends. The “Company Profiles” section in the report covers key facts, business description, products & services, financial information, SWOT analysis, and key developments. The financial information presented is extracted from the annual reports and official documents of the publicly listed companies. Upon collecting the information for the sections of respective companies, we verify them via various primary sources and then compile the data in respective company profiles. The company level information helps us in deriving the base number as well as in forecasting the market size.
- Developing Base Number:
Aggregation of sales statistics (2020-2022) and macro-economic factor, and other secondary and primary research insights are utilized to arrive at base number and related market shares for 2022. The data gaps are identified in this step and relevant market data is analyzed, collected from paid primary interviews or databases. On finalizing the base year market size, forecasts are developed on the basis of macro-economic, industry and market growth factors and company level analysis.
- Data Triangulation and Final Review:
The market findings and base year market size calculations are validated from supply as well as demand side. Demand side validations are based on macro-economic factor analysis and benchmarks for respective regions and countries. In case of supply side validations, revenues of major companies are estimated (in case not available) based on industry benchmark, approximate number of employees, product portfolio, and primary interviews revenues are gathered. Further revenue from target product/service segment is assessed to avoid overshooting of market statistics. In case of heavy deviations between supply and demand side values, all thes steps are repeated to achieve synchronization.
We follow an iterative model, wherein we share our research findings with Subject Matter Experts (SME’s) and Key Opinion Leaders (KOLs) until consensus view of the market is not formulated – this model negates any drastic deviation in the opinions of experts. Only validated and universally acceptable research findings are quoted in our reports.
We have important check points that we use to validate our research findings – which we call – data triangulation, where we validate the information, we generate from secondary sources with primary interviews and then we re-validate with our internal data bases and Subject matter experts. This comprehensive model enables us to deliver high quality, reliable data in shortest possible time.
 このレポートの無料サンプルを入手する