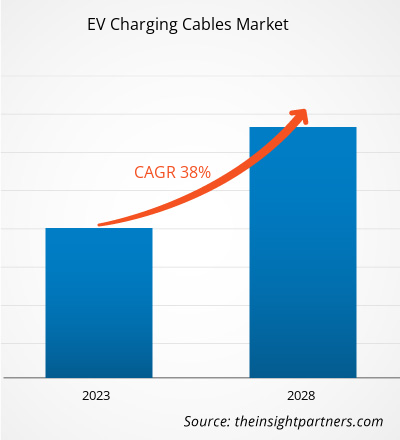
[調査レポート] EV充電ケーブル市場は、2022年の5億1,336万米ドルから2028年には35億5,178万米ドルに成長すると予想されています。2022年から2028年にかけてCAGR 38.0%で成長すると予測されています。
複数の国の政府が導入したインセンティブにより、今後5年間で欧州のEV充電ケーブル市場の 成長が促進されると予想されています。国際エネルギー機関(IEA)によると、欧州は電気自動車市場の成長が最も速い地域で、2016年から2020年までの年平均成長率は60%で、中国では36%、米国では17%の増加となっています。EU最大の市場であるドイツでは、EV充電ケーブル市場規模を拡大するためのいくつかの政策が策定されています。この政策によると、2020年末までに登録された個人所有のEVは10年間免税となり、販売価格が45,300米ドル未満のEVは2021年12月まで10,100米ドルの補助金の対象となります。スペインは、マドリードやバルセロナなどの大都市でEVに対する税金を75%削減しました。同国はまた、7年以上経過した車両を廃車にするかどうかに応じて、EVの購入に4,067~5,083米ドルの補助金を出す制度を設けている。イタリアでは、EVは登録から5年間免税となり、その後は75%の減税となる。イタリアにはボーナス・マルス制度もある。この制度によると、CO2排出量が1kmあたり70g未満の車両には1台あたり最大6,100米ドルの補助金が支給されるが、CO2排出量が1kmあたり250gを超えると1台あたり2,541米ドルのペナルティが課せられる。欧州諸国によるこのような取り組みはEVの採用を促進し、最終的には同地域のEV充電ケーブル市場の成長を後押しすることになる。
さらに、欧州はガソリン車とディーゼル車を段階的に廃止し、ほぼ 150 年続いた内燃機関の時代に終止符を打つために前例のない措置を講じています。英国が 2030 年にこれらの従来型自動車を禁止し、ドイツが EV に対する補助金を 4 年間延長したことは、政府が自動車メーカーに電動化を受け入れさせるために取っている誘導アプローチを反映しています。規制圧力により、EV は既に世界中の他のどの先進自動車市場よりも欧州で自動車販売の大きなシェアを獲得しており、EV 充電ケーブル市場の成長が加速しています。さらに、電気自動車と従来型自動車のコスト ギャップを埋めるために、欧州の国や地方自治体は、1 回限りの補助金、自動車購入と運用に対する減税、または特定の道路インフラへの優先アクセスまたは無料アクセスという形で消費者インセンティブを提供することがよくあります。また、2019 年の初めには、欧州連合 (EU) が、 EV の普及を成功させるために不可欠と考えられている動きとして、新築住宅やアパートに電気自動車の充電器を設置することを義務付ける規制を承認し ました。欧州の主要市場ではさまざまなパターンの公共充電インフラが出現しており、予測期間中にこの地域の EV 充電ケーブルの市場シェアが拡大すると予想されます。
要件に合わせて調査をカスタマイズ
弊社の標準サービスでは対応できない分析と範囲を最適化し、カスタマイズすることができます。この柔軟性により、ビジネス計画と意思決定に必要な正確な情報を得ることができます。
EV充電ケーブル市場:

CAGR (2022 - 2028)38.0%- 市場規模 2022年
5億1,336万米ドル - 市場規模 2028年
35億5,178万米ドル

市場の動向
- XXXXXXXXX
- XXXXXXXXX
- XXXXXXXXX
- XXXXXXXXX
- XXXXXXXXX
- XXXXXXXXX
- XXXXXXXXX
- XXXXXXXXX
- XXXXXXXXX
主要人物
- ベセンインターナショナルグループ株式会社
- コロプラストグループ
- ダイデン株式会社
- ゼネラル・ケーブル・テクノロジーズ・コーポレーション
- フェニックスコンタクトEモビリティ
- シンボンエレクトロニクス株式会社
- システムワイヤとケーブル
- TEコネクティビティ
- テイソンエナジーテクノロジー株式会社
地域概要

- 北米
- ヨーロッパ
- アジア太平洋地域
- 南米と中央アメリカ
- 中東およびアフリカ
市場セグメンテーション
 応用
応用- 公共と私的
 電源タイプ
電源タイプ- AC充電とDC充電
 ケーブルの長さ
- 2?5メートル
- 6?10メートル
- >10メートル
 充電レベル
充電レベル- レベル1
- レベル2
- レベル3
- サンプル PDF では、定性的および定量的な分析により、コンテンツの構造と情報の性質が紹介されています。
COVID-19パンデミックによるEV充電ケーブル市場への影響
2020年、COVID-19パンデミックの影響は欧州各国で異なりました。この地域では、英国、イタリア、ロシア、フランス、ドイツ、スペインがパンデミックの影響を受けた主要国です。感染者数の増加により、これらの国のいくつかは2020年に社会的隔離とともに厳格で長期のロックダウンを実施しなければなりませんでした。ロックダウンは電気自動車の販売に影響を与えましたが、2つの主な理由から電気自動車市場の回復の兆候が早くから見られました。第一に、2020年は排出基準の重要な目標年であったため、特に欧州では政策支援が強力でした。特にドイツでは購入インセンティブが増加しました。第二に、バッテリーコストが継続的に低下し、アップグレードしたOEMがモデルの選択肢と性能を提供し、フリートオペレーターが技術移行を開始し、電気自動車購入者(多くの場合、景気低迷の影響をあまり受けない裕福な世帯)の熱意が、EVの継続的な普及に肥沃な土壌を提供しています。
市場分析 – EV充電ケーブル市場
EV充電ケーブル市場は、世界のその他の地域が支配しています。ヨーロッパは市場に2番目に大きな貢献者であり、北米がそれに続きます。
北米では、電気自動車の充電時間を短縮したいという電気自動車所有者からの需要の高まりと、この地域のさまざまな公的および民間市場プレーヤーによる関心と開発の高まりが、EV充電ケーブル市場の規模を押し上げています。たとえば、2020年にXcel Energyは、2030年までにコロラド州で20%のEV市場浸透に備えるために1億1,000万米ドルを投資する計画を立てました。2020年に、UberとLyftは、2030年までに100%電気化する意向を発表しました。カリフォルニア州とマサチューセッツ州は、2035年までに100%のEV販売を義務付ける予定です。また、米国の高速道路再認可である2019年のアメリカの運輸インフラ法は、公共のEV充電インフラに資本を割り当てています。したがって、公共充電インフラの拡張に対する政府の資金提供を増やすことは、EV市場の成長を促進し、最終的にはEV充電ケーブルの市場シェアを強化することになるだろう。
ケーブルの長さに基づく洞察
ケーブルの長さに基づいて、EV充電ケーブル市場は2〜5メートル、6〜10メートル、10メートル超に分割されています。2021年には、2〜5メートルのセグメントがEV充電ケーブル市場を支配しました。家庭や充電ステーションの面積が小さい場合、2〜5メートルのケーブルの需要が高くなっています。また、同じセグメントは予測期間中も優位性を維持すると予想されます。
Coroplast Group、Sinbon Electronics Co., Ltd.、TE Connectivity、Phoneix Contact、Besen International Group Co., Ltd.、Dyden Corporation、Teison Energy Technology Co., Ltd.、General Cable Technologies Corporation、System Wire Cable、Aptiv、Leoni AG、Brugg eConnect、Ionity Gmbh、Chengdu Khons Technology Co., Ltd. は、EV 充電ケーブル市場調査で紹介されている企業の一部です。これらの企業に加えて、複数の著名な世界的および地域的企業、新興企業、市場破壊者、ニッチ市場プレーヤーが市場調査中に分析されました。
EV充電ケーブル市場レポートの範囲
| レポート属性 | 詳細 |
|---|---|
| 2022年の市場規模 | 5億1,336万米ドル |
| 2028年までの市場規模 | 35億5,178万米ドル |
| 世界のCAGR(2022年 - 2028年) | 38.0% |
| 歴史的なデータ | 2020-2021 |
| 予測期間 | 2023-2028 |
| 対象セグメント | アプリケーション別
|
| 対象地域と国 | 北米
|
| 市場リーダーと主要企業プロフィール |
|
- サンプル PDF では、定性的および定量的な分析により、コンテンツの構造と情報の性質が紹介されています。
EV充電ケーブル市場のプレーヤーは、主に市場イニシアチブ戦略を採用しており、これには世界中での拠点の拡大と顧客需要の急増への対応が含まれます。市場プレーヤーは主に、高度な機能とテクノロジーを自社製品に統合することにより、製品とサービスの強化に重点を置いています。
- 2022年2月、米国運輸省は、米国の州間高速道路システム沿いに電気自動車の充電インフラを整備するため、今後5年間の計画で米国各州に50億ドルを提供する計画を発表した。
- 過去2年間の分析、基準年、CAGRによる予測(7年間)
- PEST分析とSWOT分析
- 市場規模価値/数量 - 世界、地域、国
- 業界と競争環境
- Excel データセット


Report Coverage
Revenue forecast, Company Analysis, Industry landscape, Growth factors, and Trends

Segment Covered
This text is related
to segments covered.

Regional Scope
North America, Europe, Asia Pacific, Middle East & Africa, South & Central America

Country Scope
This text is related
to country scope.
よくある質問
The incremental growth of the EV charging cables market for the RoW region is USD $1,551.76 million.
The private segment led the EV charging cables market in 2021.
The rest of the world is the fastest-growing regional market in the global EV charging cables market in 2021.
The key players holding the major market share of the EV charging cables market are Leoni AG, TE Connectivity, BESEN, Aptiv, and Coroplast.
The global EV charging cables market size is projected to reach US$ 3,551.78 million by 2028.
The global EV charging cables market is expected to be valued at US$ 513.36 million in 2022
The Future trends impacting the EV charging cables market are -- Emergence of E-Mobility and Advanced Charging Technologies
The driving factors impacting the EV charging cables market are
I. Surge in EV Vehicle Production
II. Increase in EV Charging Facilities
Trends and growth analysis reports related to Electronics and Semiconductor : READ MORE..
The List of Companies - EV Charging Cable Market
- Besen International Group Co., Ltd.
- Coroplast Group
- Dyden Corporation
- General Cable Technologies Corporation
- Phoenix Contact E-Mobility
- Sinbon Electronics Co., Ltd.
- Systems Wire and Cable
- TE Connectivity
- Teison Energy Technology Co., Ltd.
- Aptiv
- Leoni AG
- BRUGG eConnect
- Ionity GmbH
- Chengdu Khons Technology Co., Ltd
The Insight Partners performs research in 4 major stages: Data Collection & Secondary Research, Primary Research, Data Analysis and Data Triangulation & Final Review.
- Data Collection and Secondary Research:
As a market research and consulting firm operating from a decade, we have published and advised several client across the globe. First step for any study will start with an assessment of currently available data and insights from existing reports. Further, historical and current market information is collected from Investor Presentations, Annual Reports, SEC Filings, etc., and other information related to company’s performance and market positioning are gathered from Paid Databases (Factiva, Hoovers, and Reuters) and various other publications available in public domain.
Several associations trade associates, technical forums, institutes, societies and organization are accessed to gain technical as well as market related insights through their publications such as research papers, blogs and press releases related to the studies are referred to get cues about the market. Further, white papers, journals, magazines, and other news articles published in last 3 years are scrutinized and analyzed to understand the current market trends.
- Primary Research:
The primarily interview analysis comprise of data obtained from industry participants interview and answers to survey questions gathered by in-house primary team.
For primary research, interviews are conducted with industry experts/CEOs/Marketing Managers/VPs/Subject Matter Experts from both demand and supply side to get a 360-degree view of the market. The primary team conducts several interviews based on the complexity of the markets to understand the various market trends and dynamics which makes research more credible and precise.
A typical research interview fulfils the following functions:
- Provides first-hand information on the market size, market trends, growth trends, competitive landscape, and outlook
- Validates and strengthens in-house secondary research findings
- Develops the analysis team’s expertise and market understanding
Primary research involves email interactions and telephone interviews for each market, category, segment, and sub-segment across geographies. The participants who typically take part in such a process include, but are not limited to:
- Industry participants: VPs, business development managers, market intelligence managers and national sales managers
- Outside experts: Valuation experts, research analysts and key opinion leaders specializing in the electronics and semiconductor industry.
Below is the breakup of our primary respondents by company, designation, and region:

Once we receive the confirmation from primary research sources or primary respondents, we finalize the base year market estimation and forecast the data as per the macroeconomic and microeconomic factors assessed during data collection.
- Data Analysis:
Once data is validated through both secondary as well as primary respondents, we finalize the market estimations by hypothesis formulation and factor analysis at regional and country level.
- Macro-Economic Factor Analysis:
We analyse macroeconomic indicators such the gross domestic product (GDP), increase in the demand for goods and services across industries, technological advancement, regional economic growth, governmental policies, the influence of COVID-19, PEST analysis, and other aspects. This analysis aids in setting benchmarks for various nations/regions and approximating market splits. Additionally, the general trend of the aforementioned components aid in determining the market's development possibilities.
- Country Level Data:
Various factors that are especially aligned to the country are taken into account to determine the market size for a certain area and country, including the presence of vendors, such as headquarters and offices, the country's GDP, demand patterns, and industry growth. To comprehend the market dynamics for the nation, a number of growth variables, inhibitors, application areas, and current market trends are researched. The aforementioned elements aid in determining the country's overall market's growth potential.
- Company Profile:
The “Table of Contents” is formulated by listing and analyzing more than 25 - 30 companies operating in the market ecosystem across geographies. However, we profile only 10 companies as a standard practice in our syndicate reports. These 10 companies comprise leading, emerging, and regional players. Nonetheless, our analysis is not restricted to the 10 listed companies, we also analyze other companies present in the market to develop a holistic view and understand the prevailing trends. The “Company Profiles” section in the report covers key facts, business description, products & services, financial information, SWOT analysis, and key developments. The financial information presented is extracted from the annual reports and official documents of the publicly listed companies. Upon collecting the information for the sections of respective companies, we verify them via various primary sources and then compile the data in respective company profiles. The company level information helps us in deriving the base number as well as in forecasting the market size.
- Developing Base Number:
Aggregation of sales statistics (2020-2022) and macro-economic factor, and other secondary and primary research insights are utilized to arrive at base number and related market shares for 2022. The data gaps are identified in this step and relevant market data is analyzed, collected from paid primary interviews or databases. On finalizing the base year market size, forecasts are developed on the basis of macro-economic, industry and market growth factors and company level analysis.
- Data Triangulation and Final Review:
The market findings and base year market size calculations are validated from supply as well as demand side. Demand side validations are based on macro-economic factor analysis and benchmarks for respective regions and countries. In case of supply side validations, revenues of major companies are estimated (in case not available) based on industry benchmark, approximate number of employees, product portfolio, and primary interviews revenues are gathered. Further revenue from target product/service segment is assessed to avoid overshooting of market statistics. In case of heavy deviations between supply and demand side values, all thes steps are repeated to achieve synchronization.
We follow an iterative model, wherein we share our research findings with Subject Matter Experts (SME’s) and Key Opinion Leaders (KOLs) until consensus view of the market is not formulated – this model negates any drastic deviation in the opinions of experts. Only validated and universally acceptable research findings are quoted in our reports.
We have important check points that we use to validate our research findings – which we call – data triangulation, where we validate the information, we generate from secondary sources with primary interviews and then we re-validate with our internal data bases and Subject matter experts. This comprehensive model enables us to deliver high quality, reliable data in shortest possible time.

 このレポートの無料サンプルを入手する