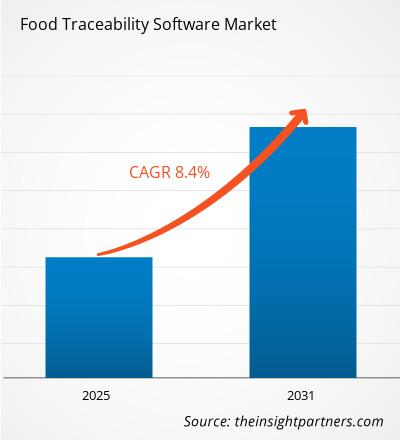
食品トレーサビリティ ソフトウェア市場は、2023 年から 2031 年にかけて 8.4% の CAGR を記録すると予想されています。食品の安全性と品質の維持に関する意識の高まりは、今後も市場の主要なトレンドであり続けると思われます。
食品トレーサビリティソフトウェア市場分析
- 食品トレーサビリティ ソフトウェアは、食品または原料を生産から販売まで追跡するために使用され、その技術は、サプライ チェーンを効率的かつ透明に監視および制御する上で重要な役割を果たします。
- RFID やブロックチェーンなどの IoT テクノロジーの採用はソフトウェアに大きな影響を与え、市場の成長を促進します。
- 政府当局が製造業者向けに制定した厳格な規制基準と標準化された手順が、市場の成長を促進しています。
食品トレーサビリティソフトウェア市場の概要
- 食品トレーサビリティ ソフトウェアは、食品会社がプロセスを合理化し、データを収集、保存、追跡できるようにするのに役立ちます。食品トレーサビリティ ソフトウェアは、食品の安全性を確保し、サプライ チェーンの効率を最適化します。
- 高度なテクノロジーを備えた食品追跡ソフトウェアは、食品内の汚染物質を特定し、消費者への潜在的な健康リスクを最小限に抑えるのに役立ちます。このソフトウェアは、高まる消費者の需要に対応し、業務効率を高め、食品廃棄物を削減するのに役立ちます。
要件に合わせて調査をカスタマイズ
弊社の標準サービスでは対応できない分析と範囲を最適化し、カスタマイズすることができます。この柔軟性により、ビジネス計画と意思決定に必要な正確な情報を得ることができます。
食品トレーサビリティソフトウェア市場:戦略的洞察

CAGR (2023 - 2031)8.4%- 市場規模 2023年
XX億米ドル - 市場規模 2031年
XX億米ドル
市場の動向
- 厳格な規制基準と手順
- 品質管理技術の向上
- 食品の安全性と品質の維持に関する意識の高まり
主要人物
- コーダンスグループ
- 株式会社ウェアフォー
- トラストウェル
- カイ
- ミノタウロスソフトウェア
- ファームソフト
- ソフトトレース株式会社
- e 食品ERP
- アプティアン
- チェトゥ株式会社
地域概要

- 北米
- ヨーロッパ
- アジア太平洋
- 南米と中央アメリカ
- 中東およびアフリカ
市場セグメンテーション
 タイプ
タイプ- エンタープライズ リソース プランニング ソフトウェア
- 研究室情報管理ソフトウェア
- 品質管理ソフトウェア
- 倉庫ソフトウェア
 展開モード
展開モード- クラウドベースとオンプレミス
 応用
応用- 大企業と中小企業
エンドユーザー- 食品メーカー
- 食品小売業者
- 食品流通業者
- 食品サービス提供者
- サンプル PDF では、定性的および定量的な分析により、コンテンツの構造と情報の性質が紹介されています。
食品トレーサビリティソフトウェア市場の推進要因と機会
市場を優遇する厳格な規制基準と手続き
- 食品安全強化法 (FSMA) は、食品の安全性の問題を防止することを目的とした食品トレーサビリティの規制と基準を保証します。
- 米国食品医薬品局 (FDA) は、サプライ チェーンから有害な製品を迅速に特定し、速やかに除去するための食品追跡に関する最終規則を発行しました。これらの規制により、食品追跡の実践が改善されます。
- 追跡ソフトウェアは、重複した数値入力やその他の不要な問題を排除するために、食品会社のエンタープライズ リソース プランニング (ERP) システムと完全に接続する必要があります。
- FDA コンプライアンス: ロット監視ソフトウェアを使用すると、食品会社は任意のバッチの顧客情報を迅速に取得し、ロットリコール通知書を生成できるため、コストのかかるコンプライアンス料金を回避しながら顧客を保護することができます。
- ロット監視により、FIFO(先入先出)およびFEFO(期限切れ先出)追跡が可能になり、食品会社は最も古く期限が近い製品を最初に販売し、倉庫に長期間残ることを防ぐことができます。
品質管理技術の向上
- 消費者は食品の透明性と追跡可能性をさらに高めたいと望んでいるため、新しいテクノロジーが市場の成長を促進しています。
- 技術の進歩とモノのインターネット (IoT)、スマートラベリング、ビッグデータ、人工知能、機械学習、ブロックチェーン技術の発展により、食品会社は品質管理を強化し、食品の適切な監視が可能になります。
- これらのテクノロジーは、食品のトレーサビリティを合理化し、効率を高め、手動プロセスでの失敗を排除し、データを自動的に取得して保存し、運用コストとリスクを削減します。
食品トレーサビリティソフトウェア市場レポートのセグメンテーション分析
食品追跡ソフトウェア市場分析の導出に貢献した主要なセグメントは、タイプ、展開モード、アプリケーション、およびエンドユーザーです。
- 食品トレーサビリティ ソフトウェア市場は、種類別に、エンタープライズ リソース プランニング (ERP) ソフトウェア、ラボ情報管理ソフトウェア、品質管理ソフトウェア、倉庫ソフトウェア、その他に分類されます。エンタープライズ リソース プランニング (ERP) ソフトウェア セグメントは、予測期間中に大幅なペースで拡大すると予想されます。
- 展開モード別に見ると、クラウド セグメントはクラウドベースとオンプレミスに分かれています。2023 年にはクラウドベース セグメントがより大きな市場シェアを占めました。
- 用途別に見ると、食品トレーサビリティソフトウェア市場は大企業と中小企業に分かれており、2023年には大企業セグメントがより大きな市場シェアを占めました。
- エンドユーザーに基づいて、食品追跡ソフトウェア市場は、食品メーカー、食品小売業者、食品流通業者、食品サービスプロバイダーに分類されます。食品メーカーセグメントは、2023年に大きな市場シェアを占めました。
食品トレーサビリティソフトウェアの地域別市場シェア分析
食品追跡ソフトウェア市場レポートの地理的範囲は、主に北米、アジア太平洋、ヨーロッパ、中東およびアフリカ、南米および中米の 5 つの地域に分かれています。
- 北米の市場は、消費者の間で高品質の製品に対する需要が高まっているため、予測期間中に拡大すると予測されています。これにより、市場プレーヤーは、顧客にリアルタイムの食品トレーサビリティのメリットを提供するために、食品トレーサビリティ ソフトウェアを開発またはアップグレードするようになります。
- さらに、大企業による倉庫業務の管理に食品追跡ソフトウェアの導入が増えており、予測期間中に市場にチャンスが生まれています。
食品トレーサビリティソフトウェア市場レポートの範囲
| レポート属性 | 詳細 |
|---|---|
| 2023年の市場規模 | 20億米ドル |
| 2031年までの市場規模 | 20億米ドル |
| 世界のCAGR(2023年~2031年) | 8.4% |
| 履歴データ | 2021-2023 |
| 予測期間 | 2024-2031 |
| 対象セグメント | タイプ別
|
| 対象地域と国 | 北米
|
| 市場リーダーと主要企業プロフィール |
|
- サンプル PDF では、定性的および定量的な分析により、コンテンツの構造と情報の性質が紹介されています。
食品トレーサビリティソフトウェア市場のニュースと最近の動向
食品トレーサビリティ ソフトウェア市場は、重要な企業出版物、協会データ、データベースなどの一次調査と二次調査後の定性的および定量的データを収集することによって評価されます。食品トレーサビリティ ソフトウェア市場におけるいくつかの開発を以下に挙げます。
- Cordance Group は Blue Link Associates Limited (Blue Link) を買収し、さまざまな業界の企業を支援する革新的なソフトウェア ソリューションでポートフォリオを強化するという Cordance の取り組みをさらに強化しました。この買収は、Blue Link を工業、医薬品、食品および飲料の販売業者にとって信頼できるパートナーにしてきた独自の強みと革新的な文化を維持するという Cordance の取り組みを反映しています。(出典: Cordance Group、プレスリリース、2024 年 1 月)
食品トレーサビリティソフトウェア市場レポートの対象範囲と成果物
「食品追跡ソフトウェア市場の規模と予測(2021〜2031年)」レポートでは、以下の分野をカバーする市場の詳細な分析を提供しています。
- 食品トレーサビリティソフトウェアの市場規模と予測(対象範囲に含まれるすべての主要市場セグメントについて、世界、地域、国レベルで)
- 食品トレーサビリティソフトウェア市場の動向、推進要因、制約、主要な機会などの市場動向
- 詳細なPEST/ポーターの5つの力とSWOT分析
- 主要な市場動向、世界および、主要プレーヤー、規制、最近の市場動向を網羅した食品トレーサビリティソフトウェア市場分析
- 食品トレーサビリティソフトウェア市場の市場集中、ヒートマップ分析、主要プレーヤー、最近の動向を網羅した業界の状況と競争分析
- 詳細な企業プロフィール
- 過去2年間の分析、基準年、CAGRによる予測(7年間)
- PEST分析とSWOT分析
- 市場規模価値/数量 - 世界、地域、国
- 業界と競争環境
- Excel データセット

Report Coverage
Revenue forecast, Company Analysis, Industry landscape, Growth factors, and Trends

Segment Covered
This text is related
to segments covered.

Regional Scope
North America, Europe, Asia Pacific, Middle East & Africa, South & Central America

Country Scope
This text is related
to country scope.
よくある質問
North America dominated the food traceability software market in 2023.
Strict regulatory standards and procedures are the major factors that propel the global food traceability software market.
Growing awareness related to maintaining food safety and quality to play a significant role in the global food traceability software market in the coming years.
The key players holding majority shares in the global food traceability software market are Cordance Group, Wherefour, Inc., Trustwell, CAI, Minotaur Software, FarmSoft, SoftTrace Ltd, e Food-ERP, Aptean, and Chetu Inc.
The global food traceability software market is estimated to register a CAGR of 8.4% during the forecast period 2023–2031.
Trends and growth analysis reports related to Technology, Media and Telecommunications : READ MORE..
The List of Companies
1. Blue Link Associates Limited
2. Carlisle Technology
3. FoodLogiQ
4. Famous Software LLC
5. FreshByte Software
6. IBM Corporation
7.LINKFRESH Software Limited
8. METTLER TOLEDO
9. Minotaur Software Ltd.
10. WaudWare Incorporated
The Insight Partners performs research in 4 major stages: Data Collection & Secondary Research, Primary Research, Data Analysis and Data Triangulation & Final Review.
- Data Collection and Secondary Research:
As a market research and consulting firm operating from a decade, we have published and advised several client across the globe. First step for any study will start with an assessment of currently available data and insights from existing reports. Further, historical and current market information is collected from Investor Presentations, Annual Reports, SEC Filings, etc., and other information related to company’s performance and market positioning are gathered from Paid Databases (Factiva, Hoovers, and Reuters) and various other publications available in public domain.
Several associations trade associates, technical forums, institutes, societies and organization are accessed to gain technical as well as market related insights through their publications such as research papers, blogs and press releases related to the studies are referred to get cues about the market. Further, white papers, journals, magazines, and other news articles published in last 3 years are scrutinized and analyzed to understand the current market trends.
- Primary Research:
The primarily interview analysis comprise of data obtained from industry participants interview and answers to survey questions gathered by in-house primary team.
For primary research, interviews are conducted with industry experts/CEOs/Marketing Managers/VPs/Subject Matter Experts from both demand and supply side to get a 360-degree view of the market. The primary team conducts several interviews based on the complexity of the markets to understand the various market trends and dynamics which makes research more credible and precise.
A typical research interview fulfils the following functions:
- Provides first-hand information on the market size, market trends, growth trends, competitive landscape, and outlook
- Validates and strengthens in-house secondary research findings
- Develops the analysis team’s expertise and market understanding
Primary research involves email interactions and telephone interviews for each market, category, segment, and sub-segment across geographies. The participants who typically take part in such a process include, but are not limited to:
- Industry participants: VPs, business development managers, market intelligence managers and national sales managers
- Outside experts: Valuation experts, research analysts and key opinion leaders specializing in the electronics and semiconductor industry.
Below is the breakup of our primary respondents by company, designation, and region:

Once we receive the confirmation from primary research sources or primary respondents, we finalize the base year market estimation and forecast the data as per the macroeconomic and microeconomic factors assessed during data collection.
- Data Analysis:
Once data is validated through both secondary as well as primary respondents, we finalize the market estimations by hypothesis formulation and factor analysis at regional and country level.
- Macro-Economic Factor Analysis:
We analyse macroeconomic indicators such the gross domestic product (GDP), increase in the demand for goods and services across industries, technological advancement, regional economic growth, governmental policies, the influence of COVID-19, PEST analysis, and other aspects. This analysis aids in setting benchmarks for various nations/regions and approximating market splits. Additionally, the general trend of the aforementioned components aid in determining the market's development possibilities.
- Country Level Data:
Various factors that are especially aligned to the country are taken into account to determine the market size for a certain area and country, including the presence of vendors, such as headquarters and offices, the country's GDP, demand patterns, and industry growth. To comprehend the market dynamics for the nation, a number of growth variables, inhibitors, application areas, and current market trends are researched. The aforementioned elements aid in determining the country's overall market's growth potential.
- Company Profile:
The “Table of Contents” is formulated by listing and analyzing more than 25 - 30 companies operating in the market ecosystem across geographies. However, we profile only 10 companies as a standard practice in our syndicate reports. These 10 companies comprise leading, emerging, and regional players. Nonetheless, our analysis is not restricted to the 10 listed companies, we also analyze other companies present in the market to develop a holistic view and understand the prevailing trends. The “Company Profiles” section in the report covers key facts, business description, products & services, financial information, SWOT analysis, and key developments. The financial information presented is extracted from the annual reports and official documents of the publicly listed companies. Upon collecting the information for the sections of respective companies, we verify them via various primary sources and then compile the data in respective company profiles. The company level information helps us in deriving the base number as well as in forecasting the market size.
- Developing Base Number:
Aggregation of sales statistics (2020-2022) and macro-economic factor, and other secondary and primary research insights are utilized to arrive at base number and related market shares for 2022. The data gaps are identified in this step and relevant market data is analyzed, collected from paid primary interviews or databases. On finalizing the base year market size, forecasts are developed on the basis of macro-economic, industry and market growth factors and company level analysis.
- Data Triangulation and Final Review:
The market findings and base year market size calculations are validated from supply as well as demand side. Demand side validations are based on macro-economic factor analysis and benchmarks for respective regions and countries. In case of supply side validations, revenues of major companies are estimated (in case not available) based on industry benchmark, approximate number of employees, product portfolio, and primary interviews revenues are gathered. Further revenue from target product/service segment is assessed to avoid overshooting of market statistics. In case of heavy deviations between supply and demand side values, all thes steps are repeated to achieve synchronization.
We follow an iterative model, wherein we share our research findings with Subject Matter Experts (SME’s) and Key Opinion Leaders (KOLs) until consensus view of the market is not formulated – this model negates any drastic deviation in the opinions of experts. Only validated and universally acceptable research findings are quoted in our reports.
We have important check points that we use to validate our research findings – which we call – data triangulation, where we validate the information, we generate from secondary sources with primary interviews and then we re-validate with our internal data bases and Subject matter experts. This comprehensive model enables us to deliver high quality, reliable data in shortest possible time.
 このレポートの無料サンプルを入手する