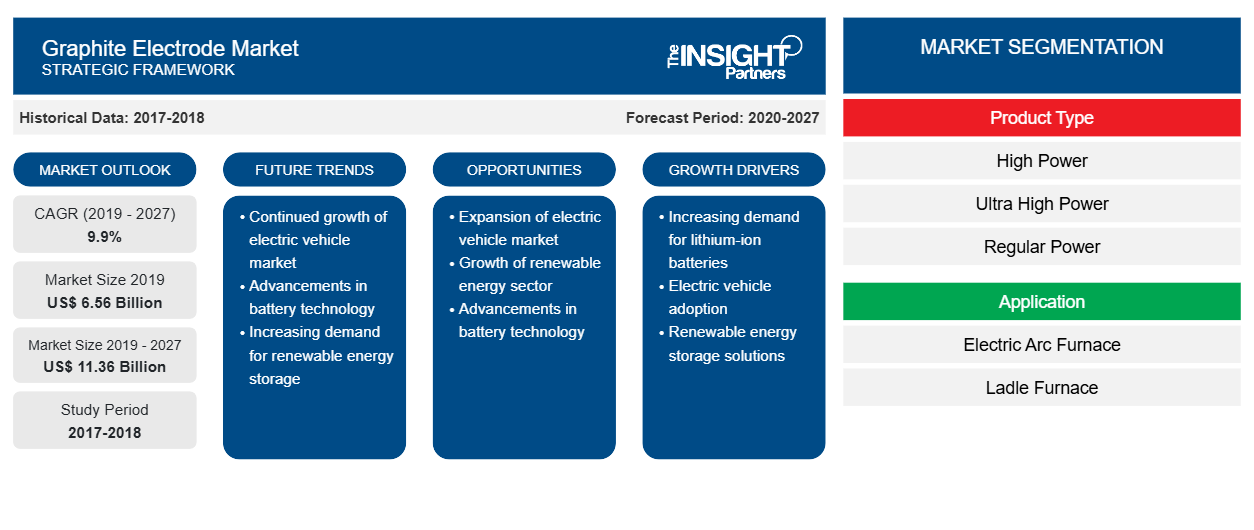
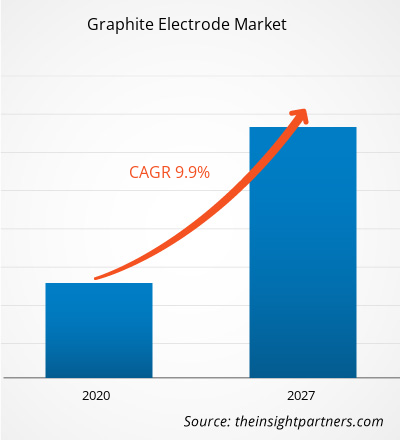
[調査レポート] 収益面では、グラファイト電極市場は2019年に65億6,420万米ドルと評価され、2020年から2027年にかけて9.9%のCAGRで成長し、2027年には113億5,640万米ドルに達すると予想されています。
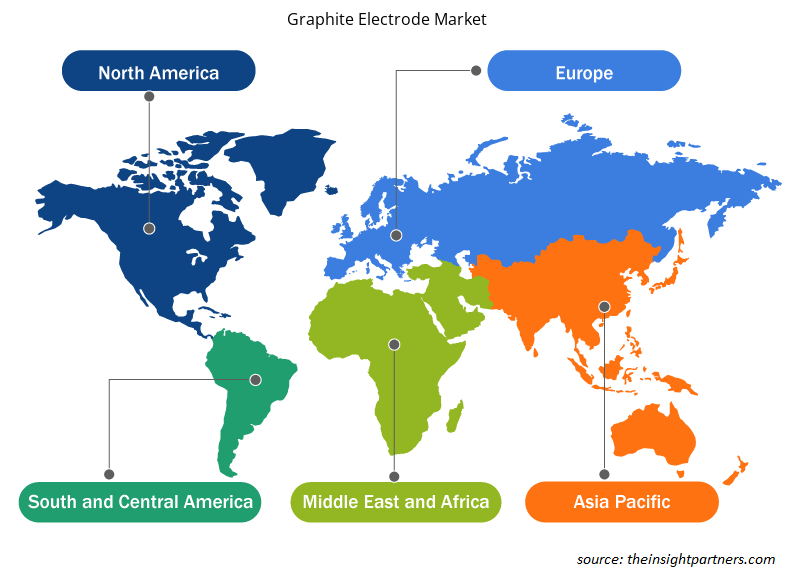
世界のグラファイト電極市場はアジア太平洋地域が独占しており、全体で世界のグラファイト電極市場の約58%を占めています。これらの国々のグラファイト電極の需要が高いのは、粗鋼生産の急増によるものです。世界鉄鋼協会によると、2018年に中国と日本はそれぞれ9億2,830万トンと1億430万トンの粗鋼を生産しました。アジア太平洋地域では、鉄スクラップの増加と中国の電力供給の増加により、電気アーク炉の需要が大きくなっています。アジア太平洋地域のさまざまな企業による成長市場戦略が、この地域のグラファイト電極市場の成長を促しています。たとえば、日本企業の東海カーボン株式会社は、SGL GE Holding GmbH(SGL GE)のグラファイト電極事業を1億5,000万米ドルで買収しました。
ヨーロッパの主要国の政府は、製造業やエレクトロニクス・半導体部門などの発展に向けてさまざまな取り組みを行っています。ヨーロッパは、インダストリー4.0の取り組みを通じて産業ソリューションを大幅にアップグレードしました。欧州委員会は、この地域の製造業やその他の部門の競争力を世界的に強化するために、研究開発への資金提供を増やすことに重点を置いています。グラファイト電極の需要は、電気アーク炉での鉄鋼生産に直接結びついており、この地域は世界でも重要な鉄鋼生産地の1つであり、ロシアが最大の生産国です。
要件に合わせてレポートをカスタマイズする
このレポートの一部、国レベルの分析、Excelデータパックなど、あらゆるレポートを無料でカスタマイズできます。また、スタートアップや大学向けのお得なオファーや割引もご利用いただけます。
- このレポートの主要な市場動向を入手してください。この無料サンプルには、市場動向から見積もりや予測に至るまでのデータ分析が含まれます。
COVID-19パンデミックによるグラファイト電極市場への影響
世界保健機関(WHO)の最新の状況報告によると、米国、インド、スペイン、イタリア、フランス、ドイツ、英国、ロシア、トルコ、ブラジル、イラン、中国は、COVID-19の発生により最も深刻な影響を受けている国です。この発生は、2019年12月に武漢(中国)で最初に始まり、それ以来、世界中に急速に広がっています。COVID-19危機は世界中の産業に影響を及ぼしており、世界経済は2020年に最悪の打撃を受けると予想されており、おそらく2021年に打撃を受けるでしょう。この発生は、鉄鋼業界に大きな混乱を引き起こしています。国際貿易の急激な減少は、グラファイト電極の成長に悪影響を及ぼしています。生産停止、サプライチェーンの制限、調達管理、労働力不足、発生の防止と封じ込めのための国境封鎖は、建設部門に悪影響を及ぼしています。建設業界の生産減速は、さまざまな鉄鋼製品の採用に直接影響を及ぼし、グラファイト電極市場に影響を与えています。
市場分析
中国鉄鋼業界の転換がグラファイト電極市場の成長を支えている
2016年と2017年、中国の鉄鋼業界は、政府が国内供給過剰の是正に努めたため、政策的にIFの可能性を否定する方向に進みました。worldsteel.orgによると、EAFとBOF製鉄所でのスクラップ鋼の消費量は、年間2億トンを超える記録に達しました。一方、中国のEAF生産能力は、政府の規制により主要地域の統合工場による生産が制限され、EAF生産能力による積極的な置き換えが促進されたため、年間1億3000万トンという新たな頂点に達しました。これによりEAF鋼の生産が増加し、グラファイト電極市場の成長を後押ししました。
製品タイプに基づく洞察
製品タイプ別では、超高出力セグメントが2019年に世界のグラファイト電極市場で最大のシェアを獲得しました。超高出力グラファイト電極は、電気アーク炉(EAF)業界で鉄鋼のリサイクルに利用されています。その主成分は、石油またはコールタールから生成される高価値のニードルコークスです。グラファイト電極は円筒形に仕上げられ、両端にねじ山が設けられています。このようにして、グラファイト電極は電極ニップルを使用して電極柱に組み立てることができます。低コストと作業効率の向上という要件を満たすため、大容量の超高出力アーク炉が普及しつつあります。そのため、超高出力グラファイト電極がグラファイト電極市場の大部分を占めると予想されています。また、このセグメントはグラファイト電極市場で最も高いCAGR成長が見込まれています。
アプリケーションベースの洞察
用途に基づいて、グラファイト電極市場は、電気アーク炉、取鍋炉、その他に分類されます。電気アーク炉セグメントは、予測期間中に最高のCAGRで成長すると予測されています。グラファイト電極は、電気アーク炉(EAF)法と取鍋炉鋼精製による鉄鋼生産に不可欠なコンポーネントです。グラファイト電極は、非鉄金属、フェロアロイ、シリコン金属、黄リンの生産にも使用されます。グラファイト電極は、EAF鋼生産に不可欠な消耗品ですが、必要な量はごくわずかです。1トンの鋼生産に必要なグラファイト電極は約1.7kgです。このセグメントは、グラファイト電極市場全体の80%以上のシェアを占めています。
グラファイト電極市場は高度に統合されており、限られた数の企業のみが市場を独占しています。グラファイト電極市場における最近の動向のいくつかを以下に示します。
2020年:東海カーボンと東海COBEXが炭素・黒鉛メーカーCarbone Savoie International SASの買収を完了。
2020年:GrafTech International Ltd.の取締役会が、公開市場での同社普通株式の最大1億ドルの買い戻しを承認。
2019年:昭和電工(SDK)が黒鉛電極製造会社SGL GE Holding GmbHの全株式の取得を完了。買収後、社名がSHOWA DENKO CARBON Holding GmbHに変更。
グラファイト電極市場の地域別分析
予測期間を通じてグラファイト電極市場に影響を与える地域的な傾向と要因は、Insight Partners のアナリストによって徹底的に説明されています。このセクションでは、北米、ヨーロッパ、アジア太平洋、中東、アフリカ、南米、中米にわたるグラファイト電極市場のセグメントと地理についても説明します。

- グラファイト電極市場の地域別データを入手
グラファイト電極市場レポートの範囲
| レポート属性 | 詳細 |
|---|---|
| 2019年の市場規模 | 65億6千万米ドル |
| 2027年までの市場規模 | 113.6億米ドル |
| 世界のCAGR(2019年 - 2027年) | 9.9% |
| 履歴データ | 2017-2018 |
| 予測期間 | 2020-2027 |
| 対象セグメント | 製品タイプ別
|
| 対象地域と国 | 北米
|
| 市場リーダーと主要企業プロフィール |
|
グラファイト電極市場のプレーヤー密度:ビジネスダイナミクスへの影響を理解する
グラファイト電極市場は、消費者の嗜好の変化、技術の進歩、製品の利点に対する認識の高まりなどの要因により、エンドユーザーの需要が高まり、急速に成長しています。需要が高まるにつれて、企業は提供を拡大し、消費者のニーズを満たすために革新し、新たなトレンドを活用し、市場の成長をさらに促進しています。
市場プレーヤー密度とは、特定の市場または業界内で活動している企業または会社の分布を指します。これは、特定の市場スペースに、その規模または総市場価値と比較して、どれだけの競合相手 (市場プレーヤー) が存在するかを示します。
グラファイト電極市場で事業を展開している主要企業は次のとおりです。
- EPMグループ
- グラフテックインターナショナル株式会社
- グラファイト・インディア・リミテッド
- HEGリミテッド
- 開封カーボン株式会社
免責事項:上記の企業は、特定の順序でランク付けされていません。

- グラファイト電極市場のトップキープレーヤーの概要を入手
市場セグメンテーション
グラファイト電極市場 – 製品タイプ別
- ハイパワー
- 超高出力
- レギュラーパワー
グラファイト電極市場 – 用途別
- 電気アーク炉
- 取鍋炉
- その他
地域別グラファイト電極市場
北米
- 私たち
- カナダ
- メキシコ
ヨーロッパ
- フランス
- ドイツ
- イタリア
- 英国
- ロシア
- その他のヨーロッパ
アジア太平洋(APAC)
- 中国
- インド
- 韓国
- 日本
- オーストラリア
- その他のアジア太平洋地域
中東およびアフリカ(MEA)
- 南アフリカ
- サウジアラビア
- アラブ首長国連邦
- MEAの残り
南アメリカ(SAM)
- ブラジル
- アルゼンチン
- 残りのSAM
グラファイト電極市場で紹介されている企業は次のとおりです。
- EPMグループ
- グラフテックインターナショナル株式会社
- グラファイト・インディア・リミテッド
- HEG株式会社
- 開封炭素有限公司、中平エネルギー化学グループ(KFCC)
- 南通揚子炭素有限公司
- 日本カーボン株式会社
- サングラフインターナショナル
- 昭和電工株式会社
- 東海カーボン株式会社
- 過去2年間の分析、基準年、CAGRによる予測(7年間)
- PEST分析とSWOT分析
- 市場規模価値/数量 - 世界、地域、国
- 業界と競争環境
- Excel データセット


Report Coverage
Revenue forecast, Company Analysis, Industry landscape, Growth factors, and Trends

Segment Covered
This text is related
to segments covered.

Regional Scope
North America, Europe, Asia Pacific, Middle East & Africa, South & Central America

Country Scope
This text is related
to country scope.
よくある質問
Ultra-high power graphite electrode is utilized for recycling steel in the electric arc furnace (EAF) industry. Its main constituent is high-value needle coke, which is produced from either petroleum or coal tar. Graphite electrodes are perfected with a cylinder shape and manufactured with threaded areas at each end. In this way, the graphite electrodes can be assembled into an electrode column using electrode nipples. To suffice the requirement of lower total cost and higher work efficiency and, large capacity ultra-high power arc furnaces are growing and becoming more popular. Thus ultra-high power graphite electrodes are expected to hold the lion's market share.
China’s steel industry is on the transition of a new era. Over the next decade, steel will frequently be made by recycling domestic scrap in electric arc furnace mini-mills as the government interests with the policy-driven exclusion of conventional induction furnaces (IF)/blast furnaces (BF) and the replacement of combined steel capacity. This monument change, which incorporates environmental and economic benefits, will transmute the industry and demand major modifications in the steelmaking business model at the company level. To favorably adapt to this new ecosystem, steel companies and other industry stakeholders should concede the context and motivating factors behind the transition.
Presently, APAC holds the largest share of the global Graphite Electrode. The graphite electrode market players in APAC are experiencing significant demand for their products from various industries. China and Japan are the leading countries in the APAC graphite electrode market. The high demand from these countries is attributed to the steep rise in crude steel production. As per the World Steel Association, in 2018, China and Japan produced 928.3 and 104.3 million tonnes of crude steel respectively. In APAC, electric arc furnaces have a promising growth due to the rising steel scrap and increase in electrical energy supply in China. Many countries in APAC are economically developing, and they are focusing majorly on the rising environmental issue. For instance, in China, the heavily polluting basic oxygen furnaces (BOF) have been forced to shut down due to strict environmental regulations. Thus, the induction furnaces were replaced by electric arc furnaces, which utilize graphite electrodes to melt steel scrap. In 2017, China reported the consumption of ~353,600 metric ton of graphite electrodes, with an increase of 3.06% on the consumption in 2016.
Trends and growth analysis reports related to Chemicals and Materials : READ MORE..
The List of Companies - Graphite Electrode Market
- EPM Group
- GRAFTECH INTERNATIONAL LTD
- Graphite India Limited
- HEG Limited
- Kaifeng Carbon Co., Ltd
- Nantong Yangzi Carbon Co., Ltd
- Nippon Carbon Co Ltd.
- SANGRAF Intl.
- SHOWA DENKO K.K.
- Tokai Carbon Co., Ltd.
The Insight Partners performs research in 4 major stages: Data Collection & Secondary Research, Primary Research, Data Analysis and Data Triangulation & Final Review.
- Data Collection and Secondary Research:
As a market research and consulting firm operating from a decade, we have published and advised several client across the globe. First step for any study will start with an assessment of currently available data and insights from existing reports. Further, historical and current market information is collected from Investor Presentations, Annual Reports, SEC Filings, etc., and other information related to company’s performance and market positioning are gathered from Paid Databases (Factiva, Hoovers, and Reuters) and various other publications available in public domain.
Several associations trade associates, technical forums, institutes, societies and organization are accessed to gain technical as well as market related insights through their publications such as research papers, blogs and press releases related to the studies are referred to get cues about the market. Further, white papers, journals, magazines, and other news articles published in last 3 years are scrutinized and analyzed to understand the current market trends.
- Primary Research:
The primarily interview analysis comprise of data obtained from industry participants interview and answers to survey questions gathered by in-house primary team.
For primary research, interviews are conducted with industry experts/CEOs/Marketing Managers/VPs/Subject Matter Experts from both demand and supply side to get a 360-degree view of the market. The primary team conducts several interviews based on the complexity of the markets to understand the various market trends and dynamics which makes research more credible and precise.
A typical research interview fulfils the following functions:
- Provides first-hand information on the market size, market trends, growth trends, competitive landscape, and outlook
- Validates and strengthens in-house secondary research findings
- Develops the analysis team’s expertise and market understanding
Primary research involves email interactions and telephone interviews for each market, category, segment, and sub-segment across geographies. The participants who typically take part in such a process include, but are not limited to:
- Industry participants: VPs, business development managers, market intelligence managers and national sales managers
- Outside experts: Valuation experts, research analysts and key opinion leaders specializing in the electronics and semiconductor industry.
Below is the breakup of our primary respondents by company, designation, and region:

Once we receive the confirmation from primary research sources or primary respondents, we finalize the base year market estimation and forecast the data as per the macroeconomic and microeconomic factors assessed during data collection.
- Data Analysis:
Once data is validated through both secondary as well as primary respondents, we finalize the market estimations by hypothesis formulation and factor analysis at regional and country level.
- Macro-Economic Factor Analysis:
We analyse macroeconomic indicators such the gross domestic product (GDP), increase in the demand for goods and services across industries, technological advancement, regional economic growth, governmental policies, the influence of COVID-19, PEST analysis, and other aspects. This analysis aids in setting benchmarks for various nations/regions and approximating market splits. Additionally, the general trend of the aforementioned components aid in determining the market's development possibilities.
- Country Level Data:
Various factors that are especially aligned to the country are taken into account to determine the market size for a certain area and country, including the presence of vendors, such as headquarters and offices, the country's GDP, demand patterns, and industry growth. To comprehend the market dynamics for the nation, a number of growth variables, inhibitors, application areas, and current market trends are researched. The aforementioned elements aid in determining the country's overall market's growth potential.
- Company Profile:
The “Table of Contents” is formulated by listing and analyzing more than 25 - 30 companies operating in the market ecosystem across geographies. However, we profile only 10 companies as a standard practice in our syndicate reports. These 10 companies comprise leading, emerging, and regional players. Nonetheless, our analysis is not restricted to the 10 listed companies, we also analyze other companies present in the market to develop a holistic view and understand the prevailing trends. The “Company Profiles” section in the report covers key facts, business description, products & services, financial information, SWOT analysis, and key developments. The financial information presented is extracted from the annual reports and official documents of the publicly listed companies. Upon collecting the information for the sections of respective companies, we verify them via various primary sources and then compile the data in respective company profiles. The company level information helps us in deriving the base number as well as in forecasting the market size.
- Developing Base Number:
Aggregation of sales statistics (2020-2022) and macro-economic factor, and other secondary and primary research insights are utilized to arrive at base number and related market shares for 2022. The data gaps are identified in this step and relevant market data is analyzed, collected from paid primary interviews or databases. On finalizing the base year market size, forecasts are developed on the basis of macro-economic, industry and market growth factors and company level analysis.
- Data Triangulation and Final Review:
The market findings and base year market size calculations are validated from supply as well as demand side. Demand side validations are based on macro-economic factor analysis and benchmarks for respective regions and countries. In case of supply side validations, revenues of major companies are estimated (in case not available) based on industry benchmark, approximate number of employees, product portfolio, and primary interviews revenues are gathered. Further revenue from target product/service segment is assessed to avoid overshooting of market statistics. In case of heavy deviations between supply and demand side values, all thes steps are repeated to achieve synchronization.
We follow an iterative model, wherein we share our research findings with Subject Matter Experts (SME’s) and Key Opinion Leaders (KOLs) until consensus view of the market is not formulated – this model negates any drastic deviation in the opinions of experts. Only validated and universally acceptable research findings are quoted in our reports.
We have important check points that we use to validate our research findings – which we call – data triangulation, where we validate the information, we generate from secondary sources with primary interviews and then we re-validate with our internal data bases and Subject matter experts. This comprehensive model enables us to deliver high quality, reliable data in shortest possible time.


 このレポートの無料サンプルを入手する