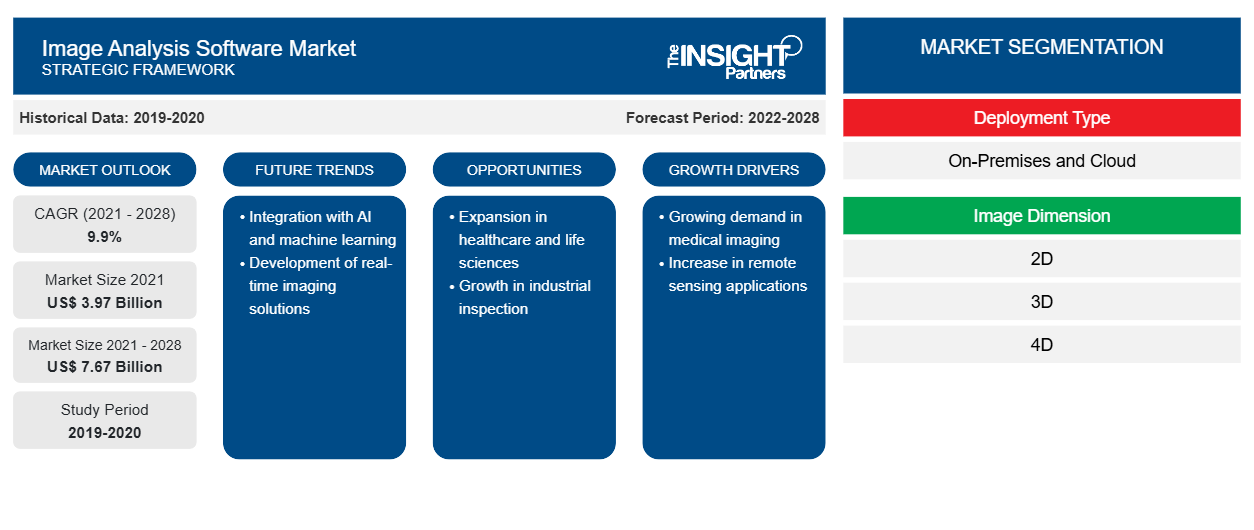
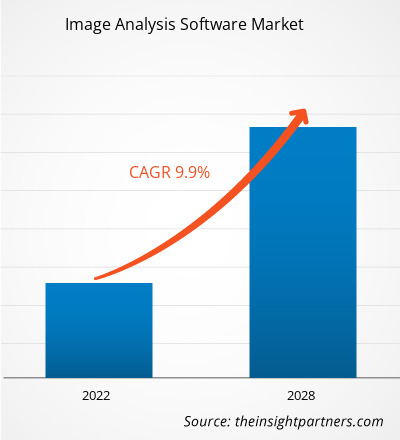
[調査レポート] 画像解析ソフトウェア市場は、2021年の39億7,093万米ドルから2028年には76億7,216万米ドルに成長すると予想されており、2021年から2028年にかけて9.9%のCAGRで成長すると予測されています。
画像分析ソフトウェア市場は、画像分析市場とも呼ばれ、デジタル画像処理技術を使用して、主にデジタル画像である写真から貴重なデータを抽出するのに役立っています。画像分析タスクは、バーコードタグのスキャンのような単純なものから、人物の顔認識のような複雑なものまで多岐にわたります。膨大な量のデータ、複雑なコンピューティングを必要とするジョブ、定量的データの抽出を処理するには、コンピューターが必要です。コンピューターまたは電気機器が写真を分析して使用可能な情報を抽出することは、デジタル画像分析またはコンピューター画像分析と呼ばれます。パターン認識、デジタルジオメトリ、信号処理をコンピューターまたはマシンビジョンと医療用画像処理の領域に組み込んでいます。
人工知能 (AI) と機械学習 (ML) を搭載した画像分析ソフトウェアアプリケーションは、自動車業界を再定義します。現在、自動車製造業界では、設計、サプライチェーン、生産、ポストプロダクションで使用されています。さらに、AI と機械学習は「運転支援」や「ドライバーリスク評価」システムで使用されており、輸送業界に革命をもたらしています。人工知能は、予知保全や保険など、さまざまなアフターマーケットサービスにも変化をもたらしています。自動車業界では、機械学習によって新しいインテリジェント製品の開発や作業方法の改善が実現しました。
形状の検出、エッジの認識、ノイズの低減、オブジェクトのカウント、テクスチャ分析や画質の統計の生成はすべて、画像分析タスクの例です。これは、2 次元 (2D) または 3 次元 (3D) のデジタル画像の定量的または定性的な特性評価であり、コンピューター ビジョンは 2D 画像を分析し、医療用画像処理は 3D 画像を分析します。画像分析ソフトウェアは、顕微鏡画像分析や科学画像の研究に広く使用されています。画像分析ソフトウェア市場の成長は、主にヘルスケアおよびライフ サイエンス業界でのソフトウェアの広範な採用によって推進されています。
要件に合わせてレポートをカスタマイズする
このレポートの一部、国レベルの分析、Excelデータパックなど、あらゆるレポートを無料でカスタマイズできます。また、スタートアップや大学向けのお得なオファーや割引もご利用いただけます。
- このレポートの主要な市場動向を入手してください。この無料サンプルには、市場動向から見積もりや予測に至るまでのデータ分析が含まれます。
COVID-19パンデミックによる画像解析ソフトウェア市場への影響
COVID-19パンデミックは、画像解析ソフトウェア市場に利益をもたらしました。企業は、COVID-19パンデミックとリモートワーク環境の発展により、新たな課題に直面しています。COVID-19の発生により、さまざまな業界の企業がデジタルテクノロジーを採用し、画像解析ソフトウェア市場のソリューションとサービスの可能性を活用して運用とコストを最適化する必要性が浮き彫りになりました。これにより、ITツールのROIがさらに高まります。さらに、2020年のパンデミックの到来により、世界の画像解析ソフトウェア市場の運営に多くの課題が生じました。先進国の医療インフラは、COVID-19の症例の増加により崩壊しています。したがって、公衆衛生の緊急事態には、政府と市場プレーヤーが介入し、予測期間中に損失を回復するために実施される研究開発イニシアチブの共同作業を通じて、画像解析ソフトウェア市場の運営と収益の復活を支援する必要があります。さらに、投資の増加は、今後数年間の画像解析ソフトウェア市場にとって良い前兆です。
画像解析ソフトウェア市場の洞察
画像解析対応のセキュリティアプリケーションと製品に対する需要の高まり
企業は、非構造化データからリソースを引き出す可能性に気づき始めています。写真や動画を使用して、小売、エンターテイメント、保険金請求などの業界でユニークで魅力的な消費者体験を生み出すことができます。画像分析は、増加する企業ユースケースをサポートするために使用されます。ディープラーニングと画像分析のこれらの実用的なアプリケーションは、機械学習アルゴリズムの進歩、データセットの可用性、リアルタイム処理を可能にするプラットフォームを備えた堅牢なテクノロジの存在によって実現されています。米国の多くの空港では、指紋や虹彩のスキャンなどの生体認証をセキュリティ スクリーニングの代替手法として利用できるように機器をアップグレードしています。企業は、到着ゲートからセキュリティ チェックを通過して出発ゲートまで乗客を移動させる画像分析テクノロジを導入することで、容量が大幅に増加すると予想しています。
画像解析ソフトウェア市場 - 導入タイプセグメントの洞察
導入に基づいて、画像分析ソフトウェア市場はオンプレミスとクラウドに分かれています。オンプレミス ソフトウェアは、サーバー ファームやクラウドなどのリモート施設ではなく、ユーザーまたは組織の敷地内のコンピューターにインストールされ、運用されます。オンプレミス ソフトウェアは柔軟性、安定性、セキュリティに優れているため、現在、複数の市場プレーヤーがオンプレミス ソフトウェアを販売しています。たとえば、オンプレミス Imagga のビジュアル AI ソリューションは、企業のプライベート ローカル サーバーに完全に導入できます。データに敏感な組織は、Imagga の受賞歴のあるビジュアル AI テクノロジを使用して、自動タグ付け、自動分類、色抽出、カスタム トレーニング、顔認識を実行しながら、プライバシー法や規制に完全に準拠できます。
画像解析ソフトウェア市場 - 画像ディメンションセグメントの洞察
画像分析ソフトウェア市場は、画像の寸法に基づいて、2D、3D、4D に分類されます。2D 画像は、x 軸と y 軸を使用して作成されます。従来、2D 画像はアニメーションやビデオのソースとして使用されてきました。これは長い歴史を持つ古い技術ですが、理由があって今でも定番となっています。これらの画像はシンプルで視覚的に魅力的であり、顧客を圧倒したり邪魔したりすることなく簡単に使用できます。2D 画像は、画面上で動きのリアルでありながらフラットな視点を提供するため、アニメーションやビデオ ゲームでよく使用されます。そのため、業界のいくつかの企業が現在、2D 写真を分析するソフトウェアを提供しています。たとえば、Media Cybernetics, Inc. の Image-Pro Plus 2D 画像分析ソフトウェアは、写真の収集、アイテムのカウント、測定、分類を簡単に行い、作業を自動化するのに役立ちます。顕微鏡の制御、画像キャプチャ、測定、カウント/サイズ、マクロ開発機能はすべて、このソフトウェア パッケージに含まれています。
画像解析ソフトウェア市場 - 業界垂直セグメントの洞察
業界別では、画像分析ソフトウェア市場は、ヘルスケアとライフサイエンス、製造、学術、鉱物、金属、石油、その他に分類されています。医療業界では、画像分析ソフトウェアは、神経学、心臓病学、整形外科、歯科、腫瘍学などのさまざまな分野で役立ちます。このソフトウェアは、X線、MRI、CTスキャン、PETスキャン、超音波で作成された画像を読み取ることができます。その結果、プロセスを自動化および加速して、手作業を回避し、時間を節約できます。ソフトウェアはこれらの写真の特定の特徴を認識することを学習し、診断手順を迅速かつ正確にすることができます。医療用画像処理ソフトウェアには多くの機能があります。AIベースのソリューションは、不規則性や潜在的に危険な異常を検出し、患者が癌を患っているのか良性腫瘍を患っているのかを示します。このソフトウェアは、通常の2D画像(時間の変化を表示する画像)に加えて、3Dおよびいわゆる4D写真を読み取ることができます。
画像解析ソフトウェア市場
画像解析ソフトウェア市場のプレーヤーは、競争するために高度なテクノロジーと機能を統合することにより、新製品の革新と開発に重点を置いています。 2021年10月、Clemex Visionには、マルテンサイト、フェライト、オーステナイトの粒子に関する独自の指示とML機能が追加されました。 これらの新しい自動方法は、既存のソフトウェアのツールボックスに追加され、困難な微細構造を視覚的に識別する迅速かつ正確な手法を提供します。
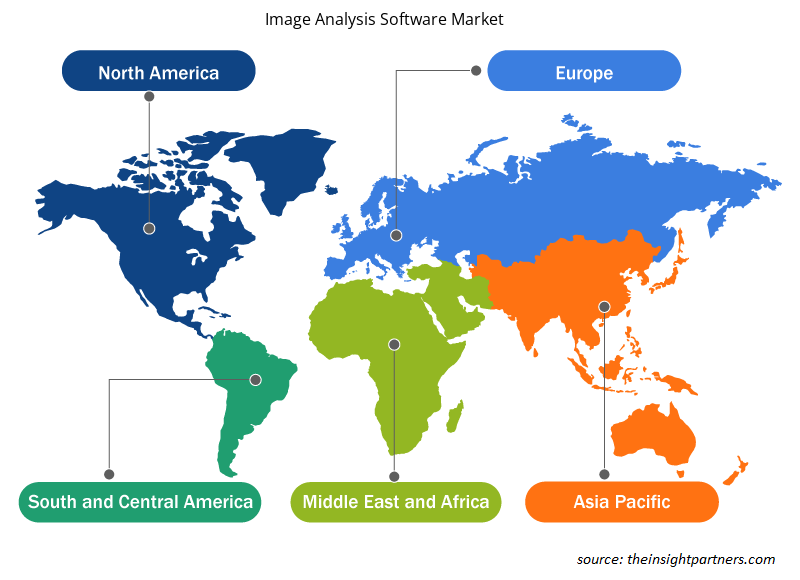
展開タイプに基づいて、画像分析ソフトウェア市場はオンプレミスとクラウドに分かれています。画像次元に基づいて、画像分析ソフトウェア市場は2D、3D、4Dに分割されています。業界別では、画像分析ソフトウェア市場はヘルスケアとライフサイエンス、製造、学術、鉱物、金属、石油、その他に分類されています。地域に基づいて、世界の画像分析ソフトウェア市場は、北米、ヨーロッパ、アジア太平洋、中東およびアフリカ、南米に分類されています。
画像解析ソフトウェア市場の地域別分析
予測期間を通じて画像解析ソフトウェア市場に影響を与える地域的な傾向と要因は、Insight Partners のアナリストによって徹底的に説明されています。このセクションでは、北米、ヨーロッパ、アジア太平洋、中東およびアフリカ、南米および中米にわたる画像解析ソフトウェア市場のセグメントと地理についても説明します。

- 画像解析ソフトウェア市場の地域別データを入手
画像解析ソフトウェア市場レポートの範囲
| レポート属性 | 詳細 |
|---|---|
| 2021年の市場規模 | 39億7千万米ドル |
| 2028年までの市場規模 | 76億7千万米ドル |
| 世界のCAGR(2021年~2028年) | 9.9% |
| 履歴データ | 2019-2020 |
| 予測期間 | 2022-2028 |
| 対象セグメント | 展開タイプ別
|
| 対象地域と国 | 北米
|
| 市場リーダーと主要企業プロフィール |
|
画像解析ソフトウェア市場のプレーヤー密度:ビジネスダイナミクスへの影響を理解する
画像分析ソフトウェア市場は、消費者の嗜好の変化、技術の進歩、製品の利点に対する認識の高まりなどの要因により、エンドユーザーの需要が高まり、急速に成長しています。需要が高まるにつれて、企業は提供を拡大し、消費者のニーズを満たすために革新し、新たなトレンドを活用し、市場の成長をさらに促進しています。
市場プレーヤー密度とは、特定の市場または業界内で活動している企業または会社の分布を指します。これは、特定の市場スペースに、その規模または総市場価値と比較して、どれだけの競合相手 (市場プレーヤー) が存在するかを示します。
画像解析ソフトウェア市場で事業を展開している主要企業は次のとおりです。
- アディシスSA
- バイオ・ラッド ラボラトリーズ株式会社
- オックスフォード・インストゥルメンツ
- クレメックステクノロジーズ株式会社
- メディアサイバネティクス株式会社
免責事項:上記の企業は、特定の順序でランク付けされていません。

- 画像解析ソフトウェア市場のトップキープレーヤーの概要を入手
画像解析ソフトウェア市場 – 企業プロファイル
- アディシスSA
- バイオ・ラッド ラボラトリーズ株式会社
- オックスフォード・インストゥルメンツ
- クレメックステクノロジーズ株式会社
- メディアサイバネティクス株式会社
- MIPARソフトウェアLLC
- オリンパス株式会社
- パックスイット
- パーキンエルマー株式会社
- ティッシュグノースティックス株式会社
- ライカマイクロシステムズ株式会社
- MVTec ソフトウェア GmbH
- カールツァイスAG
- スケールAI株式会社
- ラベルボックス株式会社
- V7株式会社
- 過去2年間の分析、基準年、CAGRによる予測(7年間)
- PEST分析とSWOT分析
- 市場規模価値/数量 - 世界、地域、国
- 業界と競争環境
- Excel データセット


- Small Internal Combustion Engine Market
- Occupational Health Market
- Aesthetic Medical Devices Market
- Grant Management Software Market
- Digital Language Learning Market
- Joint Pain Injection Market
- Long Read Sequencing Market
- Point of Care Diagnostics Market
- Neurovascular Devices Market
- Nitrogenous Fertilizer Market

Report Coverage
Revenue forecast, Company Analysis, Industry landscape, Growth factors, and Trends

Segment Covered
This text is related
to segments covered.

Regional Scope
North America, Europe, Asia Pacific, Middle East & Africa, South & Central America

Country Scope
This text is related
to country scope.
よくある質問
North America held the largest market share in year 2020, along with the notable revenue generation opportunities in Europe and APAC.
Key companies in the image analysis software market include ADCIS SA; Bio-Rad Laboratories, Inc.; Oxford Instruments; Clemex Technologies, Inc.; Media Cybernetics, Inc.; MIPAR Software LLC; Olympus Corporation; Pax-it; PerkinElmer, Inc.; TissueGnostics GmbH; Leica Microsystems GmbH; MVTec Software GmbH; Carl Zeiss AG; Scale AI, Inc.; Labelbox, Inc; and V7 Ltd.
The Image analysis software market is segmented into on-premises and cloud based on the deployment type. The global image analysis software market is dominated by on-premise segment in 2020, which accounted for more than ~ 60%.
Visual AI allows new and experienced users to effortlessly construct and deploy more accurate and explicable machine learning models with photos through community hardware. Computer vision will enable users to manipulate pictures as they would any other type of data. Enterprise AI systems automate the preparation, selection, and training of a wide range of cutting-edge deep learning models so that the optimal deployment model may be recommended. As social separation becomes the new normal, it's more important than ever to watch and monitor people's gatherings and movements. Standard Operating Procedures (SOPs) must be implemented and tracked in real-time by businesses. Employees can maintain safe, specified distances from one another throughout shifts while following conventional practices thanks to computer algorithms that evaluate data from on-site video cameras. Retailers may utilize AI and machine learning tools to keep track of the distances between their warehouse employees. When a divergence from typical behavior is detected, these tools issue real-time alerts., which in turn is likely to gain momentum for the image analysis software market over the forecasted period.
AI is becoming the next frontier in digital transformation, and when integrated into processes, it can deliver value and impact across all facets of a company. AWS, Microsoft, and Google are all aggressively investing in improving their image analysis software solutions to improve in-store and online retail performance. Due to the emergence of COVID-19, demand for cloud-based services has increased even more. Intelligence Retail, a supplier of computer vision and AI for merchandising solutions, uses IBM's cloud and analysis solution, which includes cutting-edge Graphics Processing Units (GPUs), to help businesses increase sales, lower audit costs, improve performance, and increase customer loyalty. For example, Trax and Google Cloud teamed in 2019 to use Google's cloud and edge computing technologies, as well as Trax's image recognition and machine learning capabilities, to successfully manage in-store inventory and every SKU on the shelf with actionable real-time insights. These strategies would promote the future growth of the image analysis market in the forecasted period.
Growing demand for image analysis-enabled security applications and products
Increasing demand for image analysis in the automotive industry
Trends and growth analysis reports related to Technology, Media and Telecommunications : READ MORE..
The List of Companies - Image Analysis Software Market
- ADCIS SA
- Bio-Rad Laboratories, Inc.
- Oxford Instruments
- Clemex Technologies, Inc.
- Media Cybernetics, Inc.
- MIPAR Software LLC
- Olympus Corporation
- Pax-it
- PerkinElmer, Inc.
- TissueGnostics GmbH
- Leica Microsystems GmbH
- MVTec Software GmbH
- Carl Zeiss AG
- Scale AI, Inc.
- Labelbox, Inc
- V7 Ltd
The Insight Partners performs research in 4 major stages: Data Collection & Secondary Research, Primary Research, Data Analysis and Data Triangulation & Final Review.
- Data Collection and Secondary Research:
As a market research and consulting firm operating from a decade, we have published and advised several client across the globe. First step for any study will start with an assessment of currently available data and insights from existing reports. Further, historical and current market information is collected from Investor Presentations, Annual Reports, SEC Filings, etc., and other information related to company’s performance and market positioning are gathered from Paid Databases (Factiva, Hoovers, and Reuters) and various other publications available in public domain.
Several associations trade associates, technical forums, institutes, societies and organization are accessed to gain technical as well as market related insights through their publications such as research papers, blogs and press releases related to the studies are referred to get cues about the market. Further, white papers, journals, magazines, and other news articles published in last 3 years are scrutinized and analyzed to understand the current market trends.
- Primary Research:
The primarily interview analysis comprise of data obtained from industry participants interview and answers to survey questions gathered by in-house primary team.
For primary research, interviews are conducted with industry experts/CEOs/Marketing Managers/VPs/Subject Matter Experts from both demand and supply side to get a 360-degree view of the market. The primary team conducts several interviews based on the complexity of the markets to understand the various market trends and dynamics which makes research more credible and precise.
A typical research interview fulfils the following functions:
- Provides first-hand information on the market size, market trends, growth trends, competitive landscape, and outlook
- Validates and strengthens in-house secondary research findings
- Develops the analysis team’s expertise and market understanding
Primary research involves email interactions and telephone interviews for each market, category, segment, and sub-segment across geographies. The participants who typically take part in such a process include, but are not limited to:
- Industry participants: VPs, business development managers, market intelligence managers and national sales managers
- Outside experts: Valuation experts, research analysts and key opinion leaders specializing in the electronics and semiconductor industry.
Below is the breakup of our primary respondents by company, designation, and region:

Once we receive the confirmation from primary research sources or primary respondents, we finalize the base year market estimation and forecast the data as per the macroeconomic and microeconomic factors assessed during data collection.
- Data Analysis:
Once data is validated through both secondary as well as primary respondents, we finalize the market estimations by hypothesis formulation and factor analysis at regional and country level.
- Macro-Economic Factor Analysis:
We analyse macroeconomic indicators such the gross domestic product (GDP), increase in the demand for goods and services across industries, technological advancement, regional economic growth, governmental policies, the influence of COVID-19, PEST analysis, and other aspects. This analysis aids in setting benchmarks for various nations/regions and approximating market splits. Additionally, the general trend of the aforementioned components aid in determining the market's development possibilities.
- Country Level Data:
Various factors that are especially aligned to the country are taken into account to determine the market size for a certain area and country, including the presence of vendors, such as headquarters and offices, the country's GDP, demand patterns, and industry growth. To comprehend the market dynamics for the nation, a number of growth variables, inhibitors, application areas, and current market trends are researched. The aforementioned elements aid in determining the country's overall market's growth potential.
- Company Profile:
The “Table of Contents” is formulated by listing and analyzing more than 25 - 30 companies operating in the market ecosystem across geographies. However, we profile only 10 companies as a standard practice in our syndicate reports. These 10 companies comprise leading, emerging, and regional players. Nonetheless, our analysis is not restricted to the 10 listed companies, we also analyze other companies present in the market to develop a holistic view and understand the prevailing trends. The “Company Profiles” section in the report covers key facts, business description, products & services, financial information, SWOT analysis, and key developments. The financial information presented is extracted from the annual reports and official documents of the publicly listed companies. Upon collecting the information for the sections of respective companies, we verify them via various primary sources and then compile the data in respective company profiles. The company level information helps us in deriving the base number as well as in forecasting the market size.
- Developing Base Number:
Aggregation of sales statistics (2020-2022) and macro-economic factor, and other secondary and primary research insights are utilized to arrive at base number and related market shares for 2022. The data gaps are identified in this step and relevant market data is analyzed, collected from paid primary interviews or databases. On finalizing the base year market size, forecasts are developed on the basis of macro-economic, industry and market growth factors and company level analysis.
- Data Triangulation and Final Review:
The market findings and base year market size calculations are validated from supply as well as demand side. Demand side validations are based on macro-economic factor analysis and benchmarks for respective regions and countries. In case of supply side validations, revenues of major companies are estimated (in case not available) based on industry benchmark, approximate number of employees, product portfolio, and primary interviews revenues are gathered. Further revenue from target product/service segment is assessed to avoid overshooting of market statistics. In case of heavy deviations between supply and demand side values, all thes steps are repeated to achieve synchronization.
We follow an iterative model, wherein we share our research findings with Subject Matter Experts (SME’s) and Key Opinion Leaders (KOLs) until consensus view of the market is not formulated – this model negates any drastic deviation in the opinions of experts. Only validated and universally acceptable research findings are quoted in our reports.
We have important check points that we use to validate our research findings – which we call – data triangulation, where we validate the information, we generate from secondary sources with primary interviews and then we re-validate with our internal data bases and Subject matter experts. This comprehensive model enables us to deliver high quality, reliable data in shortest possible time.


 このレポートの無料サンプルを入手する