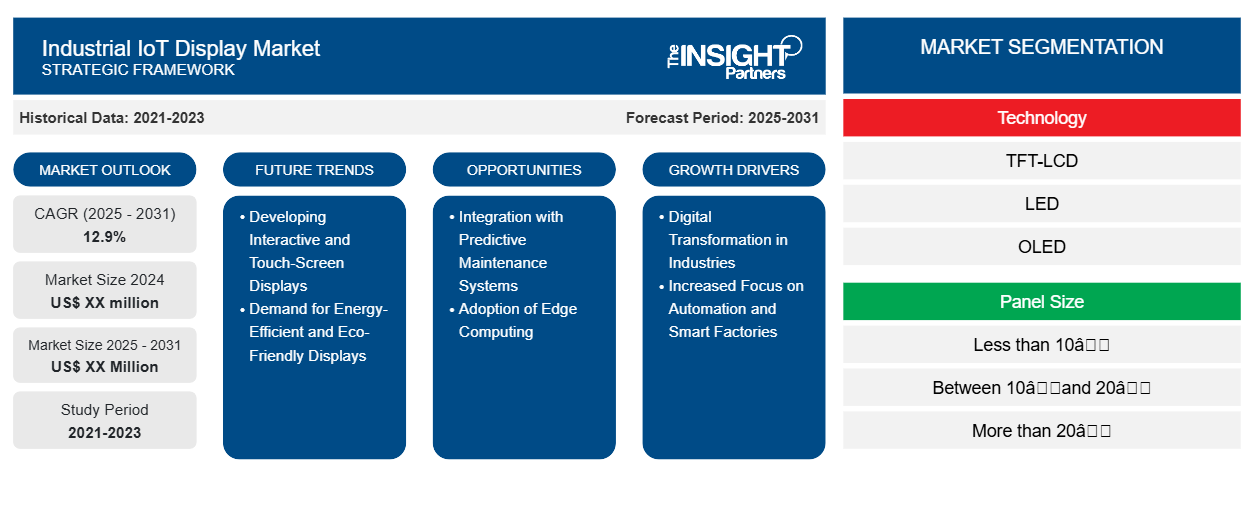
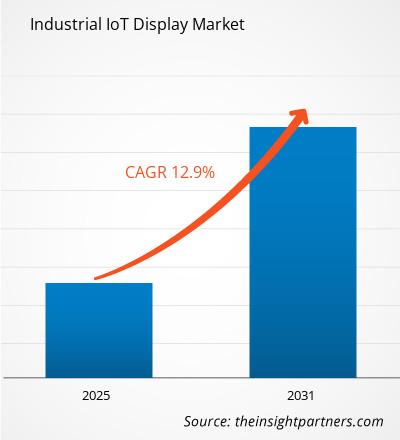
産業用 IoT ディスプレイ市場は、2025 年から 2031 年にかけて 12.9% の CAGR を記録し、市場規模は 2024 年の XX 百万米ドルから 2031 年には XX 百万米ドルに拡大すると予想されています。
レポートは、テクノロジー(TFT-LCD、LED、OLED、電子ペーパーディスプレイ)、パネルサイズ(10インチ未満、10インチから20インチの間、20インチ以上)、アプリケーション(ヒューマンマシンインターフェース、リモートモニタリング、インタラクティブディスプレイ、電子棚札、その他)、業界(製造、ヘルスケア、エネルギーと電力、輸送、その他)別にセグメント化されています。グローバル分析は、地域レベルと主要国でさらに細分化されています。レポートでは、上記の分析とセグメントの値をUSDで提供しています。
報告書の目的
The Insight Partners による産業用 IoT ディスプレイ市場のレポートは、現在の状況と将来の成長、主な推進要因、課題、機会を説明することを目的としています。これにより、次のようなさまざまなビジネス関係者に洞察が提供されます。
- テクノロジープロバイダー/メーカー: 進化する市場の動向を理解し、潜在的な成長機会を把握することで、情報に基づいた戦略的意思決定が可能になります。
- 投資家: 市場の成長率、市場の財務予測、バリュー チェーン全体に存在する機会に関する包括的な傾向分析を実施します。
- 規制機関: 市場の濫用を最小限に抑え、投資家の信用と信頼を維持し、市場の完全性と安定性を維持することを目的として、市場における政策と警察活動を規制します。
産業用IoTディスプレイ市場のセグメンテーション
テクノロジー
- TFT液晶
- 導かれた
- 有機EL
- 電子ペーパーディスプレイ
パネルサイズ
- 10未満
- 10〜20インチ
- 20以上
応用
- ヒューマンマシンインターフェース
- リモートモニタリング
- インタラクティブディスプレイ
- 電子棚札
業界
- 製造業
- 健康管理
- エネルギーと電力
- 交通機関
要件に合わせてレポートをカスタマイズする
このレポートの一部、国レベルの分析、Excelデータパックなど、あらゆるレポートを無料でカスタマイズできます。また、スタートアップや大学向けのお得なオファーや割引もご利用いただけます。
産業用 IoT ディスプレイ市場:戦略的洞察
- このレポートの主要な市場動向を入手してください。この無料サンプルには、市場動向から見積もりや予測に至るまでのデータ分析が含まれます。
産業用IoTディスプレイ市場の成長要因
- 業界におけるデジタル変革: 製造、物流、石油・ガス、エネルギーなどの業界では、業務効率の向上とダウンタイムの最小化のために、デジタル技術の導入が進んでいます。IoT センサーや接続デバイスが生産環境に統合されるにつれて、リアルタイムのデータ可視化がますます重要になっています。ディスプレイは、オペレーターや作業者に重要な情報を提供し、効率的に業務を監視できるため、このプロセスで重要な役割を果たします。ディスプレイには接続デバイスやシステムからのデータを表示できるため、ユーザーは予知保全、プロセス最適化、リモート監視についてデータに基づいた意思決定を行うことができます。
- 自動化とスマート ファクトリーへの注目の高まり: 自動化とスマート ファクトリーに重点を置いたインダストリー 4.0 の台頭により、高度なディスプレイを含む IIoT ソリューションの需要が高まっています。自動化システム、ロボット工学、AI 搭載アプリケーションでは、リアルタイムのフィードバックを提供するために直感的なユーザー インターフェイス (UI) が必要です。さまざまなセンサー、コントローラー、エンタープライズ システムと統合された IIoT ディスプレイは、オペレーターとマネージャーがパフォーマンス メトリックを視覚化し、設定を制御し、リモートでトラブルシューティングを行うのに役立ち、効率性を高め、人的エラーを削減します。
産業用IoTディスプレイ市場の将来動向
- インタラクティブ ディスプレイとタッチ スクリーン ディスプレイの開発: インタラクティブ ディスプレイやタッチ スクリーン ディスプレイへの移行が急速に進んでおり、オペレーターは表示されたデータと積極的にやり取りすることができます。これらのディスプレイは、よりユーザー フレンドリなインターフェイスを提供し、リアルタイム データを簡単に制御してアクセスすることができます。この傾向は、迅速な意思決定と複雑なデータとのシームレスな連携が求められる状況では特に重要です。タッチ ベースのインターフェイスはより直感的であるため、トレーニング時間が短縮され、操作効率が向上します。
- エネルギー効率が高く環境に優しいディスプレイの需要: 産業活動において持続可能性がますます重要になるにつれ、消費電力が少なく環境への影響が少ないエネルギー効率の高いディスプレイの需要が高まっています。IIoT ディスプレイ メーカーは、低電力コンポーネント、エネルギー効率の高いバックライト技術 (OLED や LED など)、リサイクル可能な材料を使用した環境に優しいディスプレイの開発に取り組んでいます。この傾向は、業界全体の持続可能性の目標と一致しており、環境に優しい製品の需要を刺激する可能性があります。
産業用 IoT ディスプレイ市場の機会
- 予知保全システムとの統合: 企業がダウンタイムを削減し、生産性を向上させようとしているため、予知保全 (PdM) ソリューションが注目を集めています。PdM システムと統合された IIoT ディスプレイは、オペレーターに機器の状態に関するリアルタイムの警告と洞察を提供します。PdM アルゴリズムとシームレスに連携するディスプレイを作成することで、詳細な診断、警告サイン、実用的なデータをユーザーに提供し、障害が発生する前に防止することができます。
- エッジ コンピューティングの採用: エッジ コンピューティング テクノロジーが進歩するにつれて、より多くの処理と分析をデータが生成される場所の近くで実行できるようになり、レイテンシが短縮されます。IIoT ディスプレイは、クラウドベースのシステムに依存せずに、エッジ デバイスと直接インターフェイスして、オペレーターにリアルタイムの情報を提供できます。クラウドからエッジ コンピューティングへの移行により、意思決定が加速され、デバイスまたはマシン レベルでの応答が高速化され、よりローカルな意思決定が可能になります。これにより、IIoT ディスプレイ市場の成長が促進されます。
産業用 IoT ディスプレイ市場の地域別分析
予測期間を通じて産業用 IoT ディスプレイ市場に影響を与える地域的な傾向と要因は、Insight Partners のアナリストによって徹底的に説明されています。このセクションでは、北米、ヨーロッパ、アジア太平洋、中東およびアフリカ、南米および中米にわたる産業用 IoT ディスプレイ市場のセグメントと地理についても説明します。
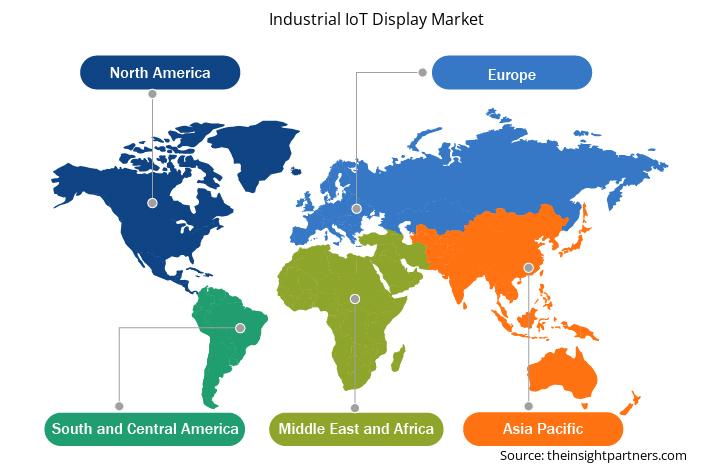
- 産業用IoTディスプレイ市場の地域別データを入手
産業用IoTディスプレイ市場レポートの範囲
| レポート属性 | 詳細 |
|---|---|
| 2024年の市場規模 | XX百万米ドル |
| 2031年までの市場規模 | XX百万米ドル |
| 世界のCAGR(2025年~2031年) | 12.9% |
| 履歴データ | 2021-2023 |
| 予測期間 | 2025-2031 |
| 対象セグメント | テクノロジー別
|
| 対象地域と国 | 北米
|
| 市場リーダーと主要企業プロフィール |
|
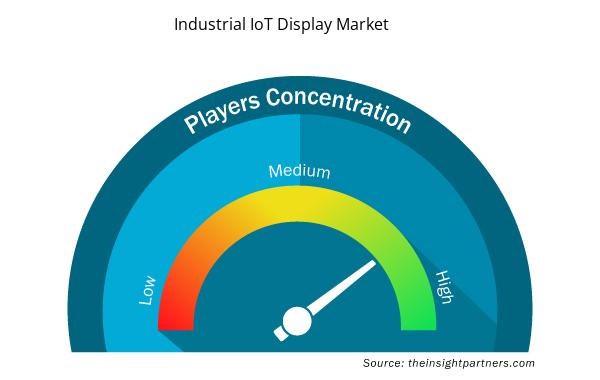
産業用 IoT ディスプレイ市場のプレーヤー密度: ビジネス ダイナミクスへの影響を理解する
産業用 IoT ディスプレイ市場は、消費者の嗜好の変化、技術の進歩、製品の利点に対する認識の高まりなどの要因により、エンドユーザーの需要が高まり、急速に成長しています。需要が高まるにつれて、企業は提供を拡大し、消費者のニーズを満たすために革新し、新たなトレンドを活用し、市場の成長をさらに促進しています。
市場プレーヤー密度とは、特定の市場または業界内で活動している企業または会社の分布を指します。これは、特定の市場スペースに、その規模または総市場価値と比較して、どれだけの競合相手 (市場プレーヤー) が存在するかを示します。
産業用 IoT ディスプレイ市場で事業を展開している主要企業は次のとおりです。
- E Inkホールディングス株式会社
- BOEテクノロジーグループ株式会社
- アドバンテック株式会社
- ペッパール+フックス SE
- シャープ株式会社
- プラナーシステムズ株式会社
免責事項:上記の企業は、特定の順序でランク付けされていません。
- 産業用IoTディスプレイ市場のトップキープレーヤーの概要を入手
主なセールスポイント
- 包括的なカバレッジ: レポートでは、産業用 IoT ディスプレイ市場の製品、サービス、タイプ、エンドユーザーの分析を包括的にカバーし、全体的な展望を提供します。
- 専門家による分析: レポートは、業界の専門家とアナリストの深い理解に基づいてまとめられています。
- 最新情報: このレポートは、最新の情報とデータの傾向を網羅しているため、ビジネスの関連性を保証します。
- カスタマイズ オプション: このレポートは、特定のクライアント要件に対応し、ビジネス戦略に適切に適合するようにカスタマイズできます。
したがって、産業用 IoT ディスプレイ市場に関する調査レポートは、業界のシナリオと成長の見通しを解読し理解する道の先導役となる可能性があります。いくつかの正当な懸念があるかもしれませんが、このレポートの全体的な利点は欠点を上回る傾向があります。
- 過去2年間の分析、基準年、CAGRによる予測(7年間)
- PEST分析とSWOT分析
- 市場規模価値/数量 - 世界、地域、国
- 業界と競争環境
- Excel データセット

Report Coverage
Revenue forecast, Company Analysis, Industry landscape, Growth factors, and Trends

Segment Covered
This text is related
to segments covered.

Regional Scope
North America, Europe, Asia Pacific, Middle East & Africa, South & Central America

Country Scope
This text is related
to country scope.
よくある質問
Some of the customization options available based on the request are an additional 3–5 company profiles and country-specific analysis of 3–5 countries of your choice. Customizations are to be requested/discussed before making final order confirmation# as our team would review the same and check the feasibility
The report can be delivered in PDF/PPT format; we can also share excel dataset based on the request
Development of interactive and touch-screen displays and demand for energy-efficient and eco-friendly displays is likely to remain a key trend in the market.
Digital transformation in industries and increased focus on automation and smart factories are the major factors driving the industrial IoT display market.
Global industrial IoT display market is expected to grow at a CAGR of 12.9% during the forecast period 2024 - 2031.
Trends and growth analysis reports related to Electronics and Semiconductor : READ MORE..
The Insight Partners performs research in 4 major stages: Data Collection & Secondary Research, Primary Research, Data Analysis and Data Triangulation & Final Review.
- Data Collection and Secondary Research:
As a market research and consulting firm operating from a decade, we have published and advised several client across the globe. First step for any study will start with an assessment of currently available data and insights from existing reports. Further, historical and current market information is collected from Investor Presentations, Annual Reports, SEC Filings, etc., and other information related to company’s performance and market positioning are gathered from Paid Databases (Factiva, Hoovers, and Reuters) and various other publications available in public domain.
Several associations trade associates, technical forums, institutes, societies and organization are accessed to gain technical as well as market related insights through their publications such as research papers, blogs and press releases related to the studies are referred to get cues about the market. Further, white papers, journals, magazines, and other news articles published in last 3 years are scrutinized and analyzed to understand the current market trends.
- Primary Research:
The primarily interview analysis comprise of data obtained from industry participants interview and answers to survey questions gathered by in-house primary team.
For primary research, interviews are conducted with industry experts/CEOs/Marketing Managers/VPs/Subject Matter Experts from both demand and supply side to get a 360-degree view of the market. The primary team conducts several interviews based on the complexity of the markets to understand the various market trends and dynamics which makes research more credible and precise.
A typical research interview fulfils the following functions:
- Provides first-hand information on the market size, market trends, growth trends, competitive landscape, and outlook
- Validates and strengthens in-house secondary research findings
- Develops the analysis team’s expertise and market understanding
Primary research involves email interactions and telephone interviews for each market, category, segment, and sub-segment across geographies. The participants who typically take part in such a process include, but are not limited to:
- Industry participants: VPs, business development managers, market intelligence managers and national sales managers
- Outside experts: Valuation experts, research analysts and key opinion leaders specializing in the electronics and semiconductor industry.
Below is the breakup of our primary respondents by company, designation, and region:

Once we receive the confirmation from primary research sources or primary respondents, we finalize the base year market estimation and forecast the data as per the macroeconomic and microeconomic factors assessed during data collection.
- Data Analysis:
Once data is validated through both secondary as well as primary respondents, we finalize the market estimations by hypothesis formulation and factor analysis at regional and country level.
- Macro-Economic Factor Analysis:
We analyse macroeconomic indicators such the gross domestic product (GDP), increase in the demand for goods and services across industries, technological advancement, regional economic growth, governmental policies, the influence of COVID-19, PEST analysis, and other aspects. This analysis aids in setting benchmarks for various nations/regions and approximating market splits. Additionally, the general trend of the aforementioned components aid in determining the market's development possibilities.
- Country Level Data:
Various factors that are especially aligned to the country are taken into account to determine the market size for a certain area and country, including the presence of vendors, such as headquarters and offices, the country's GDP, demand patterns, and industry growth. To comprehend the market dynamics for the nation, a number of growth variables, inhibitors, application areas, and current market trends are researched. The aforementioned elements aid in determining the country's overall market's growth potential.
- Company Profile:
The “Table of Contents” is formulated by listing and analyzing more than 25 - 30 companies operating in the market ecosystem across geographies. However, we profile only 10 companies as a standard practice in our syndicate reports. These 10 companies comprise leading, emerging, and regional players. Nonetheless, our analysis is not restricted to the 10 listed companies, we also analyze other companies present in the market to develop a holistic view and understand the prevailing trends. The “Company Profiles” section in the report covers key facts, business description, products & services, financial information, SWOT analysis, and key developments. The financial information presented is extracted from the annual reports and official documents of the publicly listed companies. Upon collecting the information for the sections of respective companies, we verify them via various primary sources and then compile the data in respective company profiles. The company level information helps us in deriving the base number as well as in forecasting the market size.
- Developing Base Number:
Aggregation of sales statistics (2020-2022) and macro-economic factor, and other secondary and primary research insights are utilized to arrive at base number and related market shares for 2022. The data gaps are identified in this step and relevant market data is analyzed, collected from paid primary interviews or databases. On finalizing the base year market size, forecasts are developed on the basis of macro-economic, industry and market growth factors and company level analysis.
- Data Triangulation and Final Review:
The market findings and base year market size calculations are validated from supply as well as demand side. Demand side validations are based on macro-economic factor analysis and benchmarks for respective regions and countries. In case of supply side validations, revenues of major companies are estimated (in case not available) based on industry benchmark, approximate number of employees, product portfolio, and primary interviews revenues are gathered. Further revenue from target product/service segment is assessed to avoid overshooting of market statistics. In case of heavy deviations between supply and demand side values, all thes steps are repeated to achieve synchronization.
We follow an iterative model, wherein we share our research findings with Subject Matter Experts (SME’s) and Key Opinion Leaders (KOLs) until consensus view of the market is not formulated – this model negates any drastic deviation in the opinions of experts. Only validated and universally acceptable research findings are quoted in our reports.
We have important check points that we use to validate our research findings – which we call – data triangulation, where we validate the information, we generate from secondary sources with primary interviews and then we re-validate with our internal data bases and Subject matter experts. This comprehensive model enables us to deliver high quality, reliable data in shortest possible time.
 このレポートの無料サンプルを入手する