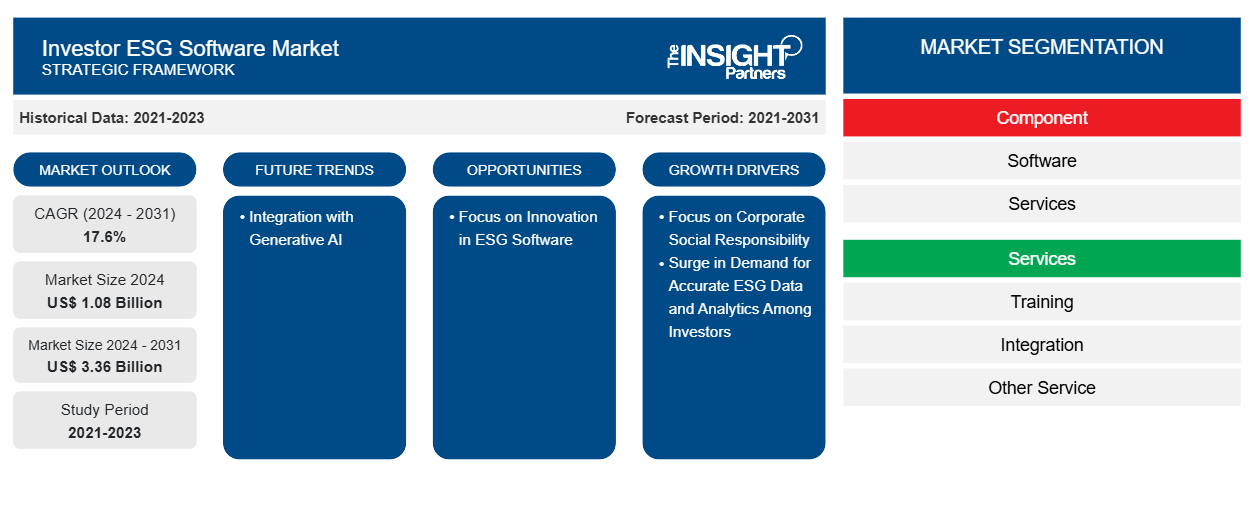
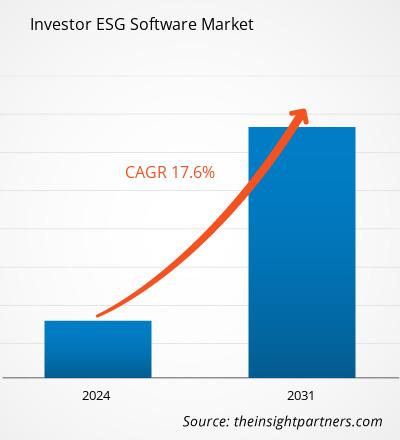
投資家向け ESG ソフトウェア市場規模は 2024 年に 10 億 8,000 万米ドルと評価され、2031 年までに 33 億 6,000 万米ドルに達すると予想されています。また、2024 年から 2031 年にかけて 17.6% の CAGR を記録すると予測されています。ESG ソフトウェアと生成 AI の統合により、今後数年間で市場に新たなトレンドがもたらされる可能性があります。
投資家向け ESG ソフトウェア市場分析
投資家向け ESG ソフトウェア市場は、責任ある投資の需要の高まり、気候変動、社会問題、ガバナンス慣行に関する懸念の高まり、そして進化するグローバル ESG 基準の透明性とコンプライアンスの必要性により、大幅な成長を遂げています。投資家向け ESG ソフトウェアの需要は、意思決定プロセスに ESG 要素を統合しようとしている機関投資家、資産運用会社、金融機関によって推進されています。企業の社会的責任への重点や、正確な ESG データと分析に対する投資家の需要の高まりなどの要因も、投資家向け ESG ソフトウェア市場を牽引しています。さらに、ESG ソフトウェアの革新と生成 AI との統合への重点は、予測期間中に投資家向け ESG ソフトウェア市場のプレーヤーの成長にとって有利な機会を生み出しています。
投資家向け ESG ソフトウェア市場の概要
組織は投資家向け ESG ソフトウェアを利用してアンケートをカスタマイズし、データ収集を効率化することで、正確で比較可能な ESG パフォーマンス指標の集約を可能にします。このサービスとしてのソフトウェア プラットフォームは ESG イニシアチブを強化し、企業が価値を最大化し、投資を評価するのに役立ちます。ESG 投資、つまり持続可能な投資は、責任ある、持続可能な、または倫理的な投資を定義する要因を特定することに重点を置いています。ESG ソフトウェアは、投資家と資本市場企業の両方が企業の行動を評価するために使用し、将来の財務実績を予測するための洞察を提供します。多くの企業がこれらのソフトウェア ソリューションを実装して、業務、ビジネス関係、資産、投資に関連するリスクを軽減しています。
ESG プラットフォームは投資分析をサポートし、より情報に基づいた戦略的な投資決定を可能にします。投資家向け ESG ソフトウェアは、投資家がポートフォリオと投資決定の ESG パフォーマンスを評価、追跡、管理できるようにカスタマイズされています。これらのプラットフォームは、さまざまな ESG 指標に関するデータ主導の洞察、分析、レポートを提供し、投資家が投資戦略を持続可能性の目標と規制要件に合わせられるようにします。
要件に合わせてレポートをカスタマイズする
このレポートの一部、国レベルの分析、Excelデータパックなど、あらゆるレポートを無料でカスタマイズできます。また、スタートアップや大学向けのお得なオファーや割引もご利用いただけます。
投資家向け ESG ソフトウェア市場:
- このレポートの主要な市場動向を入手してください。この無料サンプルには、市場動向から見積もりや予測に至るまでのデータ分析が含まれます。
投資家向け ESG ソフトウェア市場の推進要因と機会
企業の社会的責任に焦点を当てる
企業持続可能性報告指令(CSRD)の制定は、投資家向けESGソフトウェアの需要を大幅に促進する大きな規制の転換を表しています。2023年1月に非財務報告指令(NFRD)に代わるCSRDは、欧州連合内で義務付けられているESG報告の範囲を大幅に拡大します。NFRDでは、約11,000社の大企業がESG情報の開示を義務付けられていました。しかし、CSRDではこの義務を約50,000社に拡大し、これはすべてのEU企業の総売上高の約75%を占めています。これには大企業だけでなく上場中小企業(SME)も含まれ、ESG開示とコンプライアンス要件の範囲が大幅に広がります。CSRDでは、企業が人権、気候リスク、生物多様性、サプライチェーンの透明性などの分野をカバーする詳細な社会、環境、ガバナンス情報を開示することを義務付けています。この包括的な報告フレームワークにより、企業はヨーロッパおよびその他の地域内で環境と人権への悪影響に対処し、それを緩和することができます。 CSRD は、これらの新しい規則を施行することにより、ESG データの一貫性、比較可能性、信頼性を高め、投資家、規制当局、一般の人々にとってデータの透明性とアクセス性を高めることを目指しています。
ESGソフトウェアのイノベーションに焦点を当てる
ESGソフトウェアのイノベーションへの重点は、予測期間中に投資家のESGソフトウェア市場の成長に多くの機会を生み出すと予想されます。透明性、正確性、実用的なESGデータの需要が高まり続ける中、投資家は情報に基づいた投資判断を行うために高度なESGソフトウェアソリューションにますます依存するようになっています。環境、社会、ガバナンス(ESG)要因の進化する状況では、投資家は革新的なソフトウェアツールでのみ提供できる包括的でリアルタイムの洞察にアクセスする必要があります。ESGソフトウェアのイノベーションには、人工知能(AI)などの最先端技術の統合が含まれており、ESGデータの収集、処理、分析の方法を再構築しています。たとえば、2024年4月、ESGデータソリューションプロバイダーのESGgoは、企業が規制の枠組みや利害関係者の期待に沿ってサステナビリティレポートを簡単に生成できるように設計されたAI搭載ツールであるワンクリックサステナビリティレポートのリリースを発表しました。ESGgoは、この新しいソリューションにより、組織のサステナビリティレポートプロセスが簡素化され、進化する標準への準拠が保証されると述べています。このプラットフォームの AI 駆動型データ エンジンは、数値とテキストベースの両方の情報を処理し、排出量を計算し、データセットを統合してカスタマイズされた持続可能性レポートを作成します。これらの進歩により、投資家は企業の持続可能性パフォーマンスをより効率的に監視できるだけでなく、リアルタイム データに基づいて将来の ESG リスクと機会を予測できます。多くの場合、さまざまなソースから取得される膨大な量のデータを処理し、それを実用的な ESG 指標に統合する機能は、透明性と信頼性を求める投資家にとって大きなメリットです。
投資家向け ESG ソフトウェア市場レポートのセグメンテーション分析
投資家向け ESG ソフトウェア市場分析の導出に貢献した主要なセグメントは、コンポーネント、サービス、企業規模です。
- コンポーネントに基づいて、投資家 ESG ソフトウェア市場はソフトウェアとサービスに分かれています。2024 年にはソフトウェア セグメントが市場を支配しました。
- サービス面では、投資家向け ESG ソフトウェア市場は、トレーニング、統合、その他のサービスに分類されます。その他のサービス セグメントは、2024 年に市場で最大のシェアを占めました。
- 企業規模に基づいて、投資家向け ESG ソフトウェア市場は大企業と中小企業に分かれています。2024 年には大企業セグメントが市場を支配しました。
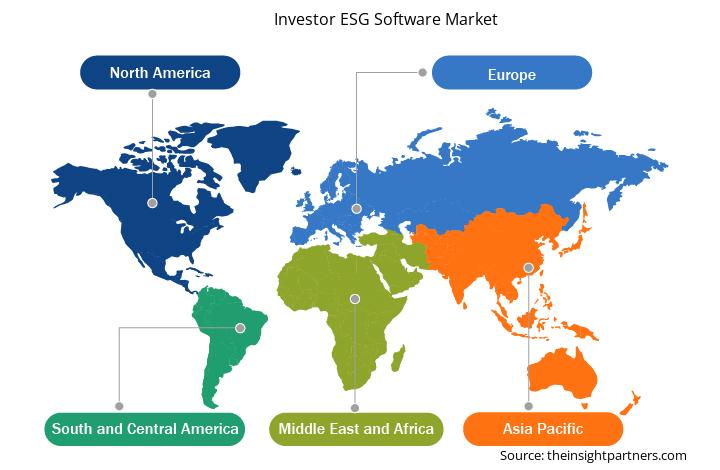
地域別投資家ESGソフトウェア市場シェア分析
- 投資家向け ESG ソフトウェア市場は、北米、ヨーロッパ、アジア太平洋 (APAC)、中東およびアフリカ (MEA)、南米および中米の 5 つの主要地域に分かれています。2024 年には北米が市場を支配し、ヨーロッパとアジア太平洋がそれに続きます。
- 北米の投資家向け ESG ソフトウェア市場は、米国証券取引委員会 (SEC) の気候情報開示提案など、法的要件の増加により、予測期間中に成長すると予測されています。これらの法的義務により、資産運用会社や機関投資家は、意思決定プロセスで ESG の懸念やルールに対処するようプレッシャーを受けます。さらに、持続可能性への重点が高まり、気候変動への懸念が高まるにつれて、投資家や利害関係者の間で、明確でデータに基づく洞察を求める ESG ソフトウェアの需要が高まっています。これらの洞察は、企業の ESG パフォーマンスを効果的に評価するのに役立ちます。ソフトウェアは、リアルタイムの ESG レポート、コンプライアンス追跡、リスク評価を可能にすることで、企業に高い説明責任を提供します。
- ヨーロッパ各国の政府は、持続可能な財務開示規則 (SFDR) や EU タクソノミー規則など、事業運営における持続可能性を促進する対策を講じています。これらの要件により、資産運用会社や機関投資家は投資の ESG 影響を開示および評価することが求められ、コンプライアンスとデータ管理を可能にする技術的に高度な ESG ソフトウェアの導入が急増しています。さらに、ヨーロッパの投資家は、地域のグリーンディール目標をサポートするために持続可能な投資を拡大しており、データの管理と情報に基づいた意思決定に役立つ投資家向け ESG ソフトウェアの需要が高まっています。
投資家向け ESG ソフトウェア市場の地域別分析
予測期間を通じて投資家 ESG ソフトウェア市場に影響を与える地域的な傾向と要因は、Insight Partners のアナリストによって徹底的に説明されています。このセクションでは、北米、ヨーロッパ、アジア太平洋、中東およびアフリカ、南米および中米にわたる投資家 ESG ソフトウェア市場のセグメントと地理についても説明します。
- 投資家向けESGソフトウェア市場の地域別データを入手
投資家向けESGソフトウェア市場レポートの範囲
| レポート属性 | 詳細 |
|---|---|
| 2024年の市場規模 | 10億8千万米ドル |
| 2031年までの市場規模 | 33億6千万米ドル |
| 世界のCAGR(2024年 - 2031年) | 17.6% |
| 履歴データ | 2021-2023 |
| 予測期間 | 2021-2031 |
| 対象セグメント | コンポーネント別
|
| 対象地域と国 | 北米
|
| 市場リーダーと主要企業プロフィール |
|
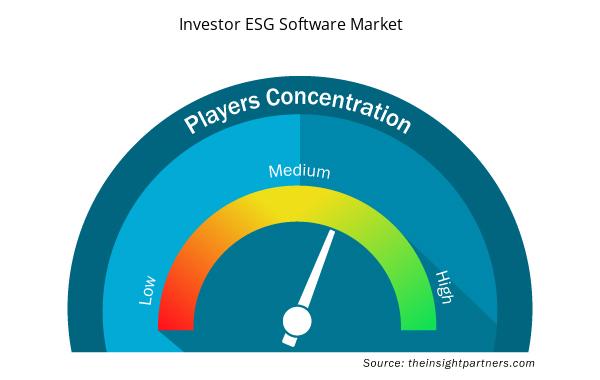
投資家向け ESG ソフトウェア市場のプレーヤー密度: ビジネス ダイナミクスへの影響を理解する
投資家向け ESG ソフトウェア市場は、消費者の嗜好の変化、技術の進歩、製品の利点に対する認識の高まりなどの要因により、エンドユーザーの需要が高まり、急速に成長しています。需要が高まるにつれて、企業は提供内容を拡大し、消費者のニーズを満たすために革新し、新たなトレンドを活用し、市場の成長をさらに促進しています。
市場プレーヤー密度とは、特定の市場または業界内で活動している企業または会社の分布を指します。これは、特定の市場スペースに、その規模または総市場価値と比較して、どれだけの競合相手 (市場プレーヤー) が存在するかを示します。
投資家向け ESG ソフトウェア市場で事業を展開している主要企業は次のとおりです。
- MSCI
- ワーキバ株式会社
- モーニングスター株式会社
- ロンドン証券取引所グループ
- コリティソフトウェア株式会社
- プロフィックスソフトウェア株式会社
免責事項:上記の企業は、特定の順序でランク付けされていません。
- 投資家向けESGソフトウェア市場のトップキープレーヤーの概要を入手
投資家向け ESG ソフトウェア市場のニュースと最近の動向
投資家 ESG ソフトウェア市場は、主要な企業出版物、協会データ、データベースを含む一次調査および二次調査後の定性的および定量的データを収集することによって評価されます。投資家 ESG ソフトウェア市場の動向のいくつかを以下に示します。
- Cority は、同社の持続可能性ソリューションのいずれかを活用しているすべての顧客を、2025 年に同社の SaaS ベースの統合型 CorityOne プラットフォームにアップグレードすると発表しました。顧客が 10 年以上にわたって持続可能性管理に信頼を寄せてきた既存のテクノロジーを基盤とするこのアップグレードにより、複数のソリューションが統合され、機能が強化されたシームレスで強化されたユーザー エクスペリエンスが実現し、運用がさらに効率化され、データ統合が改善されます。
(出典: Cority Software Inc、プレスリリース、2024 年 8 月)
- Sphera は、企業が透明性、責任、回復力のあるサプライ チェーンを構築できるようにするサプライ チェーン持続可能性ソフトウェア企業である SupplyShift の買収を発表しました。この買収により、大手 ESG 企業のサプライ チェーン サービスが強化され、サプライヤー マッピング、スコアリング、追跡機能が拡張され、顧客が持続可能なサプライ チェーンを構築するための支援がさらに強化されます。
(出典:Sphera Solutions, Inc.、プレスリリース、2024年1月)
投資家向け ESG ソフトウェア市場レポートの対象範囲と成果物
「投資家向け ESG ソフトウェア市場の規模と予測 (2021 ~ 2031 年)」では、以下の分野を網羅した市場の詳細な分析を提供しています。
- 投資家向けESGソフトウェア市場規模と予測(対象範囲に含まれるすべての主要市場セグメントについて、世界、地域、国レベルで)
- 投資家向けESGソフトウェア市場の動向、および推進要因、制約、主要な機会などの市場動向
- 詳細なPESTおよびSWOT分析
- 主要な市場動向、世界および地域の枠組み、主要プレーヤー、規制、最近の市場動向を網羅した投資家向けESGソフトウェア市場分析
- 市場集中、ヒートマップ分析、主要プレーヤー、投資家向け ESG ソフトウェア市場の最近の動向を網羅した業界展望と競争分析
- 詳細な企業プロフィール
- 過去2年間の分析、基準年、CAGRによる予測(7年間)
- PEST分析とSWOT分析
- 市場規模価値/数量 - 世界、地域、国
- 業界と競争環境
- Excel データセット
- Hydrogen Storage Alloys Market
- Railway Braking System Market
- Hydrocephalus Shunts Market
- Non-Emergency Medical Transportation Market
- Bio-Based Ethylene Market
- Educational Furniture Market
- Military Rubber Tracks Market
- Sleep Apnea Diagnostics Market
- Hand Sanitizer Market
- Bioremediation Technology and Services Market

Report Coverage
Revenue forecast, Company Analysis, Industry landscape, Growth factors, and Trends

Segment Covered
This text is related
to segments covered.

Regional Scope
North America, Europe, Asia Pacific, Middle East & Africa, South & Central America

Country Scope
This text is related
to country scope.
よくある質問
Focus on corporate social responsibility, and surge in demand for accurate ESG data and analytics among investors are the major factors that propel the global investor ESG software market.
The global investor ESG software market is expected to reach US$ 3.36 billion by 2031.
The global Investor ESG software market was estimated to be US$ 1.08 billion in 2024 and is expected to grow at a CAGR of 17.6% during the forecast period 2025 – 2031.
The key players holding majority shares in the global investor ESG software market are MSCI, FactSet, Workiva Inc., SAP SE, and Bloomberg Finance L.P.
The incremental growth expected to be recorded for the global investor ESG software market during the forecast period is US$ 2.27 billion.
Integration with Generative AI is anticipated to play a significant role in the global investor ESG software market in the coming years.
Trends and growth analysis reports related to Technology, Media and Telecommunications : READ MORE..
The List of Companies - Investor ESG Software Market
- MSCI
- Workiva Inc.
- Morningstar Sustainalytics
- London Stock Exchange Group plc
- Cority
- Prophix Software Inc.
- SAP SE
- Sphera
- FactSet
- Bloomberg Finance L.P.
The Insight Partners performs research in 4 major stages: Data Collection & Secondary Research, Primary Research, Data Analysis and Data Triangulation & Final Review.
- Data Collection and Secondary Research:
As a market research and consulting firm operating from a decade, we have published and advised several client across the globe. First step for any study will start with an assessment of currently available data and insights from existing reports. Further, historical and current market information is collected from Investor Presentations, Annual Reports, SEC Filings, etc., and other information related to company’s performance and market positioning are gathered from Paid Databases (Factiva, Hoovers, and Reuters) and various other publications available in public domain.
Several associations trade associates, technical forums, institutes, societies and organization are accessed to gain technical as well as market related insights through their publications such as research papers, blogs and press releases related to the studies are referred to get cues about the market. Further, white papers, journals, magazines, and other news articles published in last 3 years are scrutinized and analyzed to understand the current market trends.
- Primary Research:
The primarily interview analysis comprise of data obtained from industry participants interview and answers to survey questions gathered by in-house primary team.
For primary research, interviews are conducted with industry experts/CEOs/Marketing Managers/VPs/Subject Matter Experts from both demand and supply side to get a 360-degree view of the market. The primary team conducts several interviews based on the complexity of the markets to understand the various market trends and dynamics which makes research more credible and precise.
A typical research interview fulfils the following functions:
- Provides first-hand information on the market size, market trends, growth trends, competitive landscape, and outlook
- Validates and strengthens in-house secondary research findings
- Develops the analysis team’s expertise and market understanding
Primary research involves email interactions and telephone interviews for each market, category, segment, and sub-segment across geographies. The participants who typically take part in such a process include, but are not limited to:
- Industry participants: VPs, business development managers, market intelligence managers and national sales managers
- Outside experts: Valuation experts, research analysts and key opinion leaders specializing in the electronics and semiconductor industry.
Below is the breakup of our primary respondents by company, designation, and region:

Once we receive the confirmation from primary research sources or primary respondents, we finalize the base year market estimation and forecast the data as per the macroeconomic and microeconomic factors assessed during data collection.
- Data Analysis:
Once data is validated through both secondary as well as primary respondents, we finalize the market estimations by hypothesis formulation and factor analysis at regional and country level.
- Macro-Economic Factor Analysis:
We analyse macroeconomic indicators such the gross domestic product (GDP), increase in the demand for goods and services across industries, technological advancement, regional economic growth, governmental policies, the influence of COVID-19, PEST analysis, and other aspects. This analysis aids in setting benchmarks for various nations/regions and approximating market splits. Additionally, the general trend of the aforementioned components aid in determining the market's development possibilities.
- Country Level Data:
Various factors that are especially aligned to the country are taken into account to determine the market size for a certain area and country, including the presence of vendors, such as headquarters and offices, the country's GDP, demand patterns, and industry growth. To comprehend the market dynamics for the nation, a number of growth variables, inhibitors, application areas, and current market trends are researched. The aforementioned elements aid in determining the country's overall market's growth potential.
- Company Profile:
The “Table of Contents” is formulated by listing and analyzing more than 25 - 30 companies operating in the market ecosystem across geographies. However, we profile only 10 companies as a standard practice in our syndicate reports. These 10 companies comprise leading, emerging, and regional players. Nonetheless, our analysis is not restricted to the 10 listed companies, we also analyze other companies present in the market to develop a holistic view and understand the prevailing trends. The “Company Profiles” section in the report covers key facts, business description, products & services, financial information, SWOT analysis, and key developments. The financial information presented is extracted from the annual reports and official documents of the publicly listed companies. Upon collecting the information for the sections of respective companies, we verify them via various primary sources and then compile the data in respective company profiles. The company level information helps us in deriving the base number as well as in forecasting the market size.
- Developing Base Number:
Aggregation of sales statistics (2020-2022) and macro-economic factor, and other secondary and primary research insights are utilized to arrive at base number and related market shares for 2022. The data gaps are identified in this step and relevant market data is analyzed, collected from paid primary interviews or databases. On finalizing the base year market size, forecasts are developed on the basis of macro-economic, industry and market growth factors and company level analysis.
- Data Triangulation and Final Review:
The market findings and base year market size calculations are validated from supply as well as demand side. Demand side validations are based on macro-economic factor analysis and benchmarks for respective regions and countries. In case of supply side validations, revenues of major companies are estimated (in case not available) based on industry benchmark, approximate number of employees, product portfolio, and primary interviews revenues are gathered. Further revenue from target product/service segment is assessed to avoid overshooting of market statistics. In case of heavy deviations between supply and demand side values, all thes steps are repeated to achieve synchronization.
We follow an iterative model, wherein we share our research findings with Subject Matter Experts (SME’s) and Key Opinion Leaders (KOLs) until consensus view of the market is not formulated – this model negates any drastic deviation in the opinions of experts. Only validated and universally acceptable research findings are quoted in our reports.
We have important check points that we use to validate our research findings – which we call – data triangulation, where we validate the information, we generate from secondary sources with primary interviews and then we re-validate with our internal data bases and Subject matter experts. This comprehensive model enables us to deliver high quality, reliable data in shortest possible time.
 このレポートの無料サンプルを入手する