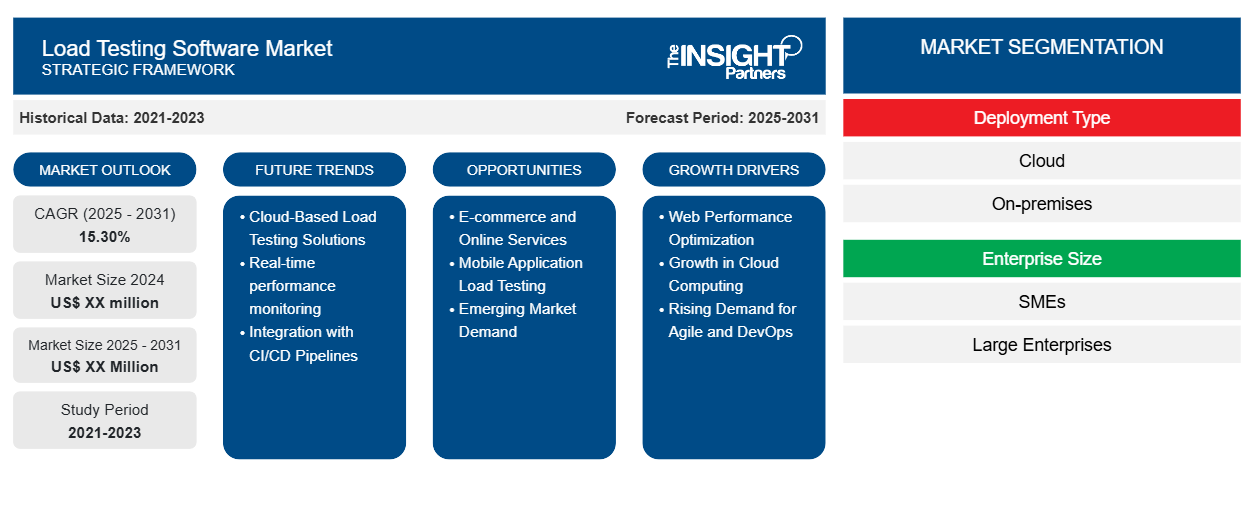
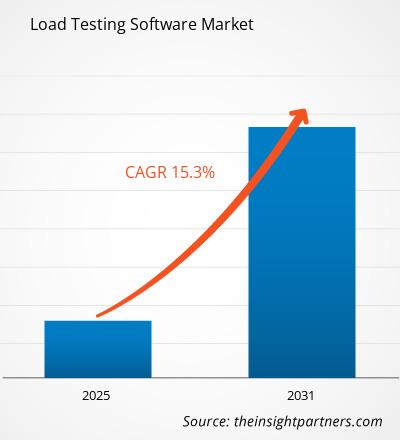
負荷テスト ソフトウェア市場は、2023 年から 2031 年にかけて 15.30% の CAGR を記録し、市場規模は 2023 年の XX 百万米ドルから 2031 年には XX 百万米ドルに拡大すると予想されています。
負荷テスト ソフトウェア市場は、展開タイプによって、クラウド、オンプレミスのサブセグメントに分類されます。さらに、企業規模 (中小企業、大企業) に基づいた分析も提示されます。レポートでは、詳細な競争環境を提供し、戦略、市場シェア、主要企業のポジショニングについて説明しています。グローバル分析は、地域レベルと主要国に分類されています。上記のセグメント分析では、市場評価が US$ で提示されます。
報告書の目的
The Insight Partners による負荷テスト ソフトウェア市場のレポートは、現在の状況と将来の成長、主な推進要因、課題、機会を説明することを目的としています。これにより、次のようなさまざまなビジネス関係者に洞察が提供されます。
- テクノロジープロバイダー/メーカー: 進化する市場の動向を理解し、潜在的な成長機会を把握することで、情報に基づいた戦略的意思決定が可能になります。
- 投資家: 市場の成長率、市場の財務予測、バリュー チェーン全体に存在する機会に関する包括的な傾向分析を実施します。
- 規制機関: 市場の濫用を最小限に抑え、投資家の信用と信頼を維持し、市場の完全性と安定性を維持することを目的として、市場における政策と警察活動を規制します。
負荷テストソフトウェア市場のセグメンテーション
展開タイプ
- 雲
- オンプレミス
企業規模
- 中小企業
- 大企業
要件に合わせてレポートをカスタマイズする
このレポートの一部、国レベルの分析、Excelデータパックなど、あらゆるレポートを無料でカスタマイズできます。また、スタートアップや大学向けのお得なオファーや割引もご利用いただけます。
負荷テストソフトウェア市場:戦略的洞察
- このレポートの主要な市場動向を入手してください。この無料サンプルには、市場動向から見積もりや予測に至るまでのデータ分析が含まれます。
負荷テストソフトウェア市場の成長要因
- Web パフォーマンスの最適化: ウェブサイトの需要が高まっているため、ウェブサイトのパフォーマンスを最適化する時期が来ています。オンライン トラフィックの増加に伴い、ウェブサイトとアプリケーションがパフォーマンスを低下させることなく大量のユーザー トラフィックを処理できるように、負荷テストの急増が必要です。
- クラウド コンピューティングの成長: クラウド テクノロジーの急速な導入により、クラウドベースのアプリケーションとサービスのスケーラビリティ、パフォーマンス、容量を評価する負荷テストの必要性が生じています。
- アジャイルと DevOps の需要の高まり: DevOps プラクティスを使用したアジャイル開発では継続的な統合とテストが実現されるため、アジャイルと DevOps の方法論に対する需要により、自動負荷テスト ツールの使用が促進されます。
負荷テストソフトウェア市場の将来動向
- クラウドベースの負荷テスト ソリューション: クラウドベースの負荷テスト ソリューションは、スケーラビリティと柔軟性を提供し、複雑なアプリケーションや Web サイトの管理コストを削減できるため、多くの組織がクラウドベースの負荷テスト ソリューションを選択するようになっています。
- リアルタイム パフォーマンス監視: リアルタイム パフォーマンス監視と負荷テストは、ビジネス実行に関するリアルタイムの知識の獲得や、エンド ユーザーに影響が及ぶ前にパフォーマンスのボトルネックの検出へと進んでいます。
- CI/CD パイプラインとの統合: 継続的インテグレーションと継続的デプロイメントによる負荷テストと CI/CD パイプラインの統合は一般的な方法となり、開発ソフトウェアのライフサイクル全体にわたってパフォーマンス テストが可能になります。
負荷テストソフトウェアの市場機会
- 電子商取引とオンライン サービス: 電子商取引プラットフォームとサービス プロバイダーが積極的に拡大しているため、負荷テスト ソフトウェアが広く利用できる非常に幅広い分野になります。
- モバイル アプリケーションの負荷テスト: モバイル アプリは日々普及しています。そのため、アプリケーションのスケーラビリティとパフォーマンスを保証する適切な負荷で負荷をテストする必要がある負荷テストのニーズが高まっています。
- 新興市場の需要: 新興市場の需要は、急速なデジタル変革率とインターネット普及率の増加により、この新しい市場の負荷テスト ソフトウェア プロバイダーに多大な成長の機会をもたらします。
負荷テスト ソフトウェア市場の地域別分析
予測期間を通じて負荷テスト ソフトウェア市場に影響を与える地域的な傾向と要因は、Insight Partners のアナリストによって徹底的に説明されています。このセクションでは、北米、ヨーロッパ、アジア太平洋、中東およびアフリカ、南米および中米にわたる負荷テスト ソフトウェア市場のセグメントと地域についても説明します。
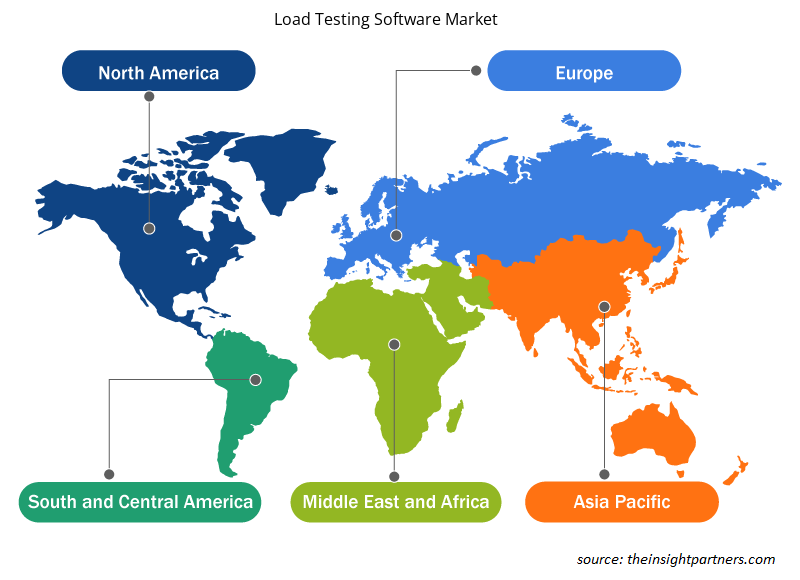
- 負荷テストソフトウェア市場の地域別データを入手
負荷テストソフトウェア市場レポートの範囲
| レポート属性 | 詳細 |
|---|---|
| 2024年の市場規模 | XX百万米ドル |
| 2031年までの市場規模 | XX百万米ドル |
| 世界のCAGR(2024年 - 2031年) | 15.30% |
| 履歴データ | 2021-2023 |
| 予測期間 | 2025-2031 |
| 対象セグメント | 展開タイプ別
|
| 対象地域と国 | 北米
|
| 市場リーダーと主要企業プロフィール |
|
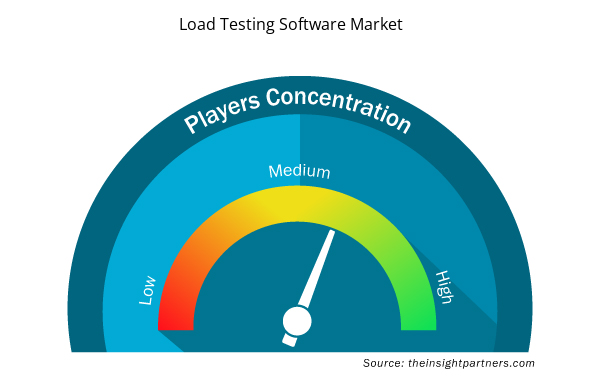
負荷テストソフトウェア市場のプレーヤー密度:ビジネスダイナミクスへの影響を理解する
負荷テスト ソフトウェア市場は、消費者の嗜好の変化、技術の進歩、製品の利点に対する認識の高まりなどの要因により、エンド ユーザーの需要が高まり、急速に成長しています。需要が高まるにつれて、企業は提供内容を拡大し、消費者のニーズを満たすために革新し、新たなトレンドを活用し、市場の成長をさらに促進しています。
市場プレーヤー密度とは、特定の市場または業界内で活動している企業または会社の分布を指します。これは、特定の市場スペースに、その市場規模または総市場価値に対してどれだけの競合相手 (市場プレーヤー) が存在するかを示します。
負荷テスト ソフトウェア市場で事業を展開している主要企業は次のとおりです。
- オートマイ株式会社
- ブロードコム株式会社
- ドットコムモニター株式会社
- ロードインパクトAB
- マイクロフォーカスインターナショナル
免責事項:上記の企業は、特定の順序でランク付けされていません。
- 負荷テストソフトウェア市場のトップキープレーヤーの概要を入手
主なセールスポイント
- 包括的なカバレッジ: レポートでは、負荷テスト ソフトウェア市場の製品、サービス、タイプ、エンド ユーザーの分析を包括的にカバーし、全体的な展望を提供します。
- 専門家による分析: レポートは、業界の専門家とアナリストの深い理解に基づいてまとめられています。
- 最新情報: このレポートは、最新の情報とデータの傾向を網羅しているため、ビジネスの関連性を保証します。
- カスタマイズ オプション: このレポートは、特定のクライアント要件に対応し、ビジネス戦略に適切に適合するようにカスタマイズできます。
したがって、負荷テスト ソフトウェア市場に関する調査レポートは、業界のシナリオと成長の見通しを解読して理解する道の先導役となることができます。いくつかの正当な懸念事項があるかもしれませんが、このレポートの全体的な利点は欠点を上回る傾向があります。
- 過去2年間の分析、基準年、CAGRによる予測(7年間)
- PEST分析とSWOT分析
- 市場規模価値/数量 - 世界、地域、国
- 業界と競争環境
- Excel データセット

Report Coverage
Revenue forecast, Company Analysis, Industry landscape, Growth factors, and Trends

Segment Covered
This text is related
to segments covered.

Regional Scope
North America, Europe, Asia Pacific, Middle East & Africa, South & Central America

Country Scope
This text is related
to country scope.
よくある質問
Some of the customization options available based on request are additional 3-5 company profiles and country-specific analysis of 3-5 countries of your choice. Customizations are to be requested/discussed before making final order confirmation, as our team would review the same and check the feasibility.
The key players in the market are Automai Corporation, Broadcom Inc., Dotcom-Monitor, Inc., Load Impact AB, Micro Focus International plc, NEOTYS S.A.S, Progress Software Corporation, RadView Software Ltd., SmartBear Software, Inc., Tricentis APAC Pty Ltd,
Future trends in the market include the integration of AI and machine learning to automate testing processes, the rise of cloud-based load testing solutions, and the adoption of DevOps and continuous testing approaches to improve software reliability.
The market is expected to register a CAGR of 15.30% during 2021-2031.
The market growth is fuelled by the rise in digital transformation initiatives, the growing complexity of applications, and the need for companies to ensure their websites and applications can handle large volumes of traffic without compromising performance.
The report can be delivered in PDF/PPT format; we can also share excel dataset based on the request.
Trends and growth analysis reports related to Technology, Media and Telecommunications : READ MORE..
1. Automai Corporation
2. Broadcom Inc.
3. Dotcom-Monitor, Inc.
4. Load Impact AB
5. Micro Focus International plc
6. NEOTYS S.A.S
7. Progress Software Corporation
8. RadView Software Ltd.
9. SmartBear Software, Inc.
10. Tricentis APAC Pty Ltd.
The Insight Partners performs research in 4 major stages: Data Collection & Secondary Research, Primary Research, Data Analysis and Data Triangulation & Final Review.
- Data Collection and Secondary Research:
As a market research and consulting firm operating from a decade, we have published and advised several client across the globe. First step for any study will start with an assessment of currently available data and insights from existing reports. Further, historical and current market information is collected from Investor Presentations, Annual Reports, SEC Filings, etc., and other information related to company’s performance and market positioning are gathered from Paid Databases (Factiva, Hoovers, and Reuters) and various other publications available in public domain.
Several associations trade associates, technical forums, institutes, societies and organization are accessed to gain technical as well as market related insights through their publications such as research papers, blogs and press releases related to the studies are referred to get cues about the market. Further, white papers, journals, magazines, and other news articles published in last 3 years are scrutinized and analyzed to understand the current market trends.
- Primary Research:
The primarily interview analysis comprise of data obtained from industry participants interview and answers to survey questions gathered by in-house primary team.
For primary research, interviews are conducted with industry experts/CEOs/Marketing Managers/VPs/Subject Matter Experts from both demand and supply side to get a 360-degree view of the market. The primary team conducts several interviews based on the complexity of the markets to understand the various market trends and dynamics which makes research more credible and precise.
A typical research interview fulfils the following functions:
- Provides first-hand information on the market size, market trends, growth trends, competitive landscape, and outlook
- Validates and strengthens in-house secondary research findings
- Develops the analysis team’s expertise and market understanding
Primary research involves email interactions and telephone interviews for each market, category, segment, and sub-segment across geographies. The participants who typically take part in such a process include, but are not limited to:
- Industry participants: VPs, business development managers, market intelligence managers and national sales managers
- Outside experts: Valuation experts, research analysts and key opinion leaders specializing in the electronics and semiconductor industry.
Below is the breakup of our primary respondents by company, designation, and region:

Once we receive the confirmation from primary research sources or primary respondents, we finalize the base year market estimation and forecast the data as per the macroeconomic and microeconomic factors assessed during data collection.
- Data Analysis:
Once data is validated through both secondary as well as primary respondents, we finalize the market estimations by hypothesis formulation and factor analysis at regional and country level.
- Macro-Economic Factor Analysis:
We analyse macroeconomic indicators such the gross domestic product (GDP), increase in the demand for goods and services across industries, technological advancement, regional economic growth, governmental policies, the influence of COVID-19, PEST analysis, and other aspects. This analysis aids in setting benchmarks for various nations/regions and approximating market splits. Additionally, the general trend of the aforementioned components aid in determining the market's development possibilities.
- Country Level Data:
Various factors that are especially aligned to the country are taken into account to determine the market size for a certain area and country, including the presence of vendors, such as headquarters and offices, the country's GDP, demand patterns, and industry growth. To comprehend the market dynamics for the nation, a number of growth variables, inhibitors, application areas, and current market trends are researched. The aforementioned elements aid in determining the country's overall market's growth potential.
- Company Profile:
The “Table of Contents” is formulated by listing and analyzing more than 25 - 30 companies operating in the market ecosystem across geographies. However, we profile only 10 companies as a standard practice in our syndicate reports. These 10 companies comprise leading, emerging, and regional players. Nonetheless, our analysis is not restricted to the 10 listed companies, we also analyze other companies present in the market to develop a holistic view and understand the prevailing trends. The “Company Profiles” section in the report covers key facts, business description, products & services, financial information, SWOT analysis, and key developments. The financial information presented is extracted from the annual reports and official documents of the publicly listed companies. Upon collecting the information for the sections of respective companies, we verify them via various primary sources and then compile the data in respective company profiles. The company level information helps us in deriving the base number as well as in forecasting the market size.
- Developing Base Number:
Aggregation of sales statistics (2020-2022) and macro-economic factor, and other secondary and primary research insights are utilized to arrive at base number and related market shares for 2022. The data gaps are identified in this step and relevant market data is analyzed, collected from paid primary interviews or databases. On finalizing the base year market size, forecasts are developed on the basis of macro-economic, industry and market growth factors and company level analysis.
- Data Triangulation and Final Review:
The market findings and base year market size calculations are validated from supply as well as demand side. Demand side validations are based on macro-economic factor analysis and benchmarks for respective regions and countries. In case of supply side validations, revenues of major companies are estimated (in case not available) based on industry benchmark, approximate number of employees, product portfolio, and primary interviews revenues are gathered. Further revenue from target product/service segment is assessed to avoid overshooting of market statistics. In case of heavy deviations between supply and demand side values, all thes steps are repeated to achieve synchronization.
We follow an iterative model, wherein we share our research findings with Subject Matter Experts (SME’s) and Key Opinion Leaders (KOLs) until consensus view of the market is not formulated – this model negates any drastic deviation in the opinions of experts. Only validated and universally acceptable research findings are quoted in our reports.
We have important check points that we use to validate our research findings – which we call – data triangulation, where we validate the information, we generate from secondary sources with primary interviews and then we re-validate with our internal data bases and Subject matter experts. This comprehensive model enables us to deliver high quality, reliable data in shortest possible time.
 このレポートの無料サンプルを入手する