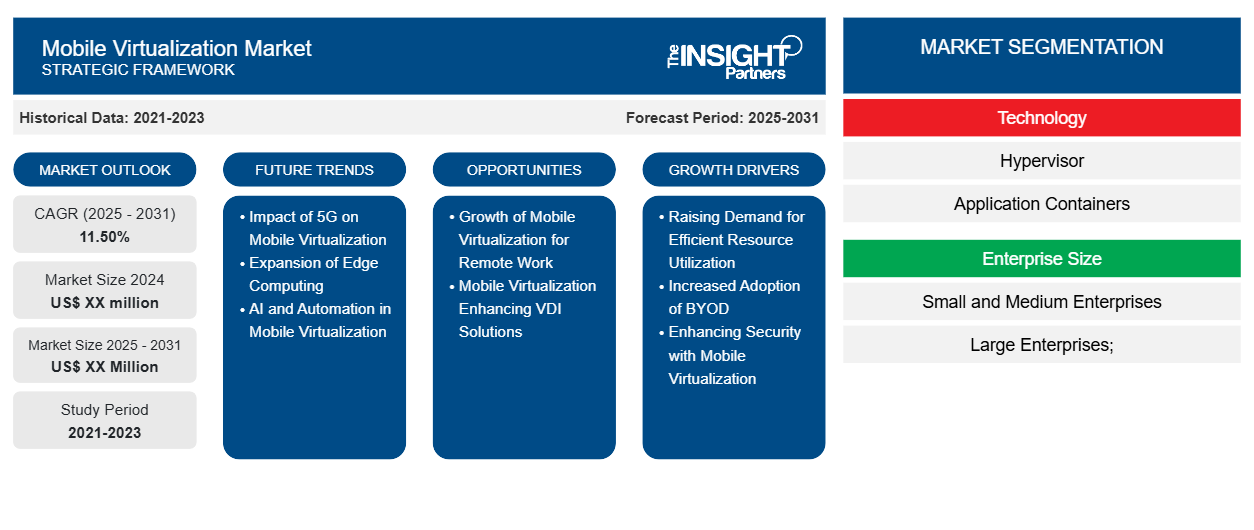
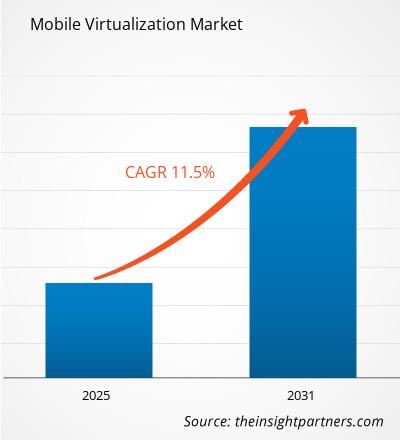
モバイル仮想化市場は、2024年から2031年にかけて11.50%のCAGRで成長すると予想されており、市場規模は2024年のXX百万米ドルから2031年にはXX百万米ドルに拡大する見込みです。
モバイル仮想化市場レポートは、テクノロジー、企業規模、業種、地域別の分析を網羅しています。レポートでは、上記の分析とセグメントの価値を米ドルで提供しています。
報告書の目的
The Insight Partners によるモバイル仮想化市場のレポートは、現在の状況と将来の成長、主な推進要因、課題、機会を説明することを目的としています。これにより、次のようなさまざまなビジネス関係者に洞察が提供されます。
- テクノロジープロバイダー/メーカー: 進化する市場の動向を理解し、潜在的な成長機会を把握することで、情報に基づいた戦略的意思決定が可能になります。
- 投資家: 市場の成長率、市場の財務予測、バリュー チェーン全体に存在する機会に関する包括的な傾向分析を実施します。
- 規制機関: 市場の濫用を最小限に抑え、投資家の信用と信頼を維持し、市場の完全性と安定性を維持することを目的として、市場における政策と警察活動を規制します。
モバイル仮想化市場のセグメンテーション
テクノロジー
- ハイパーバイザー
- アプリケーションコンテナ
企業規模
- 中小企業
- 大企業;
業界別
- 英国
- ITおよび通信
- 建設・製造
- 健康管理
- 公共部門
- 小売り
- 教育
- その他
地理
- 北米
- ヨーロッパ
- アジア太平洋
- 南米と中央アメリカ
- 中東およびアフリカ
要件に合わせてレポートをカスタマイズする
このレポートの一部、国レベルの分析、Excelデータパックなど、あらゆるレポートを無料でカスタマイズできます。また、スタートアップや大学向けのお得なオファーや割引もご利用いただけます。
モバイル仮想化市場:戦略的洞察
- このレポートの主要な市場動向を入手してください。この無料サンプルには、市場動向から見積もりや予測に至るまでのデータ分析が含まれます。
モバイル仮想化市場の成長要因
- 効率的なリソース利用の需要の高まり: 組織は IT インフラストラクチャを最大限に活用したいと考えています。この特定のモバイル仮想化により、ハードウェア リソースを適切に利用できるようになるため、コストが削減され、さまざまな操作の効率が向上します。このモバイル仮想化ソリューションは、さまざまな分野で採用されています。
- BYOD の採用の増加: 職場内での BYOD ポリシーの採用が増加する傾向が続いており、そのため、完全に機能するモバイル仮想化ソリューションが求められています。企業は、企業データを維持または制御しながら、従業員が個人のデバイスを使用できるようにする必要があるため、仮想化は、ワークスペースと個人の環境を適切に管理および差別化するための必須ツールになります。
- モバイル仮想化によるセキュリティの強化: 企業のアプリケーションとデータを個人の使用から分離することで、セキュリティが向上します。組織がコンプライアンス要件を満たすのに役立ち、仮想化ソリューションの需要が高まり、モバイルのセキュリティに対する関心も高まる可能性があります。
モバイル仮想化市場の将来動向
- 5G のモバイル仮想化への影響: 5G ネットワークの展開中、モバイル仮想化市場は大きな影響を受ける可能性があります。この技術により、モバイル ユーザーへのデータ転送速度と接続性が向上するためです。モバイル仮想環境のエクスペリエンスがこのように向上すると、モバイル仮想化ソリューションの採用率が上がり、5G 技術が提供する機能を最大限に活用できるようになります。
- エッジ コンピューティングの拡張: エッジ コンピューティングが普及し始めると、モバイル仮想化が強化され、コンピューティングの分散環境に対応できるようになります。
- モバイル仮想化における AI と自動化: モバイル仮想化プラットフォームにおける AI と自動化により、よりスマートなリソースの使用と優れたユーザー エクスペリエンスが実現します。分析と AI を組み合わせることで、仮想環境のプロアクティブな監視と最適化が可能になり、企業は絶えず変化する需要やセキュリティの脅威に効果的に対応できるようになります。
モバイル仮想化市場の機会
- リモート ワーク向けモバイル仮想化の拡大: リモート ワークは、その市場向けの特定のソリューションを設計できるモバイル仮想化プロバイダーにとって、増加傾向にあります。企業が進化のプロセスを経て、従業員がモバイル デバイスを使用して会社のアプリケーションやリソースにアクセスできる柔軟な勤務形態を提供し始めると、それが成長への道となります。
- モバイル仮想化による VDI ソリューションの強化: リモートからアプリケーションにアクセスするために VDI ソリューションを採用する組織が増えているため、モバイル仮想化によってそのソリューションを強化する絶好の機会が生まれています。ベンダーは、モバイル デバイス向けに最適化されたバージョンの VDI でユーザーにシームレスな操作性を提供でき、その結果、業界全体での採用が拡大します。
モバイル仮想化市場の地域別分析
予測期間を通じてモバイル仮想化市場に影響を与える地域的な傾向と要因は、Insight Partners のアナリストによって徹底的に説明されています。このセクションでは、北米、ヨーロッパ、アジア太平洋、中東およびアフリカ、南米および中米にわたるモバイル仮想化市場のセグメントと地理についても説明します。
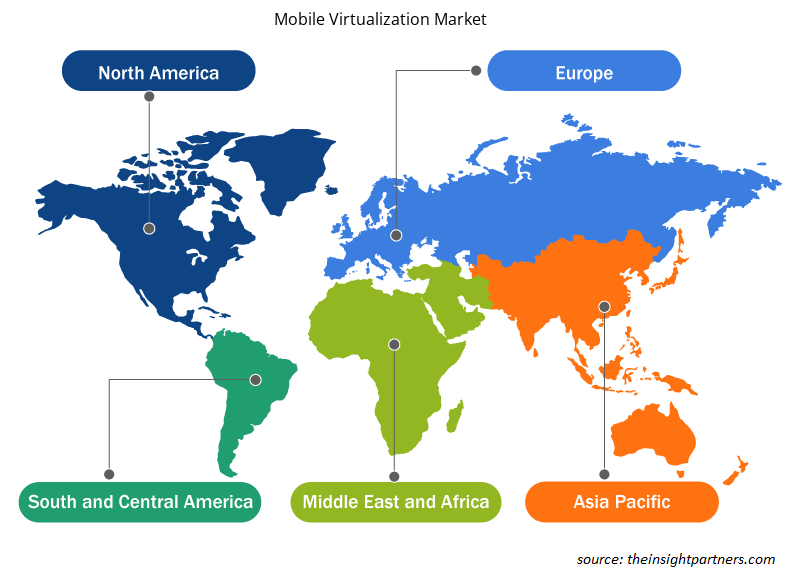
- モバイル仮想化市場の地域別データを入手
モバイル仮想化市場レポートの範囲
| レポート属性 | 詳細 |
|---|---|
| 2024年の市場規模 | XX百万米ドル |
| 2031年までの市場規模 | XX百万米ドル |
| 世界のCAGR(2025年~2031年) | 11.50% |
| 履歴データ | 2021-2023 |
| 予測期間 | 2025-2031 |
| 対象セグメント | テクノロジー別
|
| 対象地域と国 | 北米
|
| 市場リーダーと主要企業プロフィール |
|
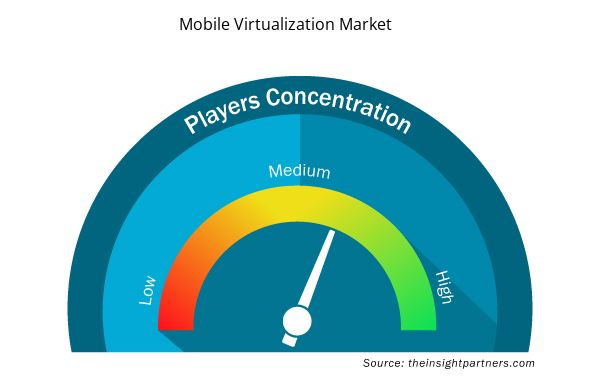
モバイル仮想化市場のプレーヤー密度: ビジネスダイナミクスへの影響を理解する
モバイル仮想化市場は、消費者の嗜好の変化、技術の進歩、製品の利点に対する認識の高まりなどの要因により、エンドユーザーの需要が高まり、急速に成長しています。需要が高まるにつれて、企業は提供内容を拡大し、消費者のニーズを満たすために革新を起こし、新たなトレンドを活用し、市場の成長をさらに促進しています。
市場プレーヤー密度とは、特定の市場または業界内で活動している企業または会社の分布を指します。これは、特定の市場スペースに、その市場規模または総市場価値に対してどれだけの競合相手 (市場プレーヤー) が存在するかを示します。
モバイル仮想化市場で事業を展開している主要企業は次のとおりです。
- ブロードコム
- セルロックス株式会社
- シトリックスシステムズ株式会社
- IBM
- インテルコーポレーション
免責事項:上記の企業は、特定の順序でランク付けされていません。
- モバイル仮想化市場のトップキープレーヤーの概要を入手
主なセールスポイント
- 包括的なカバレッジ: レポートでは、モバイル仮想化市場の製品、サービス、タイプ、エンドユーザーの分析を包括的にカバーし、全体的な展望を提供します。
- 専門家による分析: レポートは、業界の専門家とアナリストの深い理解に基づいてまとめられています。
- 最新情報: このレポートは、最新の情報とデータの傾向を網羅しているため、ビジネスの関連性を保証します。
- カスタマイズ オプション: このレポートは、特定のクライアント要件に対応し、ビジネス戦略に適切に適合するようにカスタマイズできます。
したがって、モバイル仮想化市場に関する調査レポートは、業界のシナリオと成長の見通しを解読し理解する道の先導役となることができます。正当な懸念事項がいくつかあるかもしれませんが、このレポートの全体的な利点は欠点を上回る傾向があります。
- 過去2年間の分析、基準年、CAGRによる予測(7年間)
- PEST分析とSWOT分析
- 市場規模価値/数量 - 世界、地域、国
- 業界と競争環境
- Excel データセット

Report Coverage
Revenue forecast, Company Analysis, Industry landscape, Growth factors, and Trends

Segment Covered
This text is related
to segments covered.

Regional Scope
North America, Europe, Asia Pacific, Middle East & Africa, South & Central America

Country Scope
This text is related
to country scope.
よくある質問
The report can be delivered in PDF/PPT format; we can also share excel dataset based on the request.
Some of the customization options available based on request are additional 3-5 company profiles and country-specific analysis of 3-5 countries of your choice. Customizations are to be requested/discussed before making final order confirmation, as our team would review the same and check the feasibility.
Key companies in this market are: Broadcom, Cellrox Ltd., Citrix Systems, Inc., IBM, Intel Corporation, Microsoft, Oracle, Samsung, VMware, Inc.
The Mobile Virtualization Market is expected to register a CAGR of 11.50% from 2023-2031.
Key future trends in this market are - AI and ML revolutionizing data analysis accuracy and speed in the mobile mapping industry, the rise of cloud-based mapping solutions for scalable geospatial data storage and real-time collaboration, and 5G integration in mobile mapping systems for high-density data processing, impacting geospatially dependent industries.
The primary driving factors of the market are - Demand for Efficient Resource Utilization, Increased Adoption of BYOD, and improved security.
Trends and growth analysis reports related to Technology, Media and Telecommunications : READ MORE..
1.Broadcom
2.Cellrox ltd.
3.Citrix Systems, Inc.
4.IBM
5.Intel Corporation
6.Microsoft
7.Oracle
8.Samsung
9.VMware, Inc.
10.Toshiba Corporation
The Insight Partners performs research in 4 major stages: Data Collection & Secondary Research, Primary Research, Data Analysis and Data Triangulation & Final Review.
- Data Collection and Secondary Research:
As a market research and consulting firm operating from a decade, we have published and advised several client across the globe. First step for any study will start with an assessment of currently available data and insights from existing reports. Further, historical and current market information is collected from Investor Presentations, Annual Reports, SEC Filings, etc., and other information related to company’s performance and market positioning are gathered from Paid Databases (Factiva, Hoovers, and Reuters) and various other publications available in public domain.
Several associations trade associates, technical forums, institutes, societies and organization are accessed to gain technical as well as market related insights through their publications such as research papers, blogs and press releases related to the studies are referred to get cues about the market. Further, white papers, journals, magazines, and other news articles published in last 3 years are scrutinized and analyzed to understand the current market trends.
- Primary Research:
The primarily interview analysis comprise of data obtained from industry participants interview and answers to survey questions gathered by in-house primary team.
For primary research, interviews are conducted with industry experts/CEOs/Marketing Managers/VPs/Subject Matter Experts from both demand and supply side to get a 360-degree view of the market. The primary team conducts several interviews based on the complexity of the markets to understand the various market trends and dynamics which makes research more credible and precise.
A typical research interview fulfils the following functions:
- Provides first-hand information on the market size, market trends, growth trends, competitive landscape, and outlook
- Validates and strengthens in-house secondary research findings
- Develops the analysis team’s expertise and market understanding
Primary research involves email interactions and telephone interviews for each market, category, segment, and sub-segment across geographies. The participants who typically take part in such a process include, but are not limited to:
- Industry participants: VPs, business development managers, market intelligence managers and national sales managers
- Outside experts: Valuation experts, research analysts and key opinion leaders specializing in the electronics and semiconductor industry.
Below is the breakup of our primary respondents by company, designation, and region:

Once we receive the confirmation from primary research sources or primary respondents, we finalize the base year market estimation and forecast the data as per the macroeconomic and microeconomic factors assessed during data collection.
- Data Analysis:
Once data is validated through both secondary as well as primary respondents, we finalize the market estimations by hypothesis formulation and factor analysis at regional and country level.
- Macro-Economic Factor Analysis:
We analyse macroeconomic indicators such the gross domestic product (GDP), increase in the demand for goods and services across industries, technological advancement, regional economic growth, governmental policies, the influence of COVID-19, PEST analysis, and other aspects. This analysis aids in setting benchmarks for various nations/regions and approximating market splits. Additionally, the general trend of the aforementioned components aid in determining the market's development possibilities.
- Country Level Data:
Various factors that are especially aligned to the country are taken into account to determine the market size for a certain area and country, including the presence of vendors, such as headquarters and offices, the country's GDP, demand patterns, and industry growth. To comprehend the market dynamics for the nation, a number of growth variables, inhibitors, application areas, and current market trends are researched. The aforementioned elements aid in determining the country's overall market's growth potential.
- Company Profile:
The “Table of Contents” is formulated by listing and analyzing more than 25 - 30 companies operating in the market ecosystem across geographies. However, we profile only 10 companies as a standard practice in our syndicate reports. These 10 companies comprise leading, emerging, and regional players. Nonetheless, our analysis is not restricted to the 10 listed companies, we also analyze other companies present in the market to develop a holistic view and understand the prevailing trends. The “Company Profiles” section in the report covers key facts, business description, products & services, financial information, SWOT analysis, and key developments. The financial information presented is extracted from the annual reports and official documents of the publicly listed companies. Upon collecting the information for the sections of respective companies, we verify them via various primary sources and then compile the data in respective company profiles. The company level information helps us in deriving the base number as well as in forecasting the market size.
- Developing Base Number:
Aggregation of sales statistics (2020-2022) and macro-economic factor, and other secondary and primary research insights are utilized to arrive at base number and related market shares for 2022. The data gaps are identified in this step and relevant market data is analyzed, collected from paid primary interviews or databases. On finalizing the base year market size, forecasts are developed on the basis of macro-economic, industry and market growth factors and company level analysis.
- Data Triangulation and Final Review:
The market findings and base year market size calculations are validated from supply as well as demand side. Demand side validations are based on macro-economic factor analysis and benchmarks for respective regions and countries. In case of supply side validations, revenues of major companies are estimated (in case not available) based on industry benchmark, approximate number of employees, product portfolio, and primary interviews revenues are gathered. Further revenue from target product/service segment is assessed to avoid overshooting of market statistics. In case of heavy deviations between supply and demand side values, all thes steps are repeated to achieve synchronization.
We follow an iterative model, wherein we share our research findings with Subject Matter Experts (SME’s) and Key Opinion Leaders (KOLs) until consensus view of the market is not formulated – this model negates any drastic deviation in the opinions of experts. Only validated and universally acceptable research findings are quoted in our reports.
We have important check points that we use to validate our research findings – which we call – data triangulation, where we validate the information, we generate from secondary sources with primary interviews and then we re-validate with our internal data bases and Subject matter experts. This comprehensive model enables us to deliver high quality, reliable data in shortest possible time.
 このレポートの無料サンプルを入手する