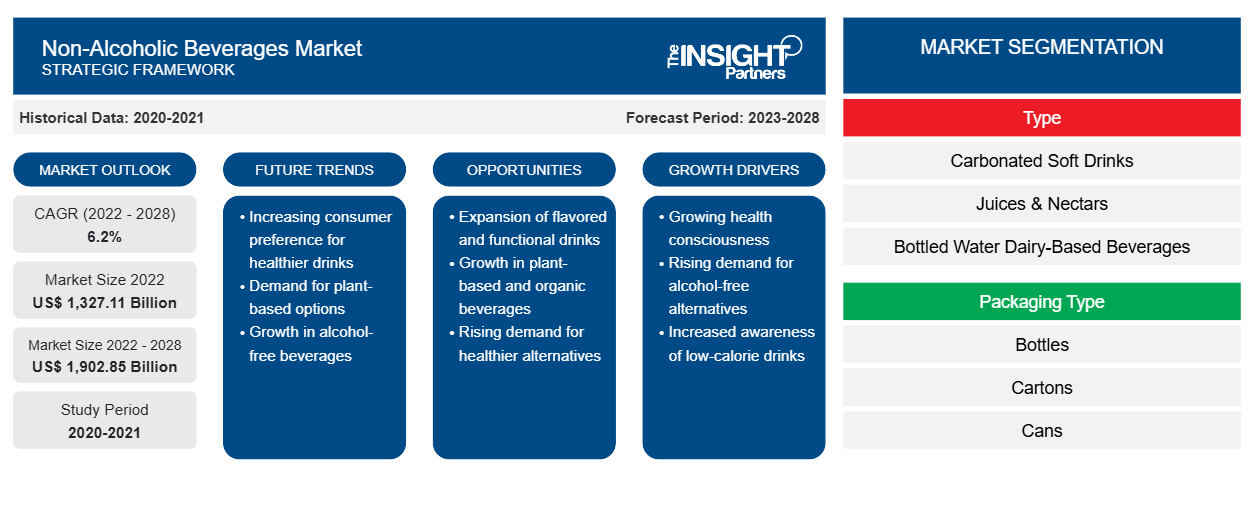
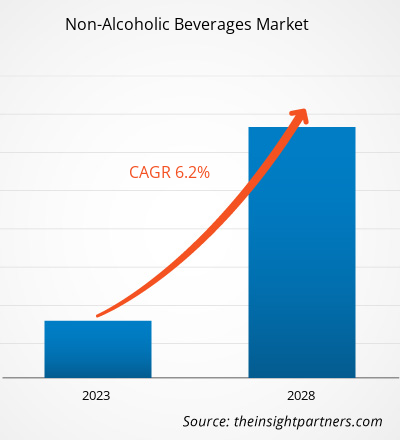
ノンアルコール飲料の市場規模は、2022年の1兆3,271億1,000万米ドルから2028年には1兆9,028億5,000万米ドルに成長すると予想されています。2022年から2028年にかけて6.2%のCAGRで成長すると予測されています。
炭酸飲料、ボトル入り飲料水、ジュースやネクター、乳製品ベースおよび乳製品代替飲料、RTD ティーとコーヒー、エナジードリンクは、市場で入手可能なさまざまな種類のノンアルコール飲料です。世界中のさまざまな国で健康への関心が高まり、肥満、糖尿病、心臓病の有病率が高いため、無糖カテゴリは消費者の間で大きな注目を集めています。健康と栄養への関心が高まっているため、機能性飲料と強化飲料の需要が高まっています。アルコール飲料の消費に関する厳しい規制と、麦芽飲料がハラール認証を取得していることから、サウジアラビア、イラン、UAE などの中東諸国では、ノンアルコール麦芽飲料とプレミックスが広く消費されています。この要因により、世界のノンアルコール飲料市場におけるノンアルコール麦芽飲料セグメントの成長が促進されています。
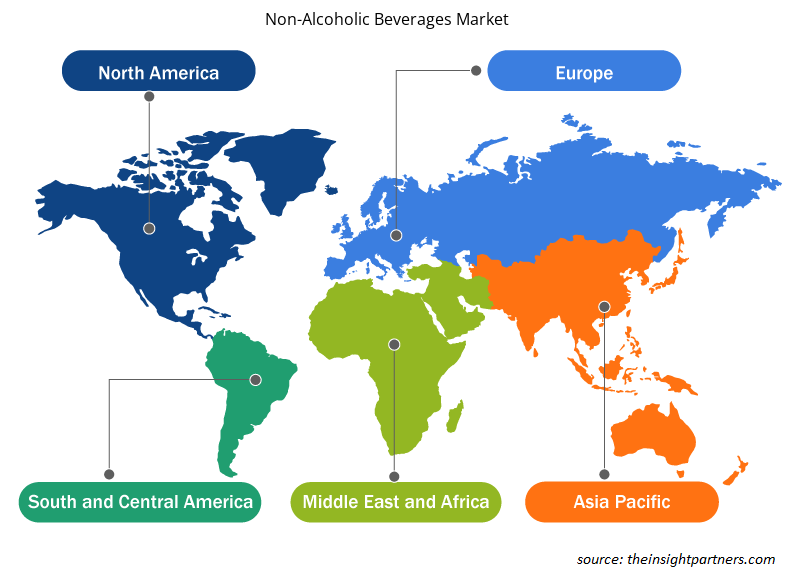
2021年、アジア太平洋地域は世界のノンアルコール飲料市場で最大の収益シェアを占めました。アジア太平洋地域の市場を牽引する主な要因は、消費者の健康意識の高まり、代替乳製品飲料への高い需要、天然およびオーガニックフルーツジュースの人気の高まりです。日本や韓国などの国では、人口の大多数が乳糖不耐症です。この要因により、これらの国では乳製品代替飲料の人気が高まっています。さらに、アジア太平洋地域のノンアルコール飲料市場は、潜在的な消費者層の存在、健康的な飲料への強い需要、広範な小売環境により、収益性が高くなっています。NOLO(ノンアルコール/低アルコールビール、スピリッツ、カクテル)カテゴリーは、消費習慣の変化と健康的な食事と飲酒への消費者の関心の高まりにより、アジア太平洋地域で大きな需要を経験しています。そのため、ノンアルコールまたは低アルコールのビールやスピリッツを提供する多くの新興企業が、アジア太平洋地域全体に拠点を拡大しています。たとえば、ノンアルコールビール、スピリッツ、ワインのオンラインショッピングプラットフォームであるSipfreeは、2020年1月に香港で開始され、COVID-19の流行にもかかわらず、Sipfreeの売上は大幅に増加しました。このような拡大により、予測期間中のアジア太平洋地域のノンアルコール飲料市場の成長において有利な機会が生まれることが期待されます。
要件に合わせてレポートをカスタマイズする
このレポートの一部、国レベルの分析、Excelデータパックなど、あらゆるレポートを無料でカスタマイズできます。また、スタートアップや大学向けのお得なオファーや割引もご利用いただけます。
- このレポートの主要な市場動向を入手してください。この無料サンプルには、市場動向から見積もりや予測に至るまでのデータ分析が含まれます。
COVID-19パンデミックによるノンアルコール飲料市場への影響
パンデミック前の時期、ノンアルコール飲料市場は主に健康飲料や外出先で飲む飲料の需要の高さに牽引されていました。しかし、2020年のCOVID-19の流行により、多くの業界が前例のない課題に直面しました。食品・飲料メーカーは、製造ユニットの閉鎖やサプライチェーンの混乱により、パンデミックの初期段階では成長が鈍化しました。しかし、消費者のライフスタイルの変化、健康的な食生活への嗜好の高まり、健康志向の人口の増加により、ノンアルコール飲料の需要が大幅に促進されました。消費者は植物ベースの飲料が従来のものよりも栄養価が高いと考えているため、大豆、アーモンド、ココナッツミルクなどの植物ベースの飲料の需要はパンデミック後に2倍に増加しました。2020年6月に発表されたミンテルのレポートによると、調査対象となった英国の消費者の25%が、パンデミックによりビーガン食が魅力的に思えることに同意しました。これらの要因は、ノンアルコール飲料市場の成長にプラスの影響を与えました。
健康とウェルネスのトレンドは、COVID-19の発生後に始まりました。消費者は健康を維持するために、ヨガ、ジョギング、サイクリングなどのさまざまなフィットネス活動に取り組んでいます。この要因により、今後数年間、特にエナジードリンクとスポーツドリンクの分野で、ノンアルコール飲料市場に大きな可能性をもたらすことが期待されています。
市場分析
スポーツドリンクの採用急増がノンアルコール飲料市場を牽引
栄養はスポーツパフォーマンスの向上に重要な役割を果たします。アスリートやスポーツ選手は、毎日のエネルギーと栄養素の需要を満たすために適切な栄養を摂取する必要があります。プロのアスリートやスポーツ選手だけでなく、多くの人が健康全般を維持するために日々の身体活動を行っています。近年、健康とウェルネスへの関心の高まりにより、フィットネス愛好家の数が増加しています。スポーツドリンクは、運動や身体活動中に失われた電解質、水分、エネルギーを補給します。これらのドリンクには通常、水分補給、グリコーゲン貯蔵の補充、運動後の疲労の遅延に役立つ炭水化物、カリウム、ナトリウム、マグネシウム、カルシウムが含まれています。健康とフィットネスへの関心の高まりとスポーツ愛好家の増加は、世界中でスポーツドリンクの販売を促進する主な要因です。したがって、スポーツドリンクの採用の増加は、ノンアルコール飲料市場を大幅に推進しています。
タイプインサイト
タイプに基づいて、世界のノンアルコール飲料市場は、炭酸飲料、ボトル入り飲料水、ジュースとネクター、乳製品ベースの飲料、乳製品代替飲料、RTD紅茶とコーヒー、ノンアルコールビール、麦芽飲料、その他に分類されています。ジュースとネクターセグメントは、スパークリングフルーツジュースとその他にさらに細分化されています。炭酸飲料セグメントは、2021年に世界のノンアルコール飲料市場で最大のシェアを占め、乳製品代替飲料セグメントは予測期間中に最速のCAGRで成長すると予想されています。炭酸飲料は、きれいな水、砂糖、天然甘味料または砂糖代替品(ダイエット飲料の場合)、カフェイン、人工香料成分、果汁濃縮物、防腐剤、着色料から作られた発泡性のノンアルコール飲料です。スプライト、コカコーラ、マウンテンデュー、モンスターは、世界的に有名なソフトドリンクブランドの一部です。炭酸飲料は、コンビニエンス ストア、スーパーマーケット、大型スーパーマーケット、自動販売機、映画館、ソーダ ショップ、オンライン小売店などで幅広く販売されています。消費者のライフスタイルの変化、可処分所得の増加、コンビニエンス フードや飲料の需要増加が、炭酸飲料セグメントの市場を牽引しています。
カテゴリーインサイト
カテゴリーに基づいて、世界のノンアルコール飲料市場は、無糖と従来型に分類されています。2021年には、従来型セグメントがより大きな市場シェアを占めました。肥満、糖尿病、高血圧、心血管疾患の増加により、無糖飲料の需要が高まっています。国際糖尿病連合によると、2021年には世界中で約5億3,700万人が糖尿病を患っていました。多くの飲料メーカーは、無糖飲料の需要の高まりに対応するために、天然の低カロリー甘味料を使用した製品を積極的に開発しています。この要因がこのセグメントの市場を牽引しています。
ノンアルコール飲料市場の地域別分析
予測期間を通じてノンアルコール飲料市場に影響を与える地域的な傾向と要因は、Insight Partners のアナリストによって徹底的に説明されています。このセクションでは、北米、ヨーロッパ、アジア太平洋、中東、アフリカ、南米、中米にわたるノンアルコール飲料市場のセグメントと地理についても説明します。

- ノンアルコール飲料市場の地域別データを入手
ノンアルコール飲料市場レポートの範囲
| レポート属性 | 詳細 |
|---|---|
| 2022年の市場規模 | 1兆3,271億1,000万米ドル |
| 2028年までの市場規模 | 1兆9,028億5,000万米ドル |
| 世界のCAGR(2022年 - 2028年) | 6.2% |
| 履歴データ | 2020-2021 |
| 予測期間 | 2023-2028 |
| 対象セグメント | タイプ別
|
| 対象地域と国 | 北米
|
| 市場リーダーと主要企業プロフィール |
|
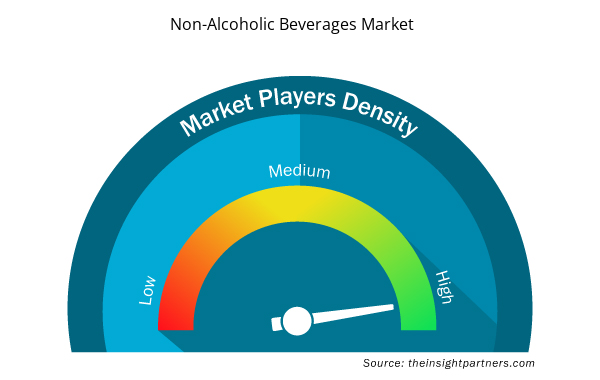
ノンアルコール飲料市場のプレーヤー密度:ビジネスダイナミクスへの影響を理解する
ノンアルコール飲料市場は、消費者の嗜好の変化、技術の進歩、製品の利点に対する認識の高まりなどの要因により、エンドユーザーの需要が高まり、急速に成長しています。需要が高まるにつれて、企業は提供品を拡大し、消費者のニーズを満たすために革新し、新たなトレンドを活用し、市場の成長をさらに促進しています。
市場プレーヤー密度とは、特定の市場または業界内で活動している企業または会社の分布を指します。これは、特定の市場スペースに、その規模または総市場価値と比較して、どれだけの競合相手 (市場プレーヤー) が存在するかを示します。
ノンアルコール飲料市場で事業を展開している主要企業は次のとおりです。
- コカコーラ社
- ペプシコ
- ネスレ
- レッドブル
- サントリーホールディングス株式会社
免責事項:上記の企業は、特定の順序でランク付けされていません。

- ノンアルコール飲料市場のトップキープレーヤーの概要を入手
世界のノンアルコール飲料市場で活動している主要企業には、コカコーラ、ペプシコ、ネスレ、レッドブル、サントリーホールディングス、ダノンSA、カリフィアファームズLLC、キューリグドクターペッパー、アサヒグループホールディングス、ボルトハウスファームズ、ハイネケンNV、クールバーグビバレッジズPvt Ltd、ゴヤフーズ、アンハイザー・ブッシュ・インベブNV、カールスバーグASなどがあります。世界のノンアルコール飲料市場で活動している企業は、変化する消費者のニーズを満たすために、新しいフレーバーのオーガニック、GMOフリー、植物ベース、グルテンフリーの製品を提供することに注力しています。たとえば、2019年にコカコーラユーロパシフィックパートナーズは、オネストオーガニックレモネードシリーズに2種類のスパークリングジュースを発売しました。この製品はオーガニックフルーツジュースと砂糖から製造されており、甘味料や人工香料は含まれていません。このような革新的な製品は消費者の大きな支持を得て、ノンアルコール飲料市場の成長を促進すると予想されます。
レポートの注目点
- ノンアルコール飲料市場における進歩的な業界動向は、プレーヤーが効果的な長期戦略を策定するのに役立ちます。
- 先進国市場と発展途上国市場で採用されているビジネス成長戦略
- 2020年から2028年までのノンアルコール飲料市場の定量分析
- ノンアルコール飲料の世界需要の推定
- 業界で活動するバイヤーとサプライヤーの有効性を示すポーターの5つの力の分析
- 競争市場の状況を理解するための最近の動向
- 市場動向と見通し、およびノンアルコール飲料市場の成長を牽引・抑制する要因
- 商業的利益の基盤となる市場戦略を強調し、市場の成長につながる意思決定プロセスを支援する
- ノンアルコール飲料市場の規模
- 市場の詳細な概要とセグメンテーション、およびノンアルコール飲料業界の動向
- 有望な成長機会のあるさまざまな地域のノンアルコール飲料市場の規模
- 過去2年間の分析、基準年、CAGRによる予測(7年間)
- PEST分析とSWOT分析
- 市場規模価値/数量 - 世界、地域、国
- 業界と競争環境
- Excel データセット


- Piling Machines Market
- Pharmacovigilance and Drug Safety Software Market
- Asset Integrity Management Market
- Rugged Phones Market
- Clinical Trial Supplies Market
- Gas Engine Market
- Analog-to-Digital Converter Market
- Nuclear Decommissioning Services Market
- Cosmetic Bioactive Ingredients Market
- Malaria Treatment Market

Report Coverage
Revenue forecast, Company Analysis, Industry landscape, Growth factors, and Trends

Segment Covered
This text is related
to segments covered.

Regional Scope
North America, Europe, Asia Pacific, Middle East & Africa, South & Central America

Country Scope
This text is related
to country scope.
よくある質問
The major players operating in the global non-alcoholic beverage market are The Coca Cola Company, PepsiCo, Nestle, Red Bull, Suntory Holdings Limited, Danone S.A., Califia Farms LLC, Keurig Dr Pepper Inc, Asahi Group Holdings Limited, Bolthouse Farms Inc., Coolberg Beverages Pvt Ltd, Goya Foods Inc, Anheuser-Busch InBev NV, and Carlsberg AS among others
The beverage manufacturers are rapidly developing innovative products which are opening lucrative opportunities in the non-alcoholic beverage market over the forecast period. For instance, WYNK, a US-based beverage manufacturer offers CBD and THC-infused seltzer in different flavors such as lime, mango, and black cherry. The product contains 2.5 mg of CBD and THC per can which provides relaxing and calming effect.
Based on the application, bottles segment accounted for the largest revenue share as it can ensure extreme product integrity and the supply chain for juices, nectars, isotonic and teas, soft drinks, and liquid dairy products. It is sustainable and helps in optimizing the costs.
The rising health and wellness concerns coupled with rising sober-curious population are driving the demand for non-alcoholic beers.
Rising demand for non-alcoholic beverages with functional benefits, increasing consumption of bottled water, and surging adoption of sports drinks are some of the key driving factors for the non-alcoholic beverage market.
Asia Pacific accounted for the largest share of the global non-alcoholic beverage market due to rising health consciousness, increasing awareness regarding the need for an active lifestyle, and the growing rates of lifestyle diseases inspired health-oriented consumers to opt for healthy and sugar-free drinks.
Trends and growth analysis reports related to Food and Beverages : READ MORE..
The List of Companies - Non-alcoholic Beverages Market
- The Coca Cola Company
- PepsiCo
- Nestle
- Red Bull
- Suntory Holdings Limited
- Danone S.A.
- Califia Farms LLC
- Keurig Dr Pepper Inc
- Asahi Group Holdings Limited
- Bolthouse Farms Inc.
- Heineken NV
- Coolberg Beverages Pvt Ltd
- Goya Foods Inc
- Anheuser-Busch InBev NV
- Carlsberg AS
The Insight Partners performs research in 4 major stages: Data Collection & Secondary Research, Primary Research, Data Analysis and Data Triangulation & Final Review.
- Data Collection and Secondary Research:
As a market research and consulting firm operating from a decade, we have published and advised several client across the globe. First step for any study will start with an assessment of currently available data and insights from existing reports. Further, historical and current market information is collected from Investor Presentations, Annual Reports, SEC Filings, etc., and other information related to company’s performance and market positioning are gathered from Paid Databases (Factiva, Hoovers, and Reuters) and various other publications available in public domain.
Several associations trade associates, technical forums, institutes, societies and organization are accessed to gain technical as well as market related insights through their publications such as research papers, blogs and press releases related to the studies are referred to get cues about the market. Further, white papers, journals, magazines, and other news articles published in last 3 years are scrutinized and analyzed to understand the current market trends.
- Primary Research:
The primarily interview analysis comprise of data obtained from industry participants interview and answers to survey questions gathered by in-house primary team.
For primary research, interviews are conducted with industry experts/CEOs/Marketing Managers/VPs/Subject Matter Experts from both demand and supply side to get a 360-degree view of the market. The primary team conducts several interviews based on the complexity of the markets to understand the various market trends and dynamics which makes research more credible and precise.
A typical research interview fulfils the following functions:
- Provides first-hand information on the market size, market trends, growth trends, competitive landscape, and outlook
- Validates and strengthens in-house secondary research findings
- Develops the analysis team’s expertise and market understanding
Primary research involves email interactions and telephone interviews for each market, category, segment, and sub-segment across geographies. The participants who typically take part in such a process include, but are not limited to:
- Industry participants: VPs, business development managers, market intelligence managers and national sales managers
- Outside experts: Valuation experts, research analysts and key opinion leaders specializing in the electronics and semiconductor industry.
Below is the breakup of our primary respondents by company, designation, and region:

Once we receive the confirmation from primary research sources or primary respondents, we finalize the base year market estimation and forecast the data as per the macroeconomic and microeconomic factors assessed during data collection.
- Data Analysis:
Once data is validated through both secondary as well as primary respondents, we finalize the market estimations by hypothesis formulation and factor analysis at regional and country level.
- Macro-Economic Factor Analysis:
We analyse macroeconomic indicators such the gross domestic product (GDP), increase in the demand for goods and services across industries, technological advancement, regional economic growth, governmental policies, the influence of COVID-19, PEST analysis, and other aspects. This analysis aids in setting benchmarks for various nations/regions and approximating market splits. Additionally, the general trend of the aforementioned components aid in determining the market's development possibilities.
- Country Level Data:
Various factors that are especially aligned to the country are taken into account to determine the market size for a certain area and country, including the presence of vendors, such as headquarters and offices, the country's GDP, demand patterns, and industry growth. To comprehend the market dynamics for the nation, a number of growth variables, inhibitors, application areas, and current market trends are researched. The aforementioned elements aid in determining the country's overall market's growth potential.
- Company Profile:
The “Table of Contents” is formulated by listing and analyzing more than 25 - 30 companies operating in the market ecosystem across geographies. However, we profile only 10 companies as a standard practice in our syndicate reports. These 10 companies comprise leading, emerging, and regional players. Nonetheless, our analysis is not restricted to the 10 listed companies, we also analyze other companies present in the market to develop a holistic view and understand the prevailing trends. The “Company Profiles” section in the report covers key facts, business description, products & services, financial information, SWOT analysis, and key developments. The financial information presented is extracted from the annual reports and official documents of the publicly listed companies. Upon collecting the information for the sections of respective companies, we verify them via various primary sources and then compile the data in respective company profiles. The company level information helps us in deriving the base number as well as in forecasting the market size.
- Developing Base Number:
Aggregation of sales statistics (2020-2022) and macro-economic factor, and other secondary and primary research insights are utilized to arrive at base number and related market shares for 2022. The data gaps are identified in this step and relevant market data is analyzed, collected from paid primary interviews or databases. On finalizing the base year market size, forecasts are developed on the basis of macro-economic, industry and market growth factors and company level analysis.
- Data Triangulation and Final Review:
The market findings and base year market size calculations are validated from supply as well as demand side. Demand side validations are based on macro-economic factor analysis and benchmarks for respective regions and countries. In case of supply side validations, revenues of major companies are estimated (in case not available) based on industry benchmark, approximate number of employees, product portfolio, and primary interviews revenues are gathered. Further revenue from target product/service segment is assessed to avoid overshooting of market statistics. In case of heavy deviations between supply and demand side values, all thes steps are repeated to achieve synchronization.
We follow an iterative model, wherein we share our research findings with Subject Matter Experts (SME’s) and Key Opinion Leaders (KOLs) until consensus view of the market is not formulated – this model negates any drastic deviation in the opinions of experts. Only validated and universally acceptable research findings are quoted in our reports.
We have important check points that we use to validate our research findings – which we call – data triangulation, where we validate the information, we generate from secondary sources with primary interviews and then we re-validate with our internal data bases and Subject matter experts. This comprehensive model enables us to deliver high quality, reliable data in shortest possible time.


 このレポートの無料サンプルを入手する