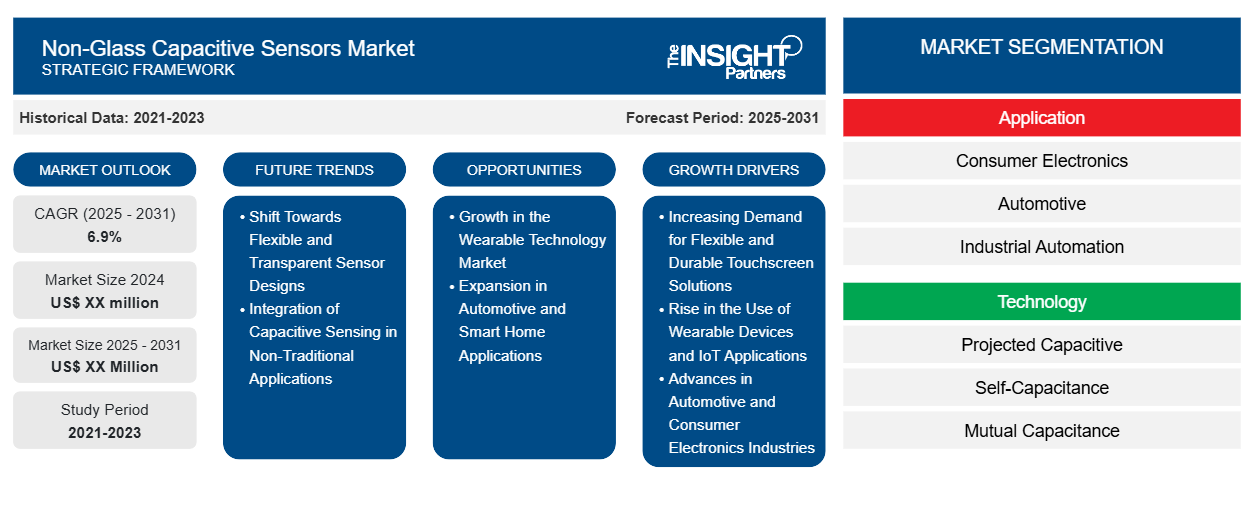
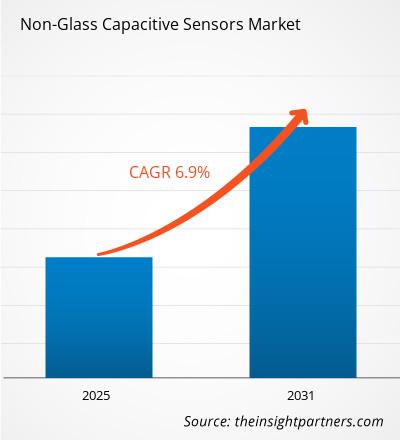
非ガラス静電容量センサー市場は、2025年から2031年にかけて6.9%のCAGRで成長し、市場規模は2024年のXX百万米ドルから2031年にはXX百万米ドルに拡大すると予想されています。
本レポートは、アプリケーション(コンシューマーエレクトロニクス、自動車、産業オートメーション、ヘルスケア、家電)、テクノロジー(投影型静電容量式、自己容量式、相互容量式)、フォームファクター(フレキシブルセンサー、リジッドセンサー、タッチパネル、タッチスクリーン)、エンドユーザー(個人用、商用、産業用)別にセグメント化されています。グローバル分析は、地域レベルおよび主要国別にさらに細分化されています。本レポートでは、上記の分析およびセグメントの米ドル建て価格を提示しています。
報告書の目的
The Insight Partnersによるレポート「非ガラス静電容量センサー市場」は、現在の市場状況と将来の成長、主要な推進要因、課題、そして機会を解説することを目的としています。これにより、以下のような様々なビジネスステークホルダーに洞察を提供します。
- テクノロジープロバイダー/メーカー: 進化する市場の動向を理解し、潜在的な成長機会を把握することで、情報に基づいた戦略的意思決定を行うことができます。
- 投資家: 市場の成長率、市場の財務予測、バリュー チェーン全体に存在する機会に関する包括的な傾向分析を実施します。
- 規制機関: 市場の濫用を最小限に抑え、投資家の信用と信頼を維持し、市場の完全性と安定性を維持することを目的として、市場における政策と警察活動を規制します。
非ガラス静電容量センサー市場のセグメンテーション
応用
- 家電
- 自動車
- 産業オートメーション
- 健康管理
- 家電製品
テクノロジー
- 投影型容量性
- 自己容量
- 相互容量
フォームファクター
- フレキシブルセンサー
- 剛性センサー
- タッチパネル
- タッチスクリーン
最終用途
- 個人使用
- 商用利用
- 産業用途
要件に合わせてレポートをカスタマイズ
このレポートの一部、国レベルの分析、Excelデータパックなど、あらゆるレポートを無料でカスタマイズできます。また、スタートアップや大学向けのお得なオファーや割引もご利用いただけます。
非ガラス静電容量センサ市場:戦略的洞察
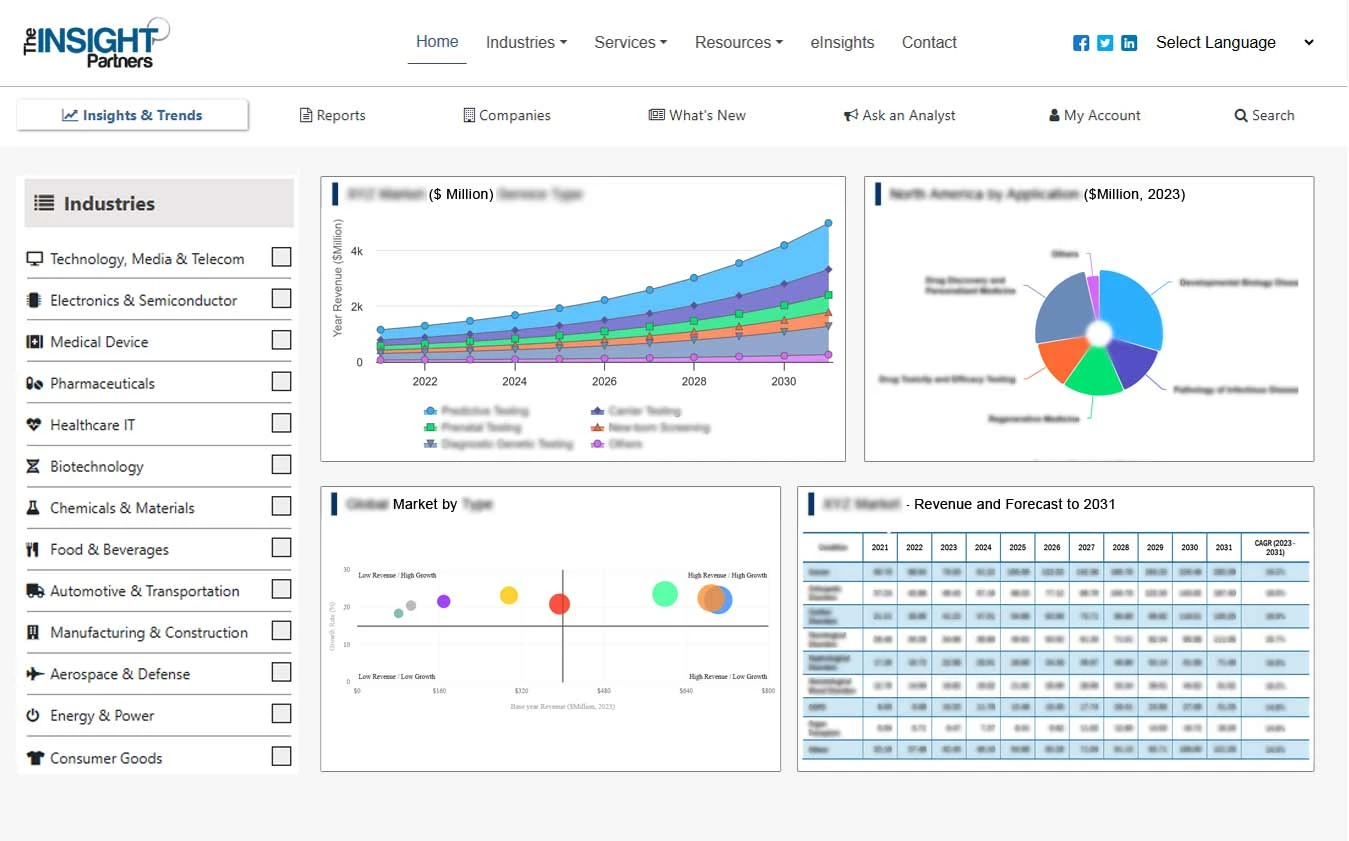
- このレポートの主要な市場動向を入手してください。この無料サンプルには、市場動向から見積もりや予測に至るまでのデータ分析が含まれます。
非ガラス静電容量センサー市場の成長ドライバー
- 柔軟性と耐久性に優れたタッチスクリーンソリューションへの需要の高まり:コンシューマーエレクトロニクス(スマートフォン、タブレット)、自動車(インフォテインメントシステム)、産業用アプリケーションなど、様々な業界で柔軟性と耐久性に優れたタッチスクリーンの採用が拡大していることが、非ガラス静電容量センサー市場の主要な牽引力となっています。プラスチックやフィルムなどの素材で作られることが多い非ガラス静電容量センサーは、従来のガラスベースのセンサーよりも柔軟性と軽量性に優れているため、堅牢性、軽量性、柔軟性が求められるアプリケーションに最適です。
- ウェアラブルデバイスとIoTアプリケーションの利用拡大:ウェアラブルデバイス(スマートウォッチ、フィットネストラッカー)とモノのインターネット(IoT)の急速な成長に伴い、ガラス以外の静電容量センサーの需要が高まっています。これらのセンサーは、スペースと重量が重要な要素となる小型でポータブルなデバイスに不可欠です。フレキシブル基板上で動作し、低消費電力であることから、成長著しいウェアラブルデバイスおよびIoT市場のアプリケーションに最適です。
- 自動車および民生用電子機器業界における進歩:非ガラス静電容量センサーは、自動車分野でタッチセンサー、静電容量式ボタン、車内センサーなどの用途に採用が拡大しています。また、家電製品、ゲーム機、リモコンなどの民生用電子機器にも使用されています。これらの業界では、洗練されたデザイン、応答性、耐久性に優れたタッチインターフェースが求められており、非ガラス静電容量センサーは、これらの要求を満たす信頼性の高いソリューションを提供します。
非ガラス静電容量センサ市場の将来動向
- フレキシブルで透明なセンサー設計への移行:透明でフレキシブル、かつ伸縮性のある静電容量センサーの開発が進み、様々な新しいアプリケーションに組み込むことが期待されています。導電性ポリマーやフレキシブル基板といった材料は、曲面、ウェアラブル、そして従来とは異なる形状の表面に適応可能な非ガラス静電容量センサーの設計にますます活用されています。このトレンドは、フレキシブルエレクトロニクス、スマートパッケージ、ヘルスケア機器などの分野におけるイノベーションへの道を切り開いています。
- 非伝統的なアプリケーションへの静電容量センシングの統合:静電容量センサーは、従来のタッチインターフェースにとどまらず、ジェスチャーコントロール、近接センシング、インタラクティブディスプレイといった非伝統的なアプリケーションにも活用が広がっています。高度なセンシング技術の統合により、ガラスを使用しない静電容量センサーは、スマートホームシステム、ゲーム、ロボット工学、さらにはヘルスケアといった環境で利用され、タッチレス・非接触センサーによって利便性と衛生性が向上しています。
非ガラス静電容量センサの市場機会
- ウェアラブル技術市場の成長:ウェアラブル技術市場は、軽量、柔軟性、耐久性といった特性を持つ非ガラス製静電容量センサーに大きなビジネスチャンスをもたらします。これらのセンサーは、快適性、柔軟性、そして正確なタッチセンシングが求められるスマートウォッチ、フィットネスバンド、健康モニタリングデバイスに最適です。消費者が健康、フィットネス、そして利便性のためにウェアラブル技術を利用するケースが増えるにつれ、これらの高度なセンサーに対する需要は高まっています。
- 自動車およびスマートホーム用途の拡大:自動車およびスマートホーム業界は、非ガラス静電容量センサーにとって大きな成長機会をもたらします。自動車では、これらのセンサーはタッチセンサーボタン、ステアリングホイールコントロール、ジェスチャー認識などに利用でき、現代の車内空間に洗練された耐久性のあるソリューションを提供します。スマートホームでは、静電容量センサーは家電製品、照明、セキュリティシステムなどの直感的なインターフェースを実現します。これらの業界が革新を続け、タッチセンサーやスマート機能の統合を進めていく中で、非ガラス静電容量センサーは新興市場のニーズを満たす大きな機会を秘めています。
非ガラス静電容量センサー市場の地域別分析
Insight Partnersのアナリストは、予測期間を通じて非ガラス静電容量センサー市場に影響を与える地域的なトレンドと要因を詳細に解説しています。このセクションでは、北米、ヨーロッパ、アジア太平洋、中東・アフリカ、中南米における非ガラス静電容量センサー市場のセグメントと地域についても解説します。
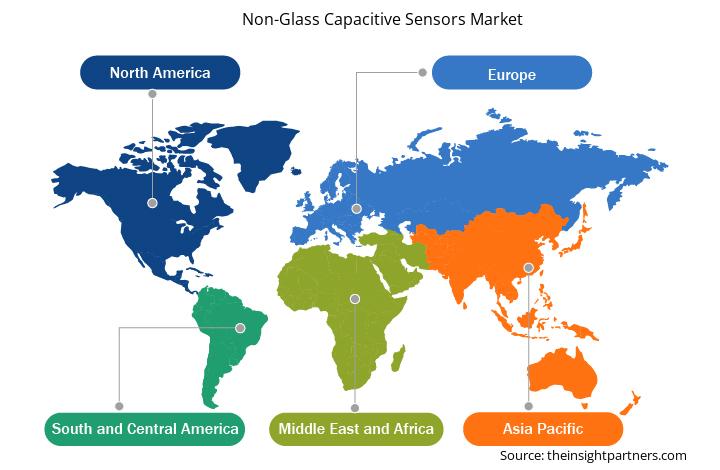
- 非ガラス静電容量センサー市場の地域別データを入手
非ガラス静電容量センサ市場レポートの範囲
| レポート属性 | 詳細 |
|---|---|
| 2024年の市場規模 | XX百万米ドル |
| 2031年までの市場規模 | XX百万米ドル |
| 世界のCAGR(2025年~2031年) | 6.9% |
| 履歴データ | 2021-2023 |
| 予測期間 | 2025-2031 |
| 対象セグメント | アプリケーション別
|
| 対象地域と国 | 北米
|
| 市場リーダーと主要企業の概要 |
|
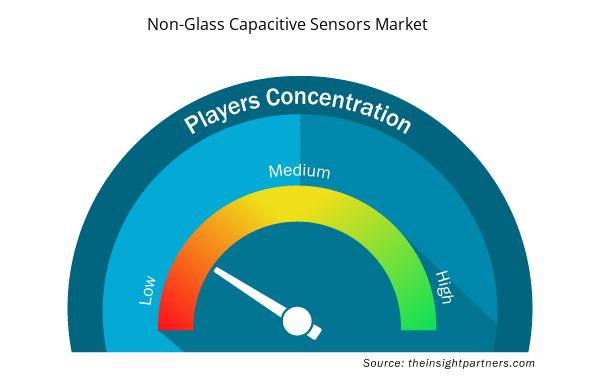
非ガラス静電容量センサ市場のプレーヤー密度:ビジネスダイナミクスへの影響を理解する
非ガラス静電容量センサー市場は、消費者の嗜好の変化、技術の進歩、製品メリットへの認知度の高まりといった要因によるエンドユーザー需要の増加に牽引され、急速に成長しています。需要の増加に伴い、企業は製品ラインナップの拡充、消費者ニーズへの対応のための革新、そして新たなトレンドの活用を進めており、これが市場の成長をさらに加速させています。
市場プレーヤー密度とは、特定の市場または業界内で活動している企業または会社の分布を指します。これは、特定の市場スペースに、その規模または総市場価値と比較して、どれだけの競合相手 (市場プレーヤー) が存在するかを示します。
非ガラス静電容量センサー市場で事業を展開している主要企業は次のとおりです。
- アトメル
- STマイクロエレクトロニクス
- テキサス・インスツルメンツ
- オン・セミコンダクター
- ハネウェル
免責事項:上記の企業は、特定の順序でランク付けされているわけではありません。
- 非ガラス静電容量センサー市場のトップキープレーヤーの概要を入手
主なセールスポイント
- 包括的なカバレッジ:レポートでは、非ガラス静電容量センサー市場の製品、サービス、タイプ、エンドユーザーの分析を包括的にカバーし、全体的な展望を提供します。
- 専門家の分析:レポートは、業界の専門家とアナリストの深い理解に基づいて作成されています。
- 最新情報: このレポートは、最新の情報とデータの傾向を網羅しているため、ビジネスの関連性を保証します。
- カスタマイズ オプション: このレポートは、特定のクライアント要件に対応し、ビジネス戦略に適切に適合するようにカスタマイズできます。
したがって、非ガラス静電容量センサー市場に関する調査レポートは、業界の状況と成長見通しを解明し、理解するための先導役となるでしょう。いくつかの妥当な懸念事項はあるものの、このレポートの全体的なメリットはデメリットを上回る傾向にあります。
- 過去2年間の分析、基準年、CAGRによる予測(7年間)
- PEST分析とSWOT分析
- 市場規模価値/数量 - 世界、地域、国
- 業界と競争環境
- Excel データセット
- Lyophilization Services for Biopharmaceuticals Market
- Water Pipeline Leak Detection System Market
- Lymphedema Treatment Market
- Smart Parking Market
- Sexual Wellness Market
- Fishing Equipment Market
- Battery Testing Equipment Market
- EMC Testing Market
- Virtual Event Software Market
- Social Employee Recognition System Market

Report Coverage
Revenue forecast, Company Analysis, Industry landscape, Growth factors, and Trends

Segment Covered
This text is related
to segments covered.

Regional Scope
North America, Europe, Asia Pacific, Middle East & Africa, South & Central America

Country Scope
This text is related
to country scope.
よくある質問
Some of the customization options available based on the request are an additional 3–5 company profiles and country-specific analysis of 3–5 countries of your choice. Customizations are to be requested/discussed before making final order confirmation# as our team would review the same and check the feasibility
Key players in the non-glass capacitive sensors market include Atmel, STMicroelectronics, Texas Instruments, ON Semiconductor, Honeywell, Apple, Infineon Technologies, Broadcom, Elmos Semiconductor, and Analog Devices.
Integration of Capacitive Sensing in Non-Traditional Applications is likely to remain a key trend in the market.
The major factors driving the non-glass capacitive sensors market are:
1. Increasing Demand for Flexible and Durable Touchscreen Solutions.
2.Rise in the Use of Wearable Devices and IoT Applications
The non-glass capacitive sensors market is estimated to witness a CAGR of 6.9% from 2024 to 2031
Trends and growth analysis reports related to Electronics and Semiconductor : READ MORE..
The Insight Partners performs research in 4 major stages: Data Collection & Secondary Research, Primary Research, Data Analysis and Data Triangulation & Final Review.
- Data Collection and Secondary Research:
As a market research and consulting firm operating from a decade, we have published and advised several client across the globe. First step for any study will start with an assessment of currently available data and insights from existing reports. Further, historical and current market information is collected from Investor Presentations, Annual Reports, SEC Filings, etc., and other information related to company’s performance and market positioning are gathered from Paid Databases (Factiva, Hoovers, and Reuters) and various other publications available in public domain.
Several associations trade associates, technical forums, institutes, societies and organization are accessed to gain technical as well as market related insights through their publications such as research papers, blogs and press releases related to the studies are referred to get cues about the market. Further, white papers, journals, magazines, and other news articles published in last 3 years are scrutinized and analyzed to understand the current market trends.
- Primary Research:
The primarily interview analysis comprise of data obtained from industry participants interview and answers to survey questions gathered by in-house primary team.
For primary research, interviews are conducted with industry experts/CEOs/Marketing Managers/VPs/Subject Matter Experts from both demand and supply side to get a 360-degree view of the market. The primary team conducts several interviews based on the complexity of the markets to understand the various market trends and dynamics which makes research more credible and precise.
A typical research interview fulfils the following functions:
- Provides first-hand information on the market size, market trends, growth trends, competitive landscape, and outlook
- Validates and strengthens in-house secondary research findings
- Develops the analysis team’s expertise and market understanding
Primary research involves email interactions and telephone interviews for each market, category, segment, and sub-segment across geographies. The participants who typically take part in such a process include, but are not limited to:
- Industry participants: VPs, business development managers, market intelligence managers and national sales managers
- Outside experts: Valuation experts, research analysts and key opinion leaders specializing in the electronics and semiconductor industry.
Below is the breakup of our primary respondents by company, designation, and region:

Once we receive the confirmation from primary research sources or primary respondents, we finalize the base year market estimation and forecast the data as per the macroeconomic and microeconomic factors assessed during data collection.
- Data Analysis:
Once data is validated through both secondary as well as primary respondents, we finalize the market estimations by hypothesis formulation and factor analysis at regional and country level.
- Macro-Economic Factor Analysis:
We analyse macroeconomic indicators such the gross domestic product (GDP), increase in the demand for goods and services across industries, technological advancement, regional economic growth, governmental policies, the influence of COVID-19, PEST analysis, and other aspects. This analysis aids in setting benchmarks for various nations/regions and approximating market splits. Additionally, the general trend of the aforementioned components aid in determining the market's development possibilities.
- Country Level Data:
Various factors that are especially aligned to the country are taken into account to determine the market size for a certain area and country, including the presence of vendors, such as headquarters and offices, the country's GDP, demand patterns, and industry growth. To comprehend the market dynamics for the nation, a number of growth variables, inhibitors, application areas, and current market trends are researched. The aforementioned elements aid in determining the country's overall market's growth potential.
- Company Profile:
The “Table of Contents” is formulated by listing and analyzing more than 25 - 30 companies operating in the market ecosystem across geographies. However, we profile only 10 companies as a standard practice in our syndicate reports. These 10 companies comprise leading, emerging, and regional players. Nonetheless, our analysis is not restricted to the 10 listed companies, we also analyze other companies present in the market to develop a holistic view and understand the prevailing trends. The “Company Profiles” section in the report covers key facts, business description, products & services, financial information, SWOT analysis, and key developments. The financial information presented is extracted from the annual reports and official documents of the publicly listed companies. Upon collecting the information for the sections of respective companies, we verify them via various primary sources and then compile the data in respective company profiles. The company level information helps us in deriving the base number as well as in forecasting the market size.
- Developing Base Number:
Aggregation of sales statistics (2020-2022) and macro-economic factor, and other secondary and primary research insights are utilized to arrive at base number and related market shares for 2022. The data gaps are identified in this step and relevant market data is analyzed, collected from paid primary interviews or databases. On finalizing the base year market size, forecasts are developed on the basis of macro-economic, industry and market growth factors and company level analysis.
- Data Triangulation and Final Review:
The market findings and base year market size calculations are validated from supply as well as demand side. Demand side validations are based on macro-economic factor analysis and benchmarks for respective regions and countries. In case of supply side validations, revenues of major companies are estimated (in case not available) based on industry benchmark, approximate number of employees, product portfolio, and primary interviews revenues are gathered. Further revenue from target product/service segment is assessed to avoid overshooting of market statistics. In case of heavy deviations between supply and demand side values, all thes steps are repeated to achieve synchronization.
We follow an iterative model, wherein we share our research findings with Subject Matter Experts (SME’s) and Key Opinion Leaders (KOLs) until consensus view of the market is not formulated – this model negates any drastic deviation in the opinions of experts. Only validated and universally acceptable research findings are quoted in our reports.
We have important check points that we use to validate our research findings – which we call – data triangulation, where we validate the information, we generate from secondary sources with primary interviews and then we re-validate with our internal data bases and Subject matter experts. This comprehensive model enables us to deliver high quality, reliable data in shortest possible time.
 このレポートの無料サンプルを入手する