北米交通管理市場アナリストの視点:
交通管理は、交通の流れを規制するための最も重要な技術ツールの 1 つです。渋滞を緩和し、さらには汚染物質も削減します。情報技術、コンピュータ技術、システム科学の進歩は、常にその成功と進化を伴ってきました。自己適応制御システムは、管理者の制御目標 (交差点の最小遅延など) や交通流の到着特性に基づいて、信号のタイミング設定をリアルタイムで変更できます。時限制御や作動制御と比較して、自己適応制御システムは、道路網全体の交通容量をより有効に活用し、交通効率を効率的に高めることができます。
北米全土の政府は、交通インフラの改善に注力しています。自己適応型交通信号システムは、近い将来、適応するのに役立つシステムになる可能性があります。たとえば、カナダは、カナダの交通の将来のための戦略計画である Transportation 2030 を組み込みました。この計画を通じて、政府はより安全で、より環境に優しく、より革新的な交通手段に重点を置いています。さらに、米国政府は交通インフラへの投資に注力している。米国の法律には、交通機関を改善するための 390 億米ドルの追加資金と、地上交通刷新の一環としての既存の交通プログラムの 5 年間の延長が含まれています。超党派のインフラ協定における新たな投資と再認可により、合計で今後 5 年間に公共交通機関に 899 億米ドルの保証資金が提供されます。したがって、交通システムを近代化するこのような政府の取り組みは、交通制御を近代化し、北米の交通管理市場の成長を促進するための自己適応型交通信号システムの導入にプラスの影響を与えると予想されます。
北米交通管理市場の概要:
コネクテッドカーの数が増加するにつれ、情報通信技術は交通管理に不可欠なものになってきています。現代のトラフィック管理には、ハードウェア、ソフトウェア、サービスが含まれます。ハードウェアは、道路状況、汚染レベル、交通量、事故、交通違反の記録などの多変量データを収集します。これには、さまざまな種類のカメラ、センサー、表示ボードが含まれます。ソフトウェアは、ハードウェアを通じて生成されたデータにアクセスし、照合し、有意義な洞察を引き出すために必要です。交通管理システムをスムーズに実行するには、さまざまな種類のサービスが必要です。これには、ハードウェアの修理とメンテナンス、データ収集センターの運営、ソフトウェアのメンテナンスが含まれます。北米交通管理市場レポートでは、市場を推進する主要な要因が強調されています。北米の交通管理市場のエコシステムには、コンポーネント プロバイダー、交通管理ハードウェア メーカー、交通管理ソフトウェア プロバイダー、交通管理サービス プロバイダー、エンド ユーザーなど、さまざまな関係者が関与しています。コンポーネント プロバイダーは、レンズ、メモリ モジュール、チップ、LED などのコンポーネントをハードウェア メーカーに供給します。 Axis、Hikvision、Dahua などのハードウェア メーカーは、交通管理に必要なさまざまな種類のカメラ、センサー、表示ボードなどの重要なハードウェア システムを製造しています。ソフトウェア開発者は、ハードウェア システムが収集および分析されたデータから有意義な洞察を導き出せるようにするソフトウェアの開発を担当します。いくつかのハードウェア メーカーはソフトウェア開発者と協力してソフトウェア ソリューションを開発しています。 IBM と Siemens は、この業界をリードするソフトウェア開発会社の 1 つです。
サービス プロバイダーは、トラフィック管理市場のエコシステムにおいて独自の立場にあります。彼らは他のすべての利害関係者にサービスを提供します。たとえば、SGS SA はハードウェア メーカーにテストおよび検査サービスを提供し、SNC-Lavalin はシステムのスムーズな設置と機能のためのさまざまなサービスをエンド ユーザーに提供します。エンドユーザーのほとんどは、道路の適切な機能を担当する政府当局およびインフラ開発会社です。政府当局には、連邦および州の機関が含まれる場合があります。
北米の交通管理市場の推進力:
都市化の増加が北米の交通管理市場の成長を促進
国連会議によると貿易開発(UNCTAD)によると、2010 年の 51.6% と比較して、2020 年には世界人口の 56.2% が都市部に居住しています。米国では都市居住者の割合が 79% を超えています。このような都市人口の増加により、道路にかかるストレスが増大します。他のいくつかの要因も都市部の渋滞の増加に直接関係しており、より優れた交通管理システムに対する要求が高まっています。まず、都市人口の増加により道路を走る車両の数が増加し、渋滞が発生します。一例を挙げると、国立矯正研究所によると、2022 年の米国の人口は 3 億 3,828 万 9,857 人で、2021 年から 0.38% 増加しました。一方、運輸統計局によると、乗用車を含む米国の自動車総生産台数は乗用車と商用車は、2020 年の 880 万台から 2021 年には 910 万台に増加しました。乗用車と商用車を含む米国国内総販売台数は、2020 年の 1,150 万台から 2021 年には 1,180 万台に増加しました。北米の交通管理市場予測を計算する際に、上記の要因の影響が考慮されました。第二に、Uber、Grab、Lyft などのタクシー アグリゲーターによる配車サービスが急速に増加しています。このようなサービスが公共交通機関の代わりとなり、道路を走る車両の急増につながっています。第三に、都市化の進行は、電子商取引とオンデマンド プラットフォームの成長にプラスの影響を与えました。オンライン購入の増加により、二輪車を含む配送車両の需要が急増しました。このような要因は、北米の交通管理市場を押し上げると予想されます。
北米の交通管理市場セグメント分析:
北米の交通管理市場は、コンポーネントとアプリケーションに基づいて分割されています。コンポーネントに基づいて、市場はハードウェア、ソフトウェア、サービスに分類されます。ハードウェアセグメントはカメラ、ディスプレイボード、センサーにさらに細分化され、ソフトウェアセグメントはさらにオンプレミスとクラウドに分かれています。アプリケーションに基づいて、市場は自動料金徴収、車線管理、駐車管理、監視、信号管理などに分類されます。北米の交通管理市場は国ごとに米国とカナダに分割されています。米国の交通管理市場は、アリゾナ、ケンタッキー、メリーランド、ミシガン、ニューヨーク、ノースカロライナ、オハイオ、サウスカロライナ、バージニア、ウィスコンシン、および米国のその他の地域にさらに分割されます。カナダの交通管理市場は、アルバータ州、ブリティッシュ コロンビア州、オンタリオ州、ケベック州、カナダのその他の地域に分割されています。
市場はコンポーネントごとに、ハードウェア、ソフトウェア、サービスに分割されています。ハードウェア部門は、2022 年の北米トラフィック管理市場で最大のシェアを獲得しました。ハードウェアは、データ収集に使用される主要なツールであるため、トラフィック管理市場の重要なコンポーネントです。ハードウェアには、カメラ、ディスプレイ ボード、センサーが含まれます。カメラは、信号違反車両の特定、捜索中の車両の追跡、交通の動きの記録に役立ちます。表示ボードは、ドライバーに前方の道路に関するさまざまな最新情報を知らせ、さまざまな情報を表示するのに役立ちます。センサーは、道路状況の監視や特定の道路区間の車両数の計算など、さまざまな用途に使用されます。ハードウェアはトラフィック管理の最も重要なコンポーネントと言えます。ハードウェアがなければ他の 2 つのコンポーネントは動作できなくなるからです。さまざまな政府機関が交通管理ハードウェアのアップグレードに投資しており、これが主にこのセグメントの北米交通管理市場を牽引しています。
北米交通管理市場地域分析:
米国は、北米の交通管理市場で最大のシェアを誇ります。米国運輸省 (DOT) は、インテリジェント交通管理システム (ITMS) の研究開発、実装、および受け入れに多額の投資を行ってきました。地方自治体は交通インフラの構築に重点を置いているため、交通管理システムの導入が進んでいます。地域全体の交通ネットワークの革命は、通信技術の進歩と、リアルタイムの相互交換を通じて輸送能力の有効性を高めるために車両の渋滞に対処する必要性の高まりによって先導されることが予想されます。さらに、短距離専用技術を備えたモバイルおよび無線デバイスの使用が増加しているため、この地域全体で ITMS ソリューションの需要が急増しています。
使用される中央制御の信号機やセンサーを管理するためのスマート交通システムの採用が増加しています。都市全体の交通の流れを規制し制御することは、北米の市場の成長を強力に促進しています。これらのシステムにより、都市は交通の流れを効率的に処理し、旅行者からの新たな需要にリアルタイムで対応し、都市全体の汚染を軽減することにより、交通渋滞を緩和することができます。スマート交通システムはアイドリングストップ運転を根絶するため、より効率的で汚染が少ないと考えられています。したがって、ITMS の採用の増加により、予測期間中に米国の交通管理市場が押し上げられると予想されます。
北米の交通管理市場の主要企業分析:
北米の交通管理市場の主要動向は、次のことを示しています。大手企業は都市開発の進展によって生まれる機会を活用するためにいくつかの措置を講じているとのこと。 Axis Communications AB、Cisco Systems Inc、Cubic Corporation、Dahua Technology Co Ltd、Hangzhou Hikvision Digital Technology Co Ltd、IBM Corporation、SGS SA、Siemens AG、SNC-Lavalin Group Inc、および Teledyne FLIR LLC は、このレポートで分析された著名なプレーヤーの 1 つです。北米の交通管理市場レポート。この北米交通管理市場分析では、市場とそのエコシステムの全体像を把握するために、他のいくつかの重要なプレーヤーも評価されました。主要プレーヤーは、機能のアップグレード、拡張と多様化、コラボレーション、および買収戦略に焦点を当てており、これにより新たなビジネスチャンスを掴むことができます。
北米交通管理市場の最近の展開:
プレーヤーは高い評価を得ています。無機的戦略と有機的戦略を採用します。以下にいくつかの主要な進展を示します。
2023 年 12 月、ミシガン州運輸省は、西部カラマズー郡と東部ベリアン郡の間の州間高速道路 94 (I-94) 沿いに 14 個の新しいデジタル標識を設置しました。新しい標識は既存の標識に比べて大幅な改善が期待されており、厳しい気象条件下での安全運転を促進する可能性が最も高いです。2022 年 7 月に、Dahua は AI を活用した新しいアップグレードを開始しました。 Dahua WizMind は、業界をリードする深層学習アルゴリズムを採用した IPC、NVR、PTZ、XVR、サーマル カメラなどのプロジェクト指向の製品で構成されるソリューションの完全なポートフォリオです。 WizMind は、顧客の実際のニーズと要件に重点を置き、垂直市場向けに正確で信頼性の高い包括的な AI ソリューションを提供します。
- 過去2年間の分析、基準年、CAGRによる予測(7年間)
- PEST分析とSWOT分析
- 市場規模価値/数量 - 世界、地域、国
- 業界と競争環境
- Excel データセット

Report Coverage
Revenue forecast, Company Analysis, Industry landscape, Growth factors, and Trends

Segment Covered
This text is related
to segments covered.

Regional Scope
North America, Europe, Asia Pacific, Middle East & Africa, South & Central America

Country Scope
This text is related
to country scope.
よくある質問
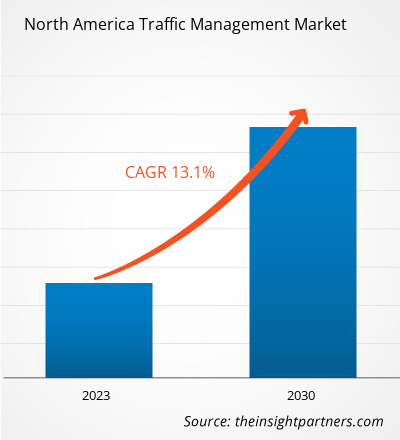
The North America traffic management market are expected to reach US$ 28.87 billion by 2030.
The hardware segment led the North America traffic management market with a significant share in 2022 and software segment is expected to grow with the highest CAGR.
The key players holding majority shares in the North America traffic management market include Cisco Systems Inc, Cubic Corporation, IBM Corporation, Siemens AG, and Teledyne FLIR.
Increasing deployment of AI and ML and growing adoption of self-adaptive traffic signal systems is expected to drive the growth of the North America traffic management market in the coming years.
Increasing urbanization and growing infrastructure investment are driving factors of North America traffic management market.
The North America traffic management market was estimated to be valued at US$ 10.04 billion in 2022 and is projected to reach US$ 28.87 billion by 2030; it is expected to grow at a CAGR of 13.1% during the forecast period.
Trends and growth analysis reports related to Technology, Media and Telecommunications : READ MORE..
The List of Companies - North America Traffic Management Market
- Axis Communications AB
- Cisco Systems Inc
- Cubic Corp
- Dahua Technology Co., Ltd.
- International Business Machines Corp
- Hangzhou Hikvision Digital Technology Co Ltd
- SGS SA
- Siemens AG
- Teledyne FLIR LLC
- Snc-Lavalin Group Inc
The Insight Partners performs research in 4 major stages: Data Collection & Secondary Research, Primary Research, Data Analysis and Data Triangulation & Final Review.
- Data Collection and Secondary Research:
As a market research and consulting firm operating from a decade, we have published and advised several client across the globe. First step for any study will start with an assessment of currently available data and insights from existing reports. Further, historical and current market information is collected from Investor Presentations, Annual Reports, SEC Filings, etc., and other information related to company’s performance and market positioning are gathered from Paid Databases (Factiva, Hoovers, and Reuters) and various other publications available in public domain.
Several associations trade associates, technical forums, institutes, societies and organization are accessed to gain technical as well as market related insights through their publications such as research papers, blogs and press releases related to the studies are referred to get cues about the market. Further, white papers, journals, magazines, and other news articles published in last 3 years are scrutinized and analyzed to understand the current market trends.
- Primary Research:
The primarily interview analysis comprise of data obtained from industry participants interview and answers to survey questions gathered by in-house primary team.
For primary research, interviews are conducted with industry experts/CEOs/Marketing Managers/VPs/Subject Matter Experts from both demand and supply side to get a 360-degree view of the market. The primary team conducts several interviews based on the complexity of the markets to understand the various market trends and dynamics which makes research more credible and precise.
A typical research interview fulfils the following functions:
- Provides first-hand information on the market size, market trends, growth trends, competitive landscape, and outlook
- Validates and strengthens in-house secondary research findings
- Develops the analysis team’s expertise and market understanding
Primary research involves email interactions and telephone interviews for each market, category, segment, and sub-segment across geographies. The participants who typically take part in such a process include, but are not limited to:
- Industry participants: VPs, business development managers, market intelligence managers and national sales managers
- Outside experts: Valuation experts, research analysts and key opinion leaders specializing in the electronics and semiconductor industry.
Below is the breakup of our primary respondents by company, designation, and region:

Once we receive the confirmation from primary research sources or primary respondents, we finalize the base year market estimation and forecast the data as per the macroeconomic and microeconomic factors assessed during data collection.
- Data Analysis:
Once data is validated through both secondary as well as primary respondents, we finalize the market estimations by hypothesis formulation and factor analysis at regional and country level.
- Macro-Economic Factor Analysis:
We analyse macroeconomic indicators such the gross domestic product (GDP), increase in the demand for goods and services across industries, technological advancement, regional economic growth, governmental policies, the influence of COVID-19, PEST analysis, and other aspects. This analysis aids in setting benchmarks for various nations/regions and approximating market splits. Additionally, the general trend of the aforementioned components aid in determining the market's development possibilities.
- Country Level Data:
Various factors that are especially aligned to the country are taken into account to determine the market size for a certain area and country, including the presence of vendors, such as headquarters and offices, the country's GDP, demand patterns, and industry growth. To comprehend the market dynamics for the nation, a number of growth variables, inhibitors, application areas, and current market trends are researched. The aforementioned elements aid in determining the country's overall market's growth potential.
- Company Profile:
The “Table of Contents” is formulated by listing and analyzing more than 25 - 30 companies operating in the market ecosystem across geographies. However, we profile only 10 companies as a standard practice in our syndicate reports. These 10 companies comprise leading, emerging, and regional players. Nonetheless, our analysis is not restricted to the 10 listed companies, we also analyze other companies present in the market to develop a holistic view and understand the prevailing trends. The “Company Profiles” section in the report covers key facts, business description, products & services, financial information, SWOT analysis, and key developments. The financial information presented is extracted from the annual reports and official documents of the publicly listed companies. Upon collecting the information for the sections of respective companies, we verify them via various primary sources and then compile the data in respective company profiles. The company level information helps us in deriving the base number as well as in forecasting the market size.
- Developing Base Number:
Aggregation of sales statistics (2020-2022) and macro-economic factor, and other secondary and primary research insights are utilized to arrive at base number and related market shares for 2022. The data gaps are identified in this step and relevant market data is analyzed, collected from paid primary interviews or databases. On finalizing the base year market size, forecasts are developed on the basis of macro-economic, industry and market growth factors and company level analysis.
- Data Triangulation and Final Review:
The market findings and base year market size calculations are validated from supply as well as demand side. Demand side validations are based on macro-economic factor analysis and benchmarks for respective regions and countries. In case of supply side validations, revenues of major companies are estimated (in case not available) based on industry benchmark, approximate number of employees, product portfolio, and primary interviews revenues are gathered. Further revenue from target product/service segment is assessed to avoid overshooting of market statistics. In case of heavy deviations between supply and demand side values, all thes steps are repeated to achieve synchronization.
We follow an iterative model, wherein we share our research findings with Subject Matter Experts (SME’s) and Key Opinion Leaders (KOLs) until consensus view of the market is not formulated – this model negates any drastic deviation in the opinions of experts. Only validated and universally acceptable research findings are quoted in our reports.
We have important check points that we use to validate our research findings – which we call – data triangulation, where we validate the information, we generate from secondary sources with primary interviews and then we re-validate with our internal data bases and Subject matter experts. This comprehensive model enables us to deliver high quality, reliable data in shortest possible time.
 このレポートの無料サンプルを入手する