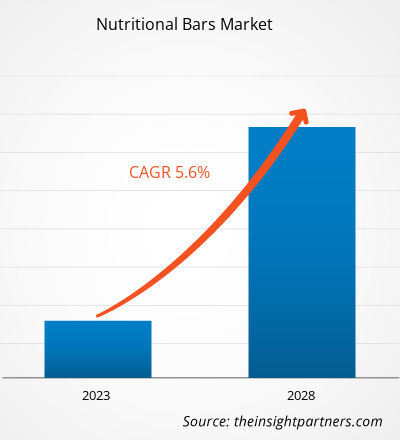
栄養バー市場規模は、2022年の71億96万米ドルから2028年には98億3838万米ドルに拡大すると予想されており、2022年から2028年にかけて5.6%のCAGRで成長すると予測されています。
栄養バーは糖分が少なく、タンパク質とオメガ 3 脂肪酸が豊富で、添加物も少ないです。繊維とタンパク質の含有量が多いため、他のバーよりも健康的な代替品と考えられています。栄養バーは、体内のタンパク質レベルを高め、筋肉の修復を助け、身体能力を向上させ、代謝を促進し、運動前後のグルコースと飽和脂肪のレベルを下げます。栄養バーには、プロテインバーや高繊維バーなど、さまざまな製品タイプがあります。栄養バー市場の成長は、栄養バーの利点に関する認識の高まりと、世界中のフィットネス センターやウェルネス センターの数の増加に起因しています。
2021年、北米は世界の栄養バー市場で最大のシェアを占めました。ただし、アジア太平洋地域は予測期間中に最高のCAGRを記録すると予測されています。アジア太平洋地域の新興国では、健康志向の消費者が急増しており、栄養バーなどの機能性食品の需要が生まれます。増加する都市部の中流階級の忙しいライフスタイルと個人の栄養不足が市場の成長を牽引しています。この地域のさまざまな国の政府は、COVID-19を引き起こす新しいコロナウイルス感染の拡大を抑制するために積極的な対策を講じています。COVID-19パンデミックの間、免疫力を高めるために、健康的な食品や飲料製品の必要性が地域全体で高まりました。都市化の進展、可処分所得の増加、健康志向の消費者の増加により、地域全体で栄養バーの需要が高まっています。
要件に合わせて調査をカスタマイズ
弊社の標準サービスでは対応できない分析と範囲を最適化し、カスタマイズすることができます。この柔軟性により、ビジネス計画と意思決定に必要な正確な情報を得ることができます。
栄養バー市場:

CAGR (2022 - 2028)5.6%- 市場規模 2022年
71億米ドル - 市場規模 2028年
98.4億米ドル

市場の動向
- XXXXXXXXX
- XXXXXXXXX
- XXXXXXXXX
- XXXXXXXXX
- XXXXXXXXX
- XXXXXXXXX
- XXXXXXXXX
- XXXXXXXXX
- XXXXXXXXX
主要人物
- シンプルグッドフーズ社
- クリフ・バー&コー
- ゼネラルミルズ
- ケロッグ社
- ライズバー株式会社
- クエーカーオーツ社
- パーフェクトバーLLC
- マース株式会社
- カインドLLC
地域概要

- 北米
- ヨーロッパ
- アジア太平洋地域
- 南米と中央アメリカ
- 中東およびアフリカ
市場セグメンテーション
 タイプ
タイプ- プロテインバー
- 高繊維バー
- その他
 カテゴリー
カテゴリー- 従来型とグルテンフリー
 流通経路
流通経路- スーパーマーケットとハイパーマーケット
- コンビニ
- オンライン小売
- その他
- サンプル PDF では、定性的および定量的な分析により、コンテンツの構造と情報の性質が紹介されています。
COVID-19パンデミックが栄養バー市場に与える影響
COVID-19の発生前、栄養バー市場は、消化器系と免疫系の健康をサポートする栄養価の高いスナックの選択肢に対する需要の高まりによって牽引されていました。さらに、2021年には、さまざまな国の政府が以前に課された制限の緩和を発表したため、さまざまな経済が再開され、世界市場が活性化しました。さらに、メーカーはフル稼働を許可されたため、需要と供給のギャップやその他の影響を克服することができました。さらに、COVID-19パンデミックは、栄養バー市場に長期的な好影響を与えました。したがって、栄養バーは人体の全体的な栄養所要量を維持するのに役立つため、需要が高くなっています。
さらに、COVID-19パンデミックは、栄養バー市場に長期的な好影響を与えました。したがって、栄養バーは人体の全体的な栄養所要量を維持するのに役立つため、需要が高くなっています。COVID-19患者数の増加により、消費者は免疫力を高める栄養価の高い製品に惹かれました。COVID-19パンデミックの影響により、消費者は健康とウェルネスにますます注意を払うようになりました。さらに、栄養価の高い外出先でのスナック製品の需要の増加により、栄養バーの売上が伸びました。パンデミック中に免疫力を改善するためのより良い選択肢を見つけることに消費者の焦点が強まるにつれて、栄養バーの需要が世界中で高まりました。
市場分析
主要企業による戦略的展開が栄養バー市場の成長を後押し
2022年6月、ケロッグスペシャルKは、1本あたり6グラムのタンパク質と90カロリーを提供するプロテインスナックバーを発売しました。この製品には、ベリーバニラとブラウニーサンデーの2つのフレーバーがあります。この製品の価格は、5個入りパッケージで4.29米ドルです。企業は、世界中で高まる栄養バーの需要を満たすために生産能力を拡大しています。このような戦略は、予測期間中に栄養バー市場の成長を促進すると予想されます。
カテゴリーインサイト
カテゴリー別に見ると、栄養バー市場は従来型とグルテンフリーに分かれています。従来型セグメントは2021年に大きな市場シェアを占めましたが、グルテンフリーセグメントは2022年から2028年にかけてより高いCAGRを記録すると予想されています。消費者が健康志向になり、グルテンフリー栄養バーなどの健康的な代替品を好むようになるため、従来型栄養バーの需要は減少すると予想されます。グルテンアレルギーのある人は、従来型バーを食べることができません。
流通チャネルの洞察
流通チャネルに基づいて、栄養バー市場はスーパーマーケットとハイパーマーケット、コンビニエンスストア、オンライン小売、その他に分類されます。スーパーマーケットとハイパーマーケットセグメントは2021年に最大の市場シェアを占めましたが、オンライン小売セグメントは予測期間中に最高のCAGRを記録すると予測されています。スーパーマーケットとハイパーマーケットは、食料品、栄養製品、その他の家庭用品など、幅広い製品を提供する大規模な小売店です。これらの店舗ではさまざまなブランドの製品が手頃な価格で入手できるため、買い物客は適切な製品をすばやく見つけることができます。さらに、これらの店舗では魅力的な割引、複数の支払いオプション、快適な顧客体験を提供しています。スーパーマーケットとハイパーマーケットは、利益を増やすために製品の販売を最大化することに重点を置いています。
Simply Good Foods Co、Clif Bar & Co、General Mills Inc、The Kellogg Co、Rise Bar Inc、The Quaker Oats Co、Perfect Bar LLC、Mars Inc、Kind LLC、および Premier Nutrition Co LLC は、栄養バー市場で事業を展開している大手企業です。これらの企業は主に、市場規模を拡大し、新興市場のトレンドを追うために、製品の革新に重点を置いています。
栄養バー市場レポートの範囲
| レポート属性 | 詳細 |
|---|---|
| 2022年の市場規模 | 71億米ドル |
| 2028年までの市場規模 | 98.4億米ドル |
| 世界のCAGR(2022年 - 2028年) | 5.6% |
| 歴史的なデータ | 2020-2021 |
| 予測期間 | 2023-2028 |
| 対象セグメント | タイプ別
|
| 対象地域と国 | 北米
|
| 市場リーダーと主要企業プロフィール |
|
- サンプル PDF では、定性的および定量的な分析により、コンテンツの構造と情報の性質が紹介されています。
報告
スポットライト
- 企業が効果的な長期戦略を策定するのに役立つ栄養バー市場の進歩的な業界動向
- 先進国と発展途上国の栄養バー市場プレーヤーが採用しているビジネス成長戦略
- 2022年から2028年までの市場の定量分析
- 栄養バーの世界需要の推定
- 栄養バー市場におけるバイヤーとサプライヤーの有効性を示すポーターの5つの力の分析
- 競争市場の状況を理解するための最近の動向
- 市場動向と見通し、栄養バー市場の成長を牽引・抑制する要因
- 商業的利益を支える市場戦略を強調することで意思決定プロセスを支援する
- 栄養バー市場の規模
- 栄養バー業界の市場と成長動向の詳細な概要とセグメンテーション
- 有望な成長機会があるさまざまな地域の栄養バー市場の規模
- 過去2年間の分析、基準年、CAGRによる予測(7年間)
- PEST分析とSWOT分析
- 市場規模価値/数量 - 世界、地域、国
- 業界と競争環境
- Excel データセット


Report Coverage
Revenue forecast, Company Analysis, Industry landscape, Growth factors, and Trends

Segment Covered
This text is related
to segments covered.

Regional Scope
North America, Europe, Asia Pacific, Middle East & Africa, South & Central America

Country Scope
This text is related
to country scope.
よくある質問
The major players operating in the global nutritional bars market are The Simply Good Foods Co, Clif Bar & Co, General Mills Inc, The Kellogg Co, Rise Bar Inc, The Quaker Oats Co, Perfect Bar LLC, Mars Inc, Kind LLC, and Premier Nutrition Co LLC.
Nutritional bars manufacturers are increasingly launching products with functional claims and are communicating the health benefits associated with the consumption of the bars. This allows them to expand their customer base and increase their profits. The successful communication of functional claims is the main concern for manufacturers. Recent reports from scientific literature confirm that consumers are genuinely interested in health-related claims, but interest seems to vary depending on the type of food products. Too much information and difficulty interpreting different health claims have been noted as factors that can negatively influence consumers while purchasing nutritional bars. Therefore, including functional claims on labels is likely to provide significant growth opportunities to the manufacturers of nutritional bars in the coming years.
Based on the category, gluten-free segment is projected to grow at the fastest CAGR over the forecast period. Rising health concerns among consumers and increasing number of product launches has surged the growth of gluten-free nutritional bars segment.
Over the past few years, people have become more concerned about what they eat and the nutritional profile of the products they eat. Nutritional bars manufacturers are engaging in various strategic development initiatives to sustain in the market by offering innovative products to customers. For example, in 2021, LUNA, the women-centric brand by Clif Bar & Company, launched a new line of bars containing 2.5 grams of prebiotics. These are the first bars with prebiotics. Studies show that 5 grams or more of fiber-containing prebiotics can propel the development of beneficial bacteria in the gut, supporting digestive health. Such product launches attract consumers to choose from a wide range of nutritional bars, which is eventually bolstering the growth of the nutritional bars market.
Based on type, protein bars segment mainly has the largest revenue share. The growth of the segment is attributed to growing veganism trend among consumers and increasing popularity and consumption of plant-based protein bars.
North America accounted for the largest share of the global nutritional bars market. North America is one of the most significant regions for the nutritional bars market owing to the rising preference for on-the-go snacking, meal replacement, functional food, and indulgence. In addition, the rising vegan population and veganism are boosting the demand for plant-based nutritional bars. Thus, leading manufacturers are launching plant-based nutritional bars to cater to consumers’ demands.
Trends and growth analysis reports related to Food and Beverages : READ MORE..
The List of Companies - Nutritional Bars Market
- The Simply Good Foods Co
- Clif Bar & Co
- General Mills Inc
- The Kellogg Co
- Rise Bar Inc
- The Quaker Oats Co
- Perfect Bar LLC
- Mars Inc
- Kind LLC
- Premier Nutrition Co LLC
The Insight Partners performs research in 4 major stages: Data Collection & Secondary Research, Primary Research, Data Analysis and Data Triangulation & Final Review.
- Data Collection and Secondary Research:
As a market research and consulting firm operating from a decade, we have published and advised several client across the globe. First step for any study will start with an assessment of currently available data and insights from existing reports. Further, historical and current market information is collected from Investor Presentations, Annual Reports, SEC Filings, etc., and other information related to company’s performance and market positioning are gathered from Paid Databases (Factiva, Hoovers, and Reuters) and various other publications available in public domain.
Several associations trade associates, technical forums, institutes, societies and organization are accessed to gain technical as well as market related insights through their publications such as research papers, blogs and press releases related to the studies are referred to get cues about the market. Further, white papers, journals, magazines, and other news articles published in last 3 years are scrutinized and analyzed to understand the current market trends.
- Primary Research:
The primarily interview analysis comprise of data obtained from industry participants interview and answers to survey questions gathered by in-house primary team.
For primary research, interviews are conducted with industry experts/CEOs/Marketing Managers/VPs/Subject Matter Experts from both demand and supply side to get a 360-degree view of the market. The primary team conducts several interviews based on the complexity of the markets to understand the various market trends and dynamics which makes research more credible and precise.
A typical research interview fulfils the following functions:
- Provides first-hand information on the market size, market trends, growth trends, competitive landscape, and outlook
- Validates and strengthens in-house secondary research findings
- Develops the analysis team’s expertise and market understanding
Primary research involves email interactions and telephone interviews for each market, category, segment, and sub-segment across geographies. The participants who typically take part in such a process include, but are not limited to:
- Industry participants: VPs, business development managers, market intelligence managers and national sales managers
- Outside experts: Valuation experts, research analysts and key opinion leaders specializing in the electronics and semiconductor industry.
Below is the breakup of our primary respondents by company, designation, and region:

Once we receive the confirmation from primary research sources or primary respondents, we finalize the base year market estimation and forecast the data as per the macroeconomic and microeconomic factors assessed during data collection.
- Data Analysis:
Once data is validated through both secondary as well as primary respondents, we finalize the market estimations by hypothesis formulation and factor analysis at regional and country level.
- Macro-Economic Factor Analysis:
We analyse macroeconomic indicators such the gross domestic product (GDP), increase in the demand for goods and services across industries, technological advancement, regional economic growth, governmental policies, the influence of COVID-19, PEST analysis, and other aspects. This analysis aids in setting benchmarks for various nations/regions and approximating market splits. Additionally, the general trend of the aforementioned components aid in determining the market's development possibilities.
- Country Level Data:
Various factors that are especially aligned to the country are taken into account to determine the market size for a certain area and country, including the presence of vendors, such as headquarters and offices, the country's GDP, demand patterns, and industry growth. To comprehend the market dynamics for the nation, a number of growth variables, inhibitors, application areas, and current market trends are researched. The aforementioned elements aid in determining the country's overall market's growth potential.
- Company Profile:
The “Table of Contents” is formulated by listing and analyzing more than 25 - 30 companies operating in the market ecosystem across geographies. However, we profile only 10 companies as a standard practice in our syndicate reports. These 10 companies comprise leading, emerging, and regional players. Nonetheless, our analysis is not restricted to the 10 listed companies, we also analyze other companies present in the market to develop a holistic view and understand the prevailing trends. The “Company Profiles” section in the report covers key facts, business description, products & services, financial information, SWOT analysis, and key developments. The financial information presented is extracted from the annual reports and official documents of the publicly listed companies. Upon collecting the information for the sections of respective companies, we verify them via various primary sources and then compile the data in respective company profiles. The company level information helps us in deriving the base number as well as in forecasting the market size.
- Developing Base Number:
Aggregation of sales statistics (2020-2022) and macro-economic factor, and other secondary and primary research insights are utilized to arrive at base number and related market shares for 2022. The data gaps are identified in this step and relevant market data is analyzed, collected from paid primary interviews or databases. On finalizing the base year market size, forecasts are developed on the basis of macro-economic, industry and market growth factors and company level analysis.
- Data Triangulation and Final Review:
The market findings and base year market size calculations are validated from supply as well as demand side. Demand side validations are based on macro-economic factor analysis and benchmarks for respective regions and countries. In case of supply side validations, revenues of major companies are estimated (in case not available) based on industry benchmark, approximate number of employees, product portfolio, and primary interviews revenues are gathered. Further revenue from target product/service segment is assessed to avoid overshooting of market statistics. In case of heavy deviations between supply and demand side values, all thes steps are repeated to achieve synchronization.
We follow an iterative model, wherein we share our research findings with Subject Matter Experts (SME’s) and Key Opinion Leaders (KOLs) until consensus view of the market is not formulated – this model negates any drastic deviation in the opinions of experts. Only validated and universally acceptable research findings are quoted in our reports.
We have important check points that we use to validate our research findings – which we call – data triangulation, where we validate the information, we generate from secondary sources with primary interviews and then we re-validate with our internal data bases and Subject matter experts. This comprehensive model enables us to deliver high quality, reliable data in shortest possible time.

 このレポートの無料サンプルを入手する