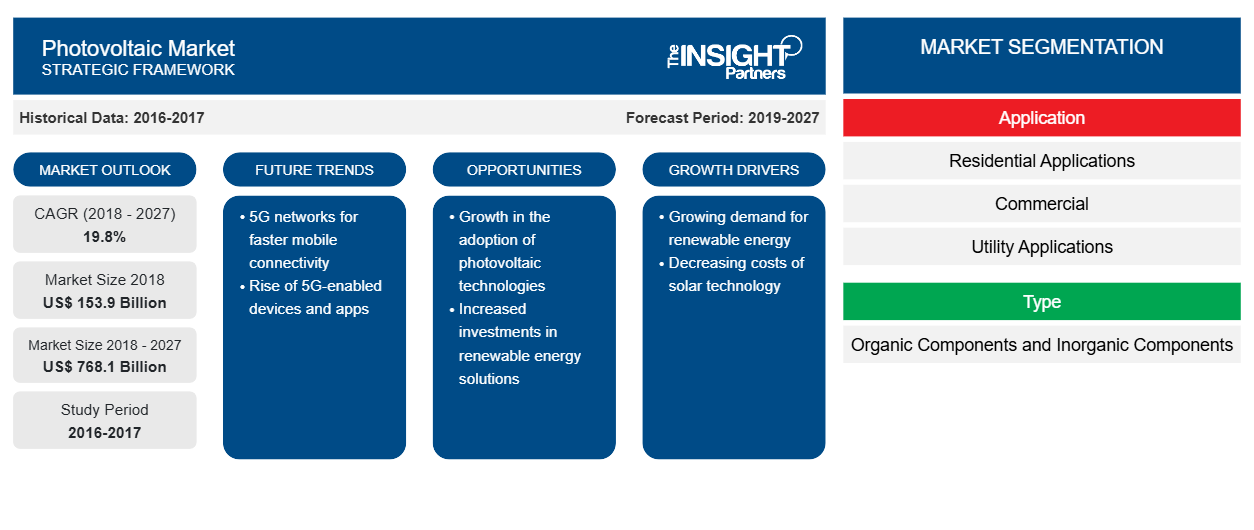
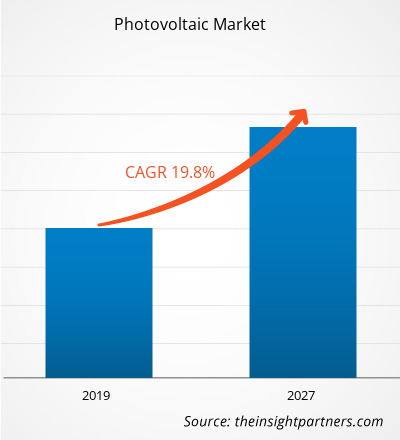
太陽光発電市場は、2019年から2027年の間に年平均成長率19.8%で成長し、2018年の1,539億米ドルから2027年には7,681億米ドルに成長すると予想されています。
技術開発と太陽光発電技術の成長傾向への注目を受けて、ドイツとスペインの政府は、明確な国家目標、消費を促進する魅力的なインセンティブ、太陽エネルギーにおける技術開発とPV技術の採用を促進するための統合計画などの強力な政策枠組みを確立し、太陽光発電市場の成長を促進しています。アジア太平洋地域では、持続可能な環境条件への焦点を高めるとともに、農村部の電化におけるオフグリッドオプションの広範なメリットを最大化するために、全体的なセットアップのコストを最小限に抑えるためのいくつかのイニシアチブが政府によって講じられています。さらに、中国などいくつかの国では、太陽光発電エネルギーの生産レベルを向上させるための政策を確立しています。このように、上記の要因が太陽光発電市場の成長に貢献しています。
太陽光発電(PV)エネルギーは、経済の電力システムのエネルギーバランスに重要な部分を占めることで急速に成長しています。これらのシステムは、主流の発電に利用される成熟した技術として確立されており、太陽光発電市場の成長を牽引しています。ただし、太陽光発電PVシステムは過剰な電力を生成します。世界中の電力会社がネットメータリングを提供しています。これは、グリッド接続された再生可能エネルギーシステムによって生成された余分な電力が電力メーターに戻る仕組みとして定義されています。これにより、無駄がなくなり、必要に応じてエネルギー配分が改善されます。グリッド技術を使用するPVシステムは、バッテリーを必要とするスタンドアロンシステムと比較して、設置容量の約99%を占めています。バッテリーレスのグリッド接続PVは、費用対効果の高いソリューションであると考えられており、メンテナンスの必要性が少ないため、PVベースの製品の採用が増加し、太陽光発電市場のシェアを押し上げます。
さらに、ソーラーパネルに切り替える人にとって、グリッド PV システムは、すべての電気需要を満たすための費用対効果の高いオプションと見なされています。また、スタンドアロン システムの設置は非常に面倒な作業であり、PV グリッド システムよりも多くの資本とスペースが必要です。したがって、PV グリッド システムの採用の増加は、太陽光発電市場の成長をさらに促進します。さらに、再生可能エネルギーの使用への注目が高まり、省エネの傾向が強まるにつれて、グリッド接続 PV システムは経済的に実行可能なオプションであることが証明されています。ただし、その適用範囲は現時点ではかなり限られており、今後数年間で増加する可能性があります。
要件に合わせてレポートをカスタマイズする
このレポートの一部、国レベルの分析、Excelデータパックなど、あらゆるレポートを無料でカスタマイズできます。また、スタートアップや大学向けのお得なオファーや割引もご利用いただけます。
- このレポートの主要な市場動向を入手してください。この無料サンプルには、市場動向から見積もりや予測に至るまでのデータ分析が含まれます。
太陽光発電市場の洞察
太陽エネルギーの利用のための太陽光発電塗料の使用増加
原油価格の変動、水力発電に関する環境問題、核放射線に関連するリスクにより、エネルギー需要を満たす負担が太陽エネルギーに移行しています。技術の進歩、設置コストの削減への重点、住宅用途における太陽光発電技術の急速な利用は、太陽光発電技術の使用を再定義する要因の一部です。太陽エネルギーの使用が増加する時代に、ソーラーペイントの導入は驚くべき成果となりました。ソーラーペイント、または一般に太陽光発電ペイントとして知られるものは、太陽からのエネルギーを捕らえて電気に変換するために、あらゆる表面に塗布できます。ペイントの成分は、その中に浮遊する数十億個の光感応性材料と組み合わされており、一般的なペイントを超強力なエネルギー捕捉ペイントに変換するのに役立ちます。太陽光発電ペイントを使用すると、金属への依存を効果的に下げ、pn接合ダイオードの原理と熱電効果を組み合わせて、太陽光への露出から電気エネルギーを生成できます。したがって、これは太陽エネルギーの採用の増加につながり、最終的には太陽光発電市場の成長を促進するでしょう。Onyx Solar Group LLCなどの企業は、研究開発活動に重点を置き、研究所と協力して太陽光発電塗料を開発し、太陽光発電市場の成長を促進することで技術開発を目指しています。ソーラーペイントまたは太陽光発電塗料技術は現在初期段階にありますが、近い将来に普及する可能性があります。ソーラー産業の進歩と発展により、ソーラーペイントは合理的な選択肢になる絶好の機会があります。したがって、上記の要因は太陽光発電市場にチャンスを生み出しています。
太陽光発電市場の地域別分析
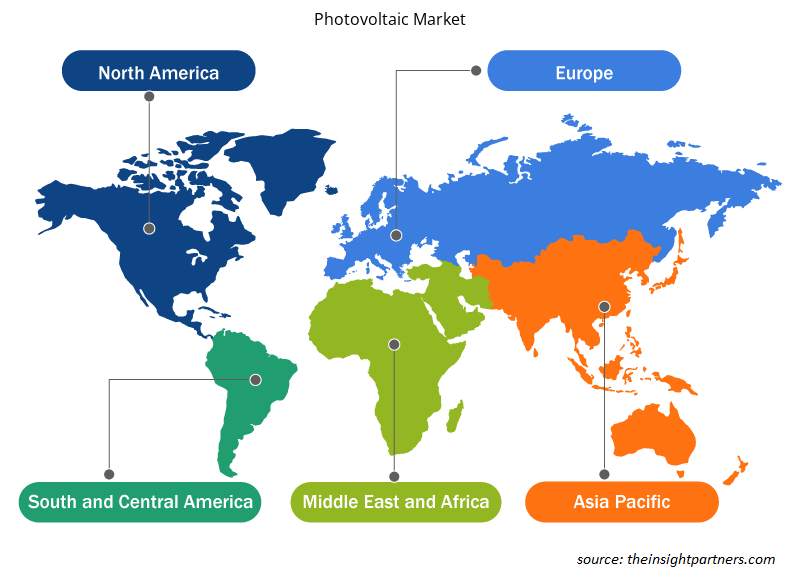
予測期間を通じて太陽光発電市場に影響を与える地域的な傾向と要因は、Insight Partners のアナリストによって徹底的に説明されています。このセクションでは、北米、ヨーロッパ、アジア太平洋、中東、アフリカ、南米、中米にわたる太陽光発電市場のセグメントと地理についても説明します。

- 太陽光発電市場の地域別データを入手
太陽光発電市場レポートの範囲
| レポート属性 | 詳細 |
|---|---|
| 2018年の市場規模 | 1,539億米ドル |
| 2027年までの市場規模 | 7,681億米ドル |
| 世界のCAGR(2018年 - 2027年) | 19.8% |
| 履歴データ | 2016-2017 |
| 予測期間 | 2019-2027 |
| 対象セグメント | アプリケーション別
|
| 対象地域と国 | 北米
|
| 市場リーダーと主要企業プロフィール |
|
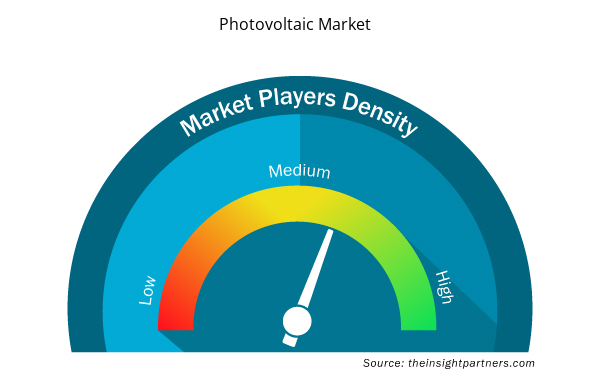
市場プレーヤーの密度:ビジネスダイナミクスへの影響を理解する
太陽光発電市場は、消費者の嗜好の変化、技術の進歩、製品の利点に対する認識の高まりなどの要因により、エンドユーザーの需要が高まり、急速に成長しています。需要が高まるにつれて、企業は提供を拡大し、消費者のニーズを満たすために革新し、新たなトレンドを活用し、市場の成長をさらに促進しています。
市場プレーヤー密度とは、特定の市場または業界内で活動している企業または会社の分布を指します。これは、特定の市場スペースに、その規模または総市場価値と比較して、どれだけの競合相手 (市場プレーヤー) が存在するかを示します。
太陽光発電市場で事業を展開している主要企業は次のとおりです。
- 三菱電機株式会社
- パナソニック株式会社
- カネカ株式会社
- 京セラ株式会社
- シャープ株式会社
免責事項:上記の企業は、特定の順序でランク付けされていません。

- 太陽光発電市場のトップキープレーヤーの概要を入手
コンポーネントベースの市場分析
太陽電池は、2 層以上の半導体材料の薄い層で構成されています。太陽電池で最も一般的に使用される材料はシリコンです。半導体セルは光にさらされて電荷を発生させ、これが金属接点によって直流 (DC) として伝導されるため、PV セルの採用が増えると、予測期間中に世界の太陽光発電市場規模が拡大するでしょう。
太陽光発電市場で事業を展開する企業は、合併、買収、市場イニシアチブなどの戦略を採用して、太陽光発電市場での地位を維持しています。主要企業によるいくつかの動向を以下に示します。
- 2021年、ロイヤル・ダッチ・シェルは25メガワットのカバス太陽光発電施設をオープンした。このプロジェクトは88,000以上のソーラーモジュールで構成され、オマーン北部のソハールフリーゾーンの50ヘクタールの土地に位置している。年間約25,000トンのCO2排出量の削減に貢献している。
- 2021年、ACWA Power社は、同国初の実用規模の再生可能エネルギープロジェクトである300MWのSakaka PV IPPを12億サウジアラビア・リヤルの費用で開始した。ACWA Power社は、1kWhあたり2.3417米ドルセント(1kWhあたり8.781ハララ)という世界記録の価格でこのプロジェクトを受注した。
- 過去2年間の分析、基準年、CAGRによる予測(7年間)
- PEST分析とSWOT分析
- 市場規模価値/数量 - 世界、地域、国
- 業界と競争環境
- Excel データセット


- Electronic Data Interchange Market
- Point of Care Diagnostics Market
- Joint Pain Injection Market
- Neurovascular Devices Market
- Pharmacovigilance and Drug Safety Software Market
- Electronic Toll Collection System Market
- Greens Powder Market
- Data Annotation Tools Market
- Medical Enzyme Technology Market
- Dropshipping Market

Report Coverage
Revenue forecast, Company Analysis, Industry landscape, Growth factors, and Trends

Segment Covered
This text is related
to segments covered.

Regional Scope
North America, Europe, Asia Pacific, Middle East & Africa, South & Central America

Country Scope
This text is related
to country scope.
よくある質問
Renewable energy is regarded as a clean form of energy obtained from natural sources, which can be continuously replenished. Energy derived from renewable sources such as sunlight, wind, tides, and geothermal heat are sustainable and cost-effective. With the increase in population coupled with a rise in industrialization and economic development, the energy requirements have grown consistently, which is posing a burden upon natural resources. For instance, in the US, about 29% of global warming emissions are contributed to the electricity sector. Such emissions are resulted from the utilization of fossil fuels such as coal and natural gas. Over-exploitation and depletion of natural resources along with environmental degradation have led to a shift over renewable forms of energy. The demand for electricity is associated with social and economic development that generates a requirement to shift to renewables in order to tackle climate change and promote sustainability of the environment while meeting energy demands of future generations. Renewable forms of energy generate little or no global warming emissions.
The leading type of photovoltaic type is inorganic components that has noted to account a CAGR of 22.3%. Organic components or solar cells are made of thin films of organic semiconducting materials so as to convert solar energy into electrical energy. A typical organic components device consists of one or more photoactive materials between two electrodes. A primary advantage of organic components technology over inorganic components is its ability to be applied in a large area and flexible solar modules.
The Asia Pacific region led the photovoltaic market with a market share of 52.13%in 2018. Solar energy has brought significant changes to energy usage pattern, from being an alternative source of energy to becoming a primary source of energy for power generation. It is quite evitable with the growing research and development activities focused on the increased production of solar energy, coupled with positive government initiatives and decreasing costs of photovoltaic equipment, in the Asian countries. Further, the diversification in the use of solar energy generation techniques by harnessing various technologies such as PV cell, thermal heating, and concentrated solar power technology is also leading to the growth of this industry.
Trends and growth analysis reports related to Electronics and Semiconductor : READ MORE..
The List of Companies
- Mitsubishi Electric Corporation
- Panasonic Corporation
- Kaneka Corporation
- KYOCERA Corporation
- Sharp Corporation
- JA Solar Co.,Ltd.
- Renesola Co. Ltd
- Trina Solar
- Jinko Solar
- Shunfeng International Clean Energy Co., Ltd.
The Insight Partners performs research in 4 major stages: Data Collection & Secondary Research, Primary Research, Data Analysis and Data Triangulation & Final Review.
- Data Collection and Secondary Research:
As a market research and consulting firm operating from a decade, we have published and advised several client across the globe. First step for any study will start with an assessment of currently available data and insights from existing reports. Further, historical and current market information is collected from Investor Presentations, Annual Reports, SEC Filings, etc., and other information related to company’s performance and market positioning are gathered from Paid Databases (Factiva, Hoovers, and Reuters) and various other publications available in public domain.
Several associations trade associates, technical forums, institutes, societies and organization are accessed to gain technical as well as market related insights through their publications such as research papers, blogs and press releases related to the studies are referred to get cues about the market. Further, white papers, journals, magazines, and other news articles published in last 3 years are scrutinized and analyzed to understand the current market trends.
- Primary Research:
The primarily interview analysis comprise of data obtained from industry participants interview and answers to survey questions gathered by in-house primary team.
For primary research, interviews are conducted with industry experts/CEOs/Marketing Managers/VPs/Subject Matter Experts from both demand and supply side to get a 360-degree view of the market. The primary team conducts several interviews based on the complexity of the markets to understand the various market trends and dynamics which makes research more credible and precise.
A typical research interview fulfils the following functions:
- Provides first-hand information on the market size, market trends, growth trends, competitive landscape, and outlook
- Validates and strengthens in-house secondary research findings
- Develops the analysis team’s expertise and market understanding
Primary research involves email interactions and telephone interviews for each market, category, segment, and sub-segment across geographies. The participants who typically take part in such a process include, but are not limited to:
- Industry participants: VPs, business development managers, market intelligence managers and national sales managers
- Outside experts: Valuation experts, research analysts and key opinion leaders specializing in the electronics and semiconductor industry.
Below is the breakup of our primary respondents by company, designation, and region:

Once we receive the confirmation from primary research sources or primary respondents, we finalize the base year market estimation and forecast the data as per the macroeconomic and microeconomic factors assessed during data collection.
- Data Analysis:
Once data is validated through both secondary as well as primary respondents, we finalize the market estimations by hypothesis formulation and factor analysis at regional and country level.
- Macro-Economic Factor Analysis:
We analyse macroeconomic indicators such the gross domestic product (GDP), increase in the demand for goods and services across industries, technological advancement, regional economic growth, governmental policies, the influence of COVID-19, PEST analysis, and other aspects. This analysis aids in setting benchmarks for various nations/regions and approximating market splits. Additionally, the general trend of the aforementioned components aid in determining the market's development possibilities.
- Country Level Data:
Various factors that are especially aligned to the country are taken into account to determine the market size for a certain area and country, including the presence of vendors, such as headquarters and offices, the country's GDP, demand patterns, and industry growth. To comprehend the market dynamics for the nation, a number of growth variables, inhibitors, application areas, and current market trends are researched. The aforementioned elements aid in determining the country's overall market's growth potential.
- Company Profile:
The “Table of Contents” is formulated by listing and analyzing more than 25 - 30 companies operating in the market ecosystem across geographies. However, we profile only 10 companies as a standard practice in our syndicate reports. These 10 companies comprise leading, emerging, and regional players. Nonetheless, our analysis is not restricted to the 10 listed companies, we also analyze other companies present in the market to develop a holistic view and understand the prevailing trends. The “Company Profiles” section in the report covers key facts, business description, products & services, financial information, SWOT analysis, and key developments. The financial information presented is extracted from the annual reports and official documents of the publicly listed companies. Upon collecting the information for the sections of respective companies, we verify them via various primary sources and then compile the data in respective company profiles. The company level information helps us in deriving the base number as well as in forecasting the market size.
- Developing Base Number:
Aggregation of sales statistics (2020-2022) and macro-economic factor, and other secondary and primary research insights are utilized to arrive at base number and related market shares for 2022. The data gaps are identified in this step and relevant market data is analyzed, collected from paid primary interviews or databases. On finalizing the base year market size, forecasts are developed on the basis of macro-economic, industry and market growth factors and company level analysis.
- Data Triangulation and Final Review:
The market findings and base year market size calculations are validated from supply as well as demand side. Demand side validations are based on macro-economic factor analysis and benchmarks for respective regions and countries. In case of supply side validations, revenues of major companies are estimated (in case not available) based on industry benchmark, approximate number of employees, product portfolio, and primary interviews revenues are gathered. Further revenue from target product/service segment is assessed to avoid overshooting of market statistics. In case of heavy deviations between supply and demand side values, all thes steps are repeated to achieve synchronization.
We follow an iterative model, wherein we share our research findings with Subject Matter Experts (SME’s) and Key Opinion Leaders (KOLs) until consensus view of the market is not formulated – this model negates any drastic deviation in the opinions of experts. Only validated and universally acceptable research findings are quoted in our reports.
We have important check points that we use to validate our research findings – which we call – data triangulation, where we validate the information, we generate from secondary sources with primary interviews and then we re-validate with our internal data bases and Subject matter experts. This comprehensive model enables us to deliver high quality, reliable data in shortest possible time.


 このレポートの無料サンプルを入手する