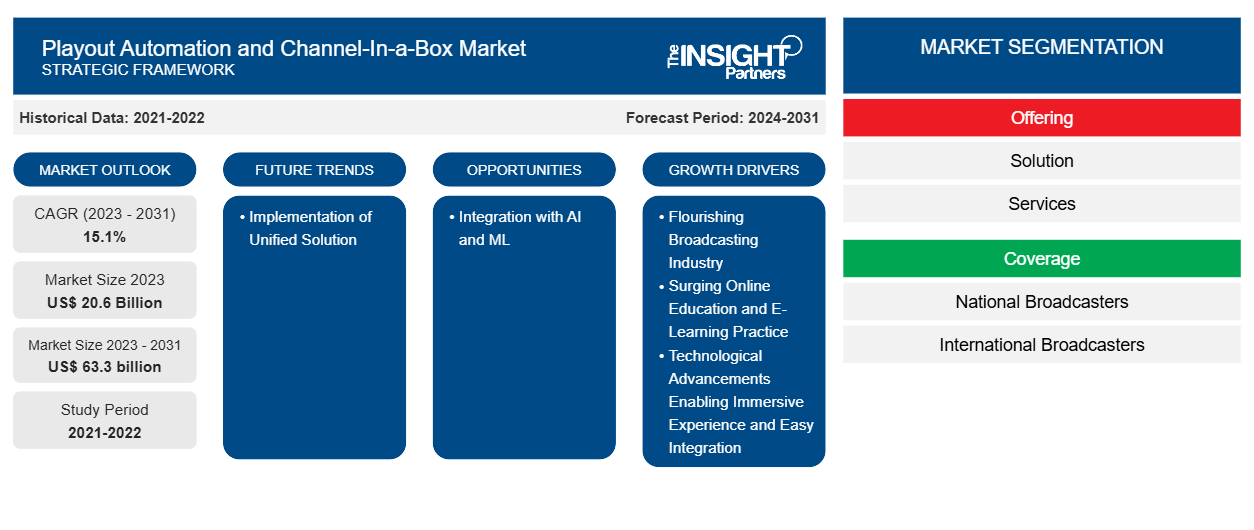
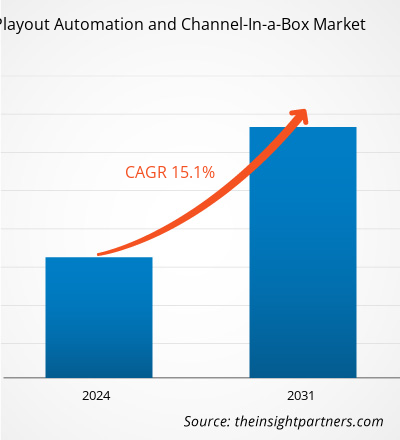
プレイアウト自動化およびチャンネル・イン・ア・ボックスの市場規模は、2023年に206億米ドルと評価され、2031年までに633億米ドルに達すると予想されています。また、2023年から2031年にかけて15.1%のCAGRを記録すると予測されています。統合ソリューションの実装は、今後も市場の主要なトレンドであり続けると思われます。
プレイアウト自動化とチャンネルインアボックス市場分析
市場では、高解像度 (HD) コンテンツと超高解像度 (UHD) コンテンツの統合など、チャンネルのプレゼンテーションの品質と視聴者エクスペリエンスを向上させる技術の進歩が今後も続くでしょう。高度にカスタマイズ可能なプレイアウト自動化およびチャンネルインアボックスソリューションの需要が高まっています。放送局は、独自のパーソナライズされたコンテンツを視聴者に提供できるように、特定の要件に合わせて調整できるソリューションを求めています。ストリーミングプラットフォームなどの OTT サービスの人気が高まるにつれて、これらのプラットフォームにコンテンツを効率的に配信できるプレイアウト自動化およびチャンネルインアボックスソリューションの需要が高まっています。エンターテイメント、ニュース、スポーツ、ライフスタイルなど、さまざまな業界でビデオコンテンツの需要が高まっているため、プレイアウト自動化およびチャンネルインアボックスの市場規模は急増すると予想され、プレイアウト自動化およびチャンネルインアボックスソリューションプロバイダーがこの需要に応える機会を提供します。
プレイアウト自動化とチャンネルインアボックス市場の概要
プレイアウト自動化とは、ソース メディアとチャンネル コンテンツを外部のオンエア環境に変換して再生するために必要な放送プロセス、機器、ソフトウェアの自動化を指します。これには、コンテンツのスケジュール設定、管理、視聴者への配信が含まれます。プレイアウト自動化システムは、コンテンツの取り込み、保存、プレイリスト管理、グラフィックスの挿入、送信制御などのタスクを処理できます。これらのシステムの目的は、効率性の向上、人的エラーの削減、スムーズで中断のない放送の実現です。チャンネル イン ア ボックス (CiaB) のコンセプトは、チャンネル信号を生成するために必要な複数の機能を 1 つの機器に統合することです。ビデオ プレイアウト サーバー、自動化ソフトウェア、グラフィックス、その他の必要なコンポーネントを 1 つのシステムに統合します。チャンネル イン ア ボックス システムは、チャンネルの作成とプレイアウトのためのオールインワン ソリューションを提供することで、放送ワークフローを簡素化するように設計されています。コンテンツのスケジュール設定、グラフィックスの挿入、ロゴ ブランディング、信号処理などの機能をすべて 1 つのデバイスで提供します。
プレイアウト自動化およびチャンネルインアボックス サービスの採用を推進する主な要因の 1 つは、放送業界におけるグローバル ブランドの存在感と可用性の向上です。放送局やコンテンツ プロバイダーがリーチを拡大し、高品質のコンテンツを配信しようとするにつれて、プレイアウト自動化やチャンネルインアボックス システムなど、効率的でコスト効率の高い運用を実現するソリューションの需要が過去数十年間で高まっています。これらのテクノロジには、運用の合理化、ハードウェア要件の削減、拡張性の向上、コンテンツ管理の柔軟性の向上など、数多くの利点があります。放送局はこれらのテクノロジを使用して、反復タスクを自動化し、リソース使用率を最適化し、視聴者にコンテンツをより効率的かつ確実に配信できます。
要件に合わせてレポートをカスタマイズする
このレポートの一部、国レベルの分析、Excelデータパックなど、あらゆるレポートを無料でカスタマイズできます。また、スタートアップや大学向けのお得なオファーや割引もご利用いただけます。
プレイアウト自動化とチャンネル・イン・ア・ボックス市場:
- このレポートの主要な市場動向を入手してください。この無料サンプルには、市場動向から見積もりや予測に至るまでのデータ分析が含まれます。
プレイアウト自動化とチャンネルインアボックス市場の推進要因と機会
AIとMLテクノロジーの統合
放送業界で採用されているツール、ソリューション、プロセスに人工知能 (AI) と機械学習 (ML) のテクノロジーを統合すると、ワークフローの柔軟性と効率性にプラスの影響を与えることができます。AI はクローズド キャプション システムで使用されており、このシステムでは、一部の人にとっては理解しにくい言葉であっても、人が話す言葉を正確にキャプションできるようトレーニングされています。AI システムは、語形変化、アクセント、発音を翻訳して、読みやすいテキストに変換します。このように、さまざまな AI 実装によって、メディアおよび放送業界のワークフローを強化できる可能性があります。
2023 NAB Showの出展者は、さまざまなAIおよびMLベースのソリューションを使用して、放送業界の精度と効率を向上させる方法を展示しました。さらに、テレビ放送局は、顧客に提供するサービスの品質を維持しながら、運用を節約する方法を見つけることができます。プレイアウト自動化とチャンネルインアボックスへのAIとMLの実装により、企業は視聴者の嗜好を理解して予測し、視聴者のエンゲージメントを最大化することができます。さらに、MLモデルは、顧客や視聴者の履歴データから学習することにより、市場プレーヤーが効率的なスケジュールを立てるのに役立ちます。このように、AIとMLテクノロジーの採用は、プレイアウト自動化とチャンネルインアボックス市場のプレーヤーがより多くの顧客を獲得するのに役立ち、それによって今後数年間で成長の機会を生み出します。
プレイアウト自動化とチャンネルインアボックス市場レポートのセグメンテーション分析
プレイアウト自動化およびチャネルインアボックス市場分析の導出に貢献した主要なセグメントは、提供、カバレッジ、垂直、およびアプリケーションです。
- 提供内容に基づいて、プレイアウト自動化およびチャンネルインボックス市場はソリューションとサービスに分かれています。ソリューションセグメントは2023年に最大の市場シェアを占めました。プレイアウト自動化およびチャンネルインボックスソリューションは、現代の放送に不可欠であり、コンテンツの管理と放送に対する合理化された効率的なアプローチを提供します。プレイアウト自動化およびチャンネルインボックスシステムのハードウェアコンポーネントには、サーバー、グラフィックエンジン、キャプチャカード、ネットワークと機器が含まれます。
- カバレッジの面では、市場は国内放送局と国際放送局に分かれています。国内放送局セグメントは、2023 年に市場の大きなシェアを占めました。国内放送局は、情報、娯楽、文化コンテンツを大勢の視聴者に配信する上で重要な役割を果たしています。24 時間 365 日の放送を必要とする急速に進化する放送環境において、国内放送局はプレイアウト自動化とチャンネルインボックス ソリューションを活用して、運用を合理化し、放送の継続性を確保しています。
- 垂直的には、市場はメディアとエンターテインメント、通信、教育および企業部門、その他に分類されます。メディアとエンターテインメントのセグメントは、2023年に市場でより大きなシェアを占めました。プレイアウト自動化チャンネルインボックスソリューションは、メディアおよびエンターテインメントコンテンツの放送局が最高のコンテンツを入手するための優れたオプションです。このソリューションは、メディアファイルを効率的に保存、管理、配布する方法を提供し、より多くの視聴者にリーチすることを容易にします。放送局またはコンテンツ所有者は、メディア管理に関連する作業の多くを外部のプレイアウト自動化サービスプロバイダーにオフロードできるため、間接費を削減し、メディアの使用方法とタイミングをより細かく制御できます。
- アプリケーションの観点から見ると、市場は放送、ケーブル、ストリーミング、その他に分類されます。ストリーミングセグメントは2023年に最大の市場シェアを占めました。プレイアウト自動化システムは、テレビ番組、コマーシャル、その他のコンテンツの送信をスケジュールおよび制御するために使用されます。この自動化は、ライブストリーミングイベント、ニュースチャンネル、および従来のテレビ放送を模倣したリニアストリーミングサービスに役立ちます。自動化により、視聴者データに基づいてターゲットを絞った広告を配信できる動的広告挿入(DAI)が容易になります。
プレイアウト自動化とチャネルインアボックスの地域別市場シェア分析
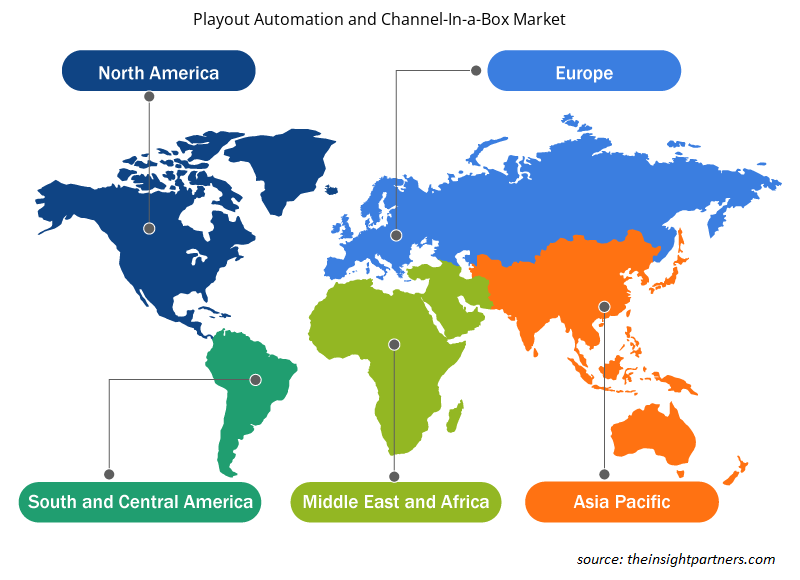
プレイアウト自動化およびチャンネル・イン・ア・ボックス市場レポートの地理的範囲は、主に北米、アジア太平洋、ヨーロッパ、中東およびアフリカ、南米および中米の 5 つの地域に分かれています。
アジア太平洋地域の市場は著しい成長を遂げています。アジア太平洋地域(APAC)のプレイアウト自動化およびチャンネルインボックス市場は、オーストラリア、インド、中国、日本、韓国、その他のAPACに分かれています。人口が多く、デジタル経済が成長している多様性のある地域です。APACではインターネット普及率が大幅に上昇し、データ消費が急増しています。GSM協会によると、IT業界は世界中の接続性を拡大する上で重要な役割を果たしてきました。2021年には、APACは世界のインターネット加入者全体の約59%を占め、2025年までにその数は62%に達すると予測されています。さらに、5Gネットワークの展開により、データ速度の高速化、レイテンシの低減、データデバイス密度の向上が可能になり、インターネットの利用が増加すると予想されています。 GSM協会によると、2021年のAPACの5Gユーザー数は約8%で、そのシェアは2025年までに25%まで急増すると予測されています。したがって、放送におけるインターネットの普及と5Gの展開は、シームレスで高品質のコンテンツの必要性を示しています。インターネットにアクセスする人が増えるにつれて、この地域では消費者によるOTTコンテンツとライブストリーミングの需要が高まっており、放送局は効率を高めて強化されたスケジュールでシームレスにコンテンツを配信するさまざまなソリューションを使用する必要に迫られています。この要因により、APACではプレイアウト自動化とチャンネルインアボックスの採用が促進されています。
ワールド フットボール サミット (WFS) の Web サイトの情報によると、ビデオ品質の向上、高度なクラウド テクノロジー、世界的なインターネット消費が、アジア太平洋地域の放送業界とオーバー ザ トップ (OTT) ストリーミング サービスの発展を牽引する主な要因となっています。さらに、インドや中国などのアジア太平洋諸国でサッカー人気が高まっていることから、これらの国での放送チャンネルの必要性が強調されています。BB メディアによると、アジア太平洋地域はライブ スポーツ コンテンツの視聴率が最も高い地域であり、サッカーはスポーツ コンテンツの消費量が最も高いスポーツです。このように、放送業界の繁栄は、アジア太平洋地域のプレイアウト自動化とチャンネル イン ア ボックス市場の促進要因となっています。
プレイアウト自動化と Channel-In-a-Box 市場の地域別インサイト
予測期間を通じてプレイアウト自動化およびチャンネルインアボックス市場に影響を与える地域的な傾向と要因は、Insight Partners のアナリストによって徹底的に説明されています。このセクションでは、プレイアウト自動化およびチャンネルインアボックス市場のセグメントと、北米、ヨーロッパ、アジア太平洋、中東、アフリカ、南米、中米の地域についても説明します。
- プレイアウト自動化とチャンネルインアボックス市場の地域別データを入手
プレイアウト自動化とチャンネルインアボックス市場レポートの範囲
| レポート属性 | 詳細 |
|---|---|
| 2023年の市場規模 | 206億米ドル |
| 2031年までの市場規模 | 633億米ドル |
| 世界のCAGR(2023年~2031年) | 15.1% |
| 履歴データ | 2021-2022 |
| 予測期間 | 2024-2031 |
| 対象セグメント | 提供することで
|
| 対象地域と国 | 北米
|
| 市場リーダーと主要企業プロフィール |
|
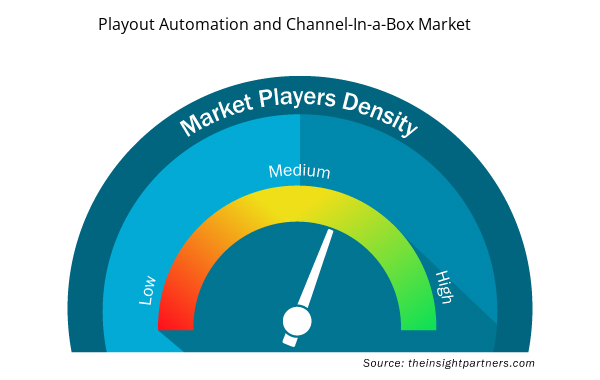
プレイアウト自動化とチャネルインアボックス市場のプレーヤー密度:ビジネスダイナミクスへの影響を理解する
プレイアウト自動化および Channel-In-a-Box 市場は、消費者の嗜好の変化、技術の進歩、製品の利点に対する認識の高まりなどの要因により、エンドユーザーの需要が高まり、急速に成長しています。需要が高まるにつれて、企業は提供内容を拡大し、消費者のニーズを満たすために革新し、新たなトレンドを活用し、市場の成長をさらに促進しています。
市場プレーヤー密度とは、特定の市場または業界内で活動している企業または会社の分布を指します。これは、特定の市場スペースに、その規模または総市場価値と比較して、どれだけの競合相手 (市場プレーヤー) が存在するかを示します。
プレイアウト自動化およびチャンネル・イン・ア・ボックス市場で事業を展開している主要企業は次のとおりです。
- エバーツテクノロジーズ株式会社
- ハーモニック株式会社
- ペブルビーチシステムズ
- グラスバレーカナダ
- アビッドテクノロジー株式会社
- イマジンコミュニケーションズ
免責事項:上記の企業は、特定の順序でランク付けされていません。
- プレイアウト自動化とチャンネルインアボックス市場のトップキープレーヤーの概要を入手
プレイアウト自動化とチャンネルインアボックスの市場ニュースと最近の動向
プレイアウト自動化およびチャンネル・イン・ア・ボックス市場は、主要な企業出版物、協会データ、データベースなどの一次および二次調査後の定性的および定量的データを収集することによって評価されます。プレイアウト自動化およびチャンネル・イン・ア・ボックス市場の動向のいくつかを以下に示します。
- Imagine Communications は、Aviator Automation のリリースにより、メディア企業があらゆる場所で効率的にチャネルを運用できるようにしています。この画期的な自動化ソリューションにより、オンプレミスとクラウドの統合エコシステムでマルチサイトおよびマルチモーダル チャネルの配信が可能になります。Aviator Automation は、チャネルを実行するリソースがどこにあっても、プレイアウト、マスター コントロール、ライブ統合のための共通制御システムを提供し、リニア チャネルとコネクテッド TV (CTV) チャネル間でシームレスな運用調整を実現します。(出典: Imagine Communications、プレス リリース、2024 年 3 月)
プレイアウト自動化と Channel-In-a-Box 市場レポートのカバレッジと成果物
「プレイアウト自動化およびチャンネル・イン・ア・ボックス市場規模と予測(2021~2031年)」レポートでは、以下の分野をカバーする市場の詳細な分析を提供しています。
- プレイアウト自動化とチャンネルインアボックスの市場規模と予測(対象範囲に含まれるすべての主要市場セグメントについて、世界、地域、国レベルで)
- プレイアウト自動化とチャンネルインアボックスの市場動向、および推進要因、制約、主要な機会などの市場動向
- 詳細なPEST/ポーターの5つの力とSWOT分析
- プレイアウト自動化とチャンネルインアボックス市場分析では、主要な市場動向、世界および地域の枠組み、主要プレーヤー、規制、最近の市場動向を取り上げています。
- プレイアウト自動化およびチャンネルインアボックス市場の市場集中、ヒートマップ分析、主要プレーヤー、最近の動向を網羅した業界展望と競争分析
- 詳細な企業プロフィール
- 過去2年間の分析、基準年、CAGRによる予測(7年間)
- PEST分析とSWOT分析
- 市場規模価値/数量 - 世界、地域、国
- 業界と競争環境
- Excel データセット

Report Coverage
Revenue forecast, Company Analysis, Industry landscape, Growth factors, and Trends

Segment Covered
This text is related
to segments covered.

Regional Scope
North America, Europe, Asia Pacific, Middle East & Africa, South & Central America

Country Scope
This text is related
to country scope.
よくある質問
Flourishing broadcasting industry; surging online education and e-learning practice; and technological advancements enabling immersive experience and easy integration are driving the market growth.
The market is expected to reach a value of US$ 63.3 billion by 2031.
Implementation of unified solution is a key trend in the market.
Evertz; Pebble Beach Systems; Imagine Communications; Avid Technology, Inc.; and Grass Valley are major players operating in the market.
Asia Pacific dominated the playout automation and channel-in-a-box market in 2023.
The market is anticipated to expand at a CAGR of 15.1% during 2023–2031.
Trends and growth analysis reports related to Technology, Media and Telecommunications : READ MORE..
The List of Companies -Playout Automation & Channel-in-a-Box Market
- Evertz Technologies Ltd
- Harmonic Inc
- Pebble Beach Systems
- Grass Valley Canada
- Avid Technology, Inc.
- Imagine Communications
- Amagi
- Playbox Technology
- Aveco s.r.o.
- ENCO Systems, Inc.
The Insight Partners performs research in 4 major stages: Data Collection & Secondary Research, Primary Research, Data Analysis and Data Triangulation & Final Review.
- Data Collection and Secondary Research:
As a market research and consulting firm operating from a decade, we have published and advised several client across the globe. First step for any study will start with an assessment of currently available data and insights from existing reports. Further, historical and current market information is collected from Investor Presentations, Annual Reports, SEC Filings, etc., and other information related to company’s performance and market positioning are gathered from Paid Databases (Factiva, Hoovers, and Reuters) and various other publications available in public domain.
Several associations trade associates, technical forums, institutes, societies and organization are accessed to gain technical as well as market related insights through their publications such as research papers, blogs and press releases related to the studies are referred to get cues about the market. Further, white papers, journals, magazines, and other news articles published in last 3 years are scrutinized and analyzed to understand the current market trends.
- Primary Research:
The primarily interview analysis comprise of data obtained from industry participants interview and answers to survey questions gathered by in-house primary team.
For primary research, interviews are conducted with industry experts/CEOs/Marketing Managers/VPs/Subject Matter Experts from both demand and supply side to get a 360-degree view of the market. The primary team conducts several interviews based on the complexity of the markets to understand the various market trends and dynamics which makes research more credible and precise.
A typical research interview fulfils the following functions:
- Provides first-hand information on the market size, market trends, growth trends, competitive landscape, and outlook
- Validates and strengthens in-house secondary research findings
- Develops the analysis team’s expertise and market understanding
Primary research involves email interactions and telephone interviews for each market, category, segment, and sub-segment across geographies. The participants who typically take part in such a process include, but are not limited to:
- Industry participants: VPs, business development managers, market intelligence managers and national sales managers
- Outside experts: Valuation experts, research analysts and key opinion leaders specializing in the electronics and semiconductor industry.
Below is the breakup of our primary respondents by company, designation, and region:

Once we receive the confirmation from primary research sources or primary respondents, we finalize the base year market estimation and forecast the data as per the macroeconomic and microeconomic factors assessed during data collection.
- Data Analysis:
Once data is validated through both secondary as well as primary respondents, we finalize the market estimations by hypothesis formulation and factor analysis at regional and country level.
- Macro-Economic Factor Analysis:
We analyse macroeconomic indicators such the gross domestic product (GDP), increase in the demand for goods and services across industries, technological advancement, regional economic growth, governmental policies, the influence of COVID-19, PEST analysis, and other aspects. This analysis aids in setting benchmarks for various nations/regions and approximating market splits. Additionally, the general trend of the aforementioned components aid in determining the market's development possibilities.
- Country Level Data:
Various factors that are especially aligned to the country are taken into account to determine the market size for a certain area and country, including the presence of vendors, such as headquarters and offices, the country's GDP, demand patterns, and industry growth. To comprehend the market dynamics for the nation, a number of growth variables, inhibitors, application areas, and current market trends are researched. The aforementioned elements aid in determining the country's overall market's growth potential.
- Company Profile:
The “Table of Contents” is formulated by listing and analyzing more than 25 - 30 companies operating in the market ecosystem across geographies. However, we profile only 10 companies as a standard practice in our syndicate reports. These 10 companies comprise leading, emerging, and regional players. Nonetheless, our analysis is not restricted to the 10 listed companies, we also analyze other companies present in the market to develop a holistic view and understand the prevailing trends. The “Company Profiles” section in the report covers key facts, business description, products & services, financial information, SWOT analysis, and key developments. The financial information presented is extracted from the annual reports and official documents of the publicly listed companies. Upon collecting the information for the sections of respective companies, we verify them via various primary sources and then compile the data in respective company profiles. The company level information helps us in deriving the base number as well as in forecasting the market size.
- Developing Base Number:
Aggregation of sales statistics (2020-2022) and macro-economic factor, and other secondary and primary research insights are utilized to arrive at base number and related market shares for 2022. The data gaps are identified in this step and relevant market data is analyzed, collected from paid primary interviews or databases. On finalizing the base year market size, forecasts are developed on the basis of macro-economic, industry and market growth factors and company level analysis.
- Data Triangulation and Final Review:
The market findings and base year market size calculations are validated from supply as well as demand side. Demand side validations are based on macro-economic factor analysis and benchmarks for respective regions and countries. In case of supply side validations, revenues of major companies are estimated (in case not available) based on industry benchmark, approximate number of employees, product portfolio, and primary interviews revenues are gathered. Further revenue from target product/service segment is assessed to avoid overshooting of market statistics. In case of heavy deviations between supply and demand side values, all thes steps are repeated to achieve synchronization.
We follow an iterative model, wherein we share our research findings with Subject Matter Experts (SME’s) and Key Opinion Leaders (KOLs) until consensus view of the market is not formulated – this model negates any drastic deviation in the opinions of experts. Only validated and universally acceptable research findings are quoted in our reports.
We have important check points that we use to validate our research findings – which we call – data triangulation, where we validate the information, we generate from secondary sources with primary interviews and then we re-validate with our internal data bases and Subject matter experts. This comprehensive model enables us to deliver high quality, reliable data in shortest possible time.
 このレポートの無料サンプルを入手する