
データセンター向けプラグ可能光学機器市場レポート 2031 - セグメント、地域、動向、最近の動向、戦略的洞察
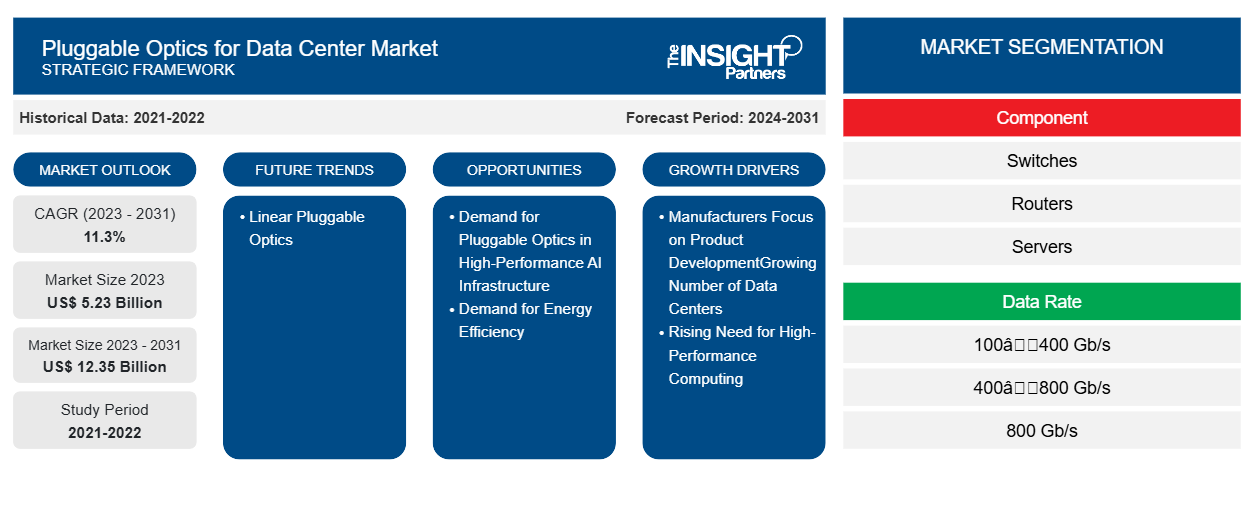
データセンター向けプラガブルオプティクス市場の規模と予測(2021年~2031年)、世界および地域のシェア、トレンド、成長機会分析レポートの対象範囲:コンポーネント別(スイッチ、ルーター、サーバー)、データレート別(100~400 Gb/s、400~800 Gb/s、800 Gb/s以上)、地域別
- ステータス : 出版
- レポートコード : TIPRE00039321
- カテゴリー : エレクトロニクスおよび半導体
- ページ数 : 171
- 利用可能なレポート形式 :


- 最終更新日 : October 08, 2024

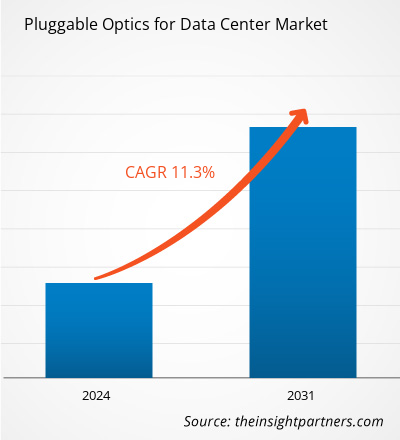
データセンター向けプラグ可能光学部品の市場規模は、2023年に52億3,000万米ドルと評価され、2031年までに123億5,000万米ドルに達すると予想されています。データセンター向けプラグ可能光学部品市場は、2023年から2031年にかけて11.3%のCAGRを記録すると予測されています。予測期間中、市場では線形プラグ可能光学部品の拡大がトレンドになる可能性があります。
データセンター向けプラグ可能光学機器市場分析
モノのインターネット (IoT) の採用の増加、膨大な量のデータのストレージに対するニーズの高まり、デジタル化の進展により、データセンターの需要が高まっています。データセンターは、企業が膨大なデータに迅速かつ安全にアクセスできるようにする優れたデータストレージソリューションです。集中型のデータ管理、拡張性、セキュリティにより、企業はデータ主導のビジネス環境を実現するためにこれらのソリューションを採用するようになっています。そのため、多くの企業が北米でのデータセンターの開発に投資しています。Linklaters によると、北米はデータセンターの取引額でリードを維持しており、2023 年の世界総額の 62%、2024 年 4 月までの投資額の 69% を占め、総額は 150 億米ドルに達し、米国が最大のシェアを占めています。
プラグ可能な概要
プラガブル光学部品は、スイッチ、ルーター、サーバーなどのさまざまなネットワーク コンポーネントを接続して、高速電気信号を光信号に、またはその逆に変換する交換可能なトランシーバー モジュールです。プラガブル光学部品は、柔軟性、拡張性、および幅広いネットワーク デバイスや標準との互換性があるため、データ センター光学部品で最も一般的に使用されています。プラガブル光学部品の利点の 1 つは、他の光相互接続が光を使用してコンピューティング アーキテクチャ内でデータを送信しているのに対し、ユーザーがモジュール内のトランシーバーをデータ レートやその他のネットワーク アーキテクチャ要件に合わせて調整できることです。プラガブル光学部品のコスト効率、幅広い互換性、消費電力の削減などの利点により、データ センターでの需要が高まっています。プラガブル光学部品は通常、高速で低電力のソリューションであり、さまざまな他のデバイスと互換性があります。
要件に合わせてレポートをカスタマイズする
このレポートの一部、国レベルの分析、Excelデータパックなど、あらゆるレポートを無料でカスタマイズできます。また、スタートアップや大学向けのお得なオファーや割引もご利用いただけます。
データセンター市場向けプラガブルオプティクス:戦略的洞察
-
このレポートの主要な市場動向を入手してください。この無料サンプルには、市場動向から見積もりや予測に至るまでのデータ分析が含まれます。
データセンター向けプラガブルオプティクス市場の推進要因と機会
市場を有利にする製品開発に注力
プラガブル光学部品により、データセンター事業者はケーブルシステムを完全に再構築することなく、トランシーバーを簡単にアップグレードまたは交換できます。データセンターにおけるプラガブル光学部品の需要の高まりにより、メーカーは顧客の動的な要件を満たすことができる新しい革新的な製品を開発するよう促されています。たとえば、2024年3月、Infinera Corporationはデータセンター内接続を改善する新しいICE-D製品ラインを発表しました。ICE-Dは、モノリシックリン化インジウム(InP)とフォトニック集積回路(PIC)技術に基づく高速データセンター内光学部品の新しい製品ラインです。ICE-D光学部品は、1.6テラビット/秒(Tb/s)以上の速度でデータセンター内接続を提供しながら、ビットあたりのコストと電力を大幅に削減するように設計されています。この技術により、データセンター事業者はコスト効率を保ちながら、ますます高まる帯域幅の需要に対応できます。
エネルギー効率に対する需要の高まり
グリーン データ センターの出現は、エネルギー効率に対する需要の高まりに寄与するもう 1 つの要因です。グリーン データ センターは、エネルギー効率の高い技術を使用してエネルギー消費と環境への影響を削減する持続可能なデータ センターです。企業は、データ センターのコストを削減し、炭素の影響を最小限に抑えるために、グリーン データ センターに移行しています。これは、エネルギー効率の高い機器とコンポーネントを使用することで実現できます。これにより、エネルギー効率が高いため、コンパクトで高度に統合されたプラグ可能な光学部品の需要が生まれます。プラグ可能な光学部品を設置すると、冷却コストなどのネットワーク運用コストを節約できます。したがって、エネルギー効率の高いソリューションの需要は、プラグ可能な光学部品の導入につながる重要な要因であり、データ センター市場の成長のためのプラグ可能な光学部品にとって有利な機会を生み出す可能性があります。
データセンター向けプラグ可能光学機器市場レポートのセグメンテーション分析
データ センター市場分析用のプラグ可能な光学部品の導出に貢献した主要なセグメントは、コンポーネントとデータ レートです。
- コンポーネント別に見ると、市場はスイッチ、ルーター、サーバーに分かれています。2023年にはスイッチセグメントが市場を支配しました。
- データレートに基づいて、市場は100〜400 Gb/s、400〜800 Gb/s、800 Gb/s以上に分類されます。2023年には400〜800 Gb/sセグメントが市場を支配しました。
データセンター向けプラグ可能光学機器の地域別市場シェア分析
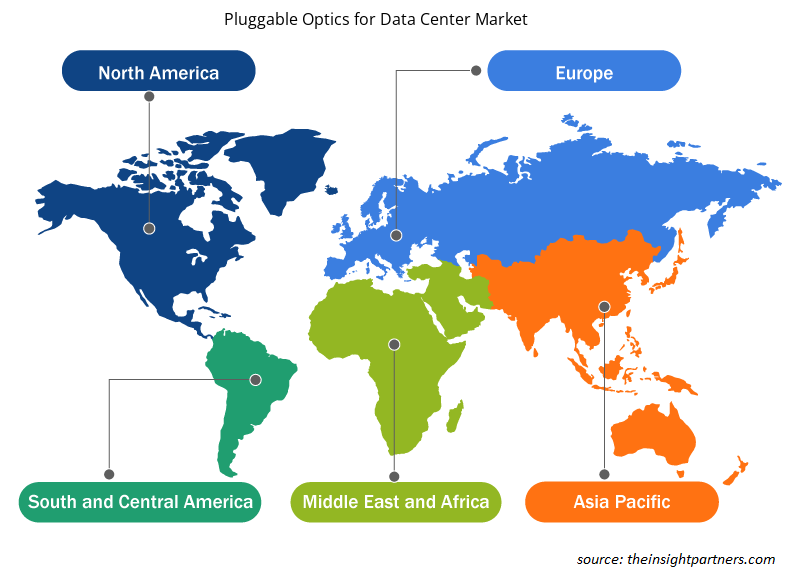
データセンター向けプラグ可能光学機器市場レポートの地理的範囲は、主に北米、ヨーロッパ、アジア太平洋 (APAC)、中東およびアフリカ (MEA)、南米 (SAM) の 5 つの地域に分かれています。
ドイツ、フランス、英国、イタリアは、ヨーロッパのデータセンター向けプラガブルオプティクス市場の成長に貢献している主要国です。データの総量は飛躍的に増加しており、ヨーロッパのデータセンター業界では強い需要が生じています。人工知能(AI)、機械学習(ML)、モノのインターネット(IoT)などの急速に拡大する技術により、プラガブルオプティクスの需要が高まっており、今後3〜5年間は供給を上回り続けると予想されています。たとえば、TMT Consultants Ltdが2024年6月に発表したデータによると、ヨーロッパのデータセンターではAI技術とデータストレージ容量の使用が増加しています。
ドイツのデータセンター向けプラガブルオプティクス市場は、コロケーションデータセンターへの投資の増加とIT容量の増加により、今後数年間で大幅な成長が見込まれています。ドイツデータセンター協会(GERMAN DATACENTER ASSOCIATION eV)が発行した「データセンターインパクトレポート、ドイツ2024」によると、ドイツのデータセンターは、2029年までにコロケーション容量の拡大のために265億8,000万米ドル(240億ユーロ)以上の投資を受けると予想されています。前述の同じ情報源によると、ドイツのコロケーションデータセンターのIT容量は、2029年までに1.3GWから3.3GWに拡大すると予想されています。データセンターの容量拡大、データ処理需要の増加、データセンター開発への投資増加は、市場を牽引する要因の1つです。
データセンター向けプラグ可能光学機器市場の地域別分析
予測期間を通じてデータセンター向けプラグ可能光学機器市場に影響を与える地域的な傾向と要因は、Insight Partners のアナリストによって徹底的に説明されています。このセクションでは、北米、ヨーロッパ、アジア太平洋、中東、アフリカ、南米、中米にわたるデータセンター向けプラグ可能光学機器市場のセグメントと地域についても説明します。
- データセンター向けプラガブルオプティクス市場の地域別データを入手
データセンター向けプラグ可能光学機器市場レポートの範囲
| レポート属性 | 詳細 |
|---|---|
| 2023年の市場規模 | 52億3千万米ドル |
| 2031年までの市場規模 | 123.5億米ドル |
| 世界のCAGR(2023年~2031年) | 11.3% |
| 履歴データ | 2021-2022 |
| 予測期間 | 2024-2031 |
| 対象セグメント |
コンポーネント別
|
| 対象地域と国 |
北米
|
| 市場リーダーと主要企業プロフィール |
|
市場プレーヤーの密度:ビジネスダイナミクスへの影響を理解する
データ センター向けプラグ可能光学機器市場は、消費者の嗜好の変化、技術の進歩、製品の利点に対する認識の高まりなどの要因により、エンド ユーザーの需要が高まり、急速に成長しています。需要が高まるにつれて、企業は提供内容を拡大し、消費者のニーズを満たすために革新し、新たなトレンドを活用し、市場の成長をさらに促進しています。
市場プレーヤー密度とは、特定の市場または業界内で活動している企業または会社の分布を指します。これは、特定の市場スペースに、その市場規模または総市場価値に対してどれだけの競合相手 (市場プレーヤー) が存在するかを示します。
データセンター向けプラガブル光学部品市場で事業を展開している主要企業は次のとおりです。
- コヒーレント社
- ノキア株式会社
- シスコシステムズ株式会社
- インフィネラ株式会社
- テレフォナクティボラーゲット LM エリクソン
- シエナ社
免責事項:上記の企業は、特定の順序でランク付けされていません。
- データセンター向けプラグ可能光学機器市場のトップキープレーヤーの概要を入手
データセンター向けプラグ可能光学機器の市場ニュースと最近の動向
データ センター向けプラグ可能光学機器市場は、重要な企業出版物、協会データ、データベースなどの一次調査と二次調査後の定性的および定量的データを収集することによって評価されます。データ センター向けプラグ可能光学機器市場における開発のいくつかを以下に示します。
- Nokia Corp は、CSP、ウェブスケール、エンタープライズ顧客向けのメトロ エッジ展開に最適化された新しい光トランスポート ソリューションの包括的なセットを発表しました。同社のポートフォリオの追加には、100 Gb/s、400 Gb/s、800 Gb/s のプラグ可能なコヒーレント モジュール、新しいコンパクトな光トランスポート プラットフォーム、メトロ エッジ アプリケーション向けに最適化された新しいカードが含まれています。(出典: Nokia Corp、プレス リリース、2024 年 3 月)
- Infinera は、ネットワーク インフラストラクチャ ソリューションを提供する日本の APRESIA Systems, Ltd. (APRESIA) とのパートナーシップを拡大し、Infinera のソフトウェア プログラマブル ICE-X コヒーレント プラガブルを APRESIA の現地製造レイヤー 2/3 スイッチングおよび光伝送製品のポートフォリオに統合すると発表しました。Infinera の ICE-X コヒーレント プラガブルにより、APRESIA はアクセス ネットワーク ソリューションを強化し、収益を生み出す新しいサービス、設備投資と運用コストの削減、ファイバー資産の最大限の活用など、運用価値の向上を顧客に提供できるようになります。(出典: Infinera、プレス リリース、2024 年 7 月)
データセンター向けプラグ可能光学機器市場レポートの対象範囲と成果物
「データセンター向けプラガブル光学機器の市場規模と予測(2021~2031年)」レポートでは、以下の分野をカバーする市場の詳細な分析を提供しています。
- データセンター向けプラグ可能光学機器の市場規模と予測(対象範囲に含まれるすべての主要市場セグメントについて、世界、地域、国レベルで)
- データセンター向けプラグ式光学機器の市場動向、推進要因、制約、主要な機会などの市場動向
- 詳細なPEST/ポーターの5つの力とSWOT分析
- 主要な市場動向、世界および地域の枠組み、主要プレーヤー、規制、最近の市場動向を網羅したデータセンター向けプラグ可能光学機器市場分析
- 市場集中、ヒートマップ分析、主要プレーヤー、データセンター向けプラグ可能光学機器市場の最近の動向を網羅した業界展望と競争分析
- 詳細な企業プロフィール

Naveenは、カスタム、シンジケート、コンサルティングの各プロジェクトにおいて9年以上の実績を持つ、経験豊富な市場調査およびコンサルティングのプロフェッショナルです。現在はアソシエイトバイスプレジデントを務め、プロジェクトバリューチェーン全体にわたるステークホルダー管理を成功させ、100件以上の調査レポートと30件以上のコンサルティング案件を執筆しています。産業および政府機関のプロジェクトに幅広く携わり、クライアントの成功とデータに基づく意思決定に大きく貢献しています。
Naveenは、カルナータカ州VTUで電子通信工学の学位を取得し、マニパル大学でマーケティング&オペレーションズのMBAを取得しています。IEEEの会員として9年間活動し、会議や技術シンポジウムへの参加、セクションレベルおよび地域レベルでのボランティア活動に積極的に取り組んでいます。現職以前は、IndustryARCでアソシエイト戦略コンサルタント、Hewlett Packard(HP Global)で産業用サーバーコンサルタントを務めていました。
- 包括的な市場規模および予測分析
- 詳細なセグメンテーション分析
- 市場動向(ダイナミクス)の徹底的な評価
- 地域および国別のインサイト
- 競争環境および企業ベンチマーク
- 戦略的ビジネスインテリジェンス
お客様の声
Insight PartnersのSCADAシステム市場レポートは包括的で、現在のトレンドと将来の予測に関する貴重な洞察が含まれています。チームは終始、非常にプロフェッショナルで、対応が早く、サポートも充実していました。私たちは彼らのサービスに非常に満足しており、強くお勧めします。
ラン・ケデム パートナー, レアリテクノロジーズ株式会社非常に特殊なソフトウェア市場に関するレポートを依頼したところ、チームは数日でレポートを作成してくれました。情報は非常に関連性が高く、分かりやすくまとめられていました。その後、レポートにいくつか修正と追加を依頼しましたが、チームは非常に迅速に対応し、1週間も経たないうちに最終レポートを受け取ることができました。
ジャン=エルヴェ・ジェン 会長, フューチャー・アナリティカ重要な市場調査と予測のために、The Insight Partnersと協力しました。彼らは機会とリスクに関する明確な洞察を提供し、私たちの計画策定に役立ちました。彼らの調査は使いやすく、確かなデータに基づいており、賢明で自信に満ちた意思決定に役立ちました。彼らを強くお勧めします。
ピユーシュ・ナグパル 上級副社長, ハイビームグローバルInsight Partnersは、深い専門知識に基づき、洞察力に富み、構造化された市場調査を提供しました。チームは終始プロフェッショナルで、対応力も抜群でした。ユーザーフレンドリーなウェブサイトにより、業界レポートへのアクセスもスムーズでした。信頼性の高い高品質な調査サービスをお探しなら、Insight Partnersを強くお勧めします。
安達幸彦 最高経営責任者(CEO), ディープブルーLLC。The Insight Partnersから市場レポートを購入するのは今回が初めてです。最初は不安でしたが、ウェブサイトを見て、リスクを負ってでも購入してみようという気持ちになりました。レポートの品質とカスタマーサービスには大変満足しています。最初のレポートにはいくつか質問やコメントがありましたが、アナリストとメールで何度かやり取りした結果、戦略策定プロセスへのインプットとして活用できるレポートが完成しました。貴重なお時間を割いていただき、貴重な体験をさせていただき、誠にありがとうございました。他の方にもぜひお勧めしたいですし、今後さらに市場データが必要になった際には、まずThe Insight Partnersにご連絡させていただきます。
ジョン・スズキ 社長兼最高経営責任者、取締役, BKテクノロジーズナイジェリアの感染症IVD市場に関する情報提供依頼に対し、ご対応いただいた際、ご尽力とプロフェッショナルな姿勢に深く感謝申し上げます。忍耐強く、的確なアドバイスをいただき、また、最終的に取引成立に至った割引のご提供にも深く感謝申し上げます。今回の最初の出会いで得た強い印象のおかげで、今後もThe Insight Partnersとの連携を心待ちにしております。
チジオケ博士 オニア マネージングディレクター, パインクレストヘルスケア株式会社購入理由
- 情報に基づいた意思決定
- 市場動向の理解
- 競合分析
- 顧客インサイト
- 市場予測
- リスク軽減
- 戦略計画
- 投資の正当性
- 新興市場の特定
- マーケティング戦略の強化
- 業務効率の向上
- 規制動向への対応


