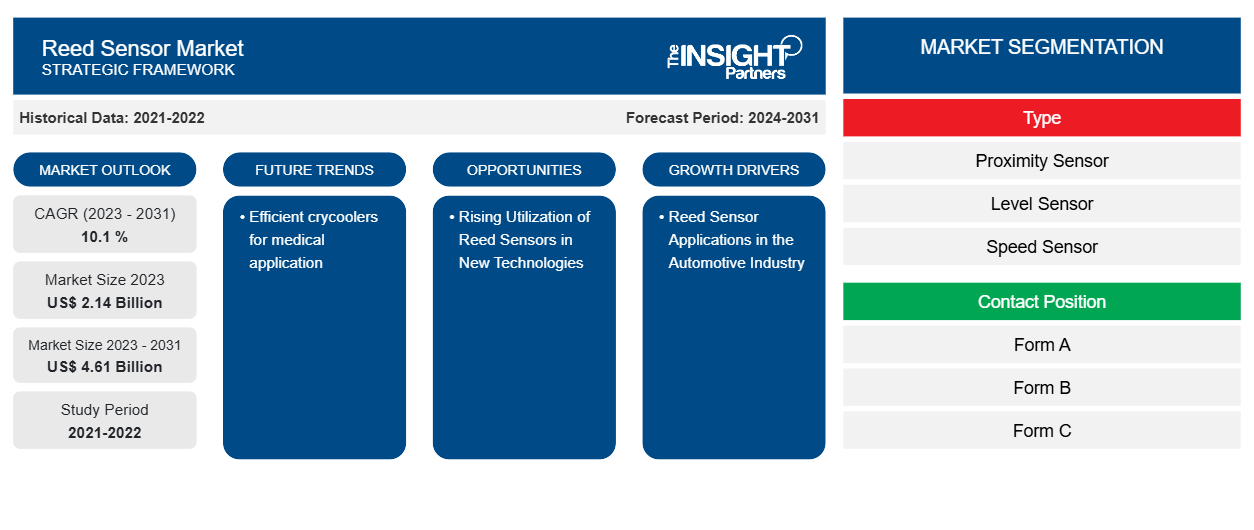
リードセンサー市場規模は、2023年の21億4,000万米ドルから2031年には46億1,000万米ドルに達すると予測されています。市場は2023年から2031年にかけて10.1%のCAGRを記録すると予想されています。幅広い業界で技術開発を促進するさまざまな変数により、需要は急速に増加しています。
リードセンサー市場分析
リード センサーは、信頼性が高く、検出と作動が簡単で、コストが低く、動作に電力を必要としないため、自動車業界、特に自動車の内装で広く使用されています。その結果、自動車業界の拡大により、将来的にリード センサーの使用が促進されると予想されます。ただし、ロボット工学や自動化アプリケーションからのリード センサーの需要は、時間の経過とともに増加すると予想されます。
リードセンサー市場の概要
リード センサーには、シンプルで信頼性の高い感知および作動機能、低コスト、最小限の電力要件、厳しい産業環境における安全性など、さまざまな利点があります。これらの要因は市場の拡大に貢献しています。新しいアプリケーションとテクノロジが開発されるにつれて、市場は勢いを増しています。センサーは、通信、自動車および輸送、消費者向け電子機器および家電、安全とセキュリティ、ヘルスケア、建設、ロボット工学、自動化など、さまざまなアプリケーションで利用されています。
要件に合わせてレポートをカスタマイズする
このレポートの一部、国レベルの分析、Excelデータパックなど、あらゆるレポートを無料でカスタマイズできます。また、スタートアップや大学向けのお得なオファーや割引もご利用いただけます。
- このレポートの主要な市場動向を入手してください。この無料サンプルには、市場動向から見積もりや予測に至るまでのデータ分析が含まれます。
リードセンサー市場の推進要因と機会
自動車産業におけるリードセンサーの応用が市場を有利にする
車には、多くの部品が適切に動作することを確認するためのセンサーが多数搭載されています。リード センサーは、安全性と信頼性を確保するために自動車の内装で広く使用されています。リード センサーは、消費電力が低く寿命が長いため、自動車用途に最適です。リード センサーは、サンバイザー、早期ブレーキ センシング、排気ガス センシング、パワー ウィンドウ、燃料キャップ位置センシング、アンチロック ブレーキ、冷却液流量センシング、不良ランプ検出、低液面監視、バッテリー寿命インジケーター、シートベルト ロック センシング、エアバッグ展開防止、ドア センサー、クルーズ コントロール、パワー ステアリングなど、さまざまな自動車用途で使用されています。自動車業界の成長がリード センサー市場を牽引しています。
新技術におけるリードセンサーの利用増加
新興技術におけるリード センサーの使用が増えると、新しい市場の可能性が生まれ、市場の成長ペースが加速します。センサーとスイッチ技術の技術的進歩の結果として、小型化と非常に信頼性の高いリード スイッチへの傾向は、さまざまなエンド ユーザー産業でリード センサーの推進力として機能しています。さらに、発展途上国や新興市場での消費者向け電子機器の生産を奨励する政府の好ましい取り組みは、市場の推進力として機能し、業界の成長率を高めます。
リードセンサー市場レポートのセグメンテーション分析
リード センサー市場分析の導出に貢献した主要なセグメントは、タイプ、接触位置、およびアプリケーションです。
- タイプに基づいて、リードセンサー市場は、近接センサー、レベルセンサー、速度センサー、およびフローセンサーに分類されます。
- 接触位置に基づいて、リードセンサー市場はフォーム A、フォーム B、フォーム C、フォーム D などに分類されます。
- 用途別に見ると、市場は自動車および輸送、セキュリティおよび安全、医療、民生用電子機器、通信、その他に分類されます。
地域別リードセンサー市場シェア分析
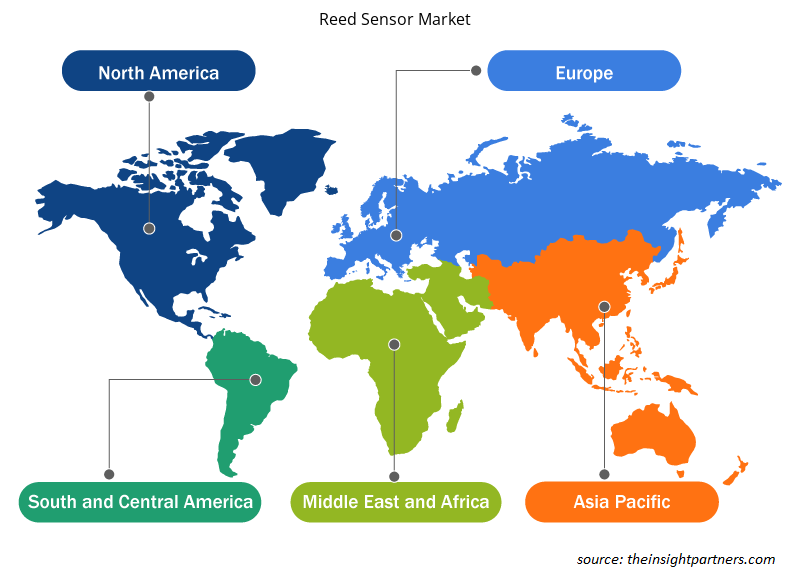
リードセンサー市場レポートの地理的範囲は、主に北米、アジア太平洋、ヨーロッパ、中東およびアフリカ、南米/中南米の 5 つの地域に分かれています。アジア太平洋は、台湾と中国の確立されたエレクトロニクスと自動車部門のおかげです。上海と北京は、自動車、通信機器、エレクトロニクスの中国の主要な産業拠点であり、リードセンサーの市場拡大を牽引しています。韓国では、スマートホームデバイスの成長がリードセンサー市場の成長に貢献しています。
リードセンサー市場の地域別分析
予測期間を通じてリード センサー市場に影響を与える地域的な傾向と要因は、Insight Partners のアナリストによって徹底的に説明されています。このセクションでは、北米、ヨーロッパ、アジア太平洋、中東、アフリカ、南米、中米にわたるリード センサー市場のセグメントと地理についても説明します。

- リードセンサー市場の地域別データを入手
リードセンサー市場レポートの範囲
レポート属性 | 詳細 |
---|---|
2023年の市場規模 | 21億4千万米ドル |
2031年までの市場規模 | 46億1000万米ドル |
世界のCAGR(2023年~2031年) | 10.1 % |
履歴データ | 2021-2022 |
予測期間 | 2024-2031 |
対象セグメント | タイプ別
|
対象地域と国 | 北米
|
市場リーダーと主要企業プロフィール |
|
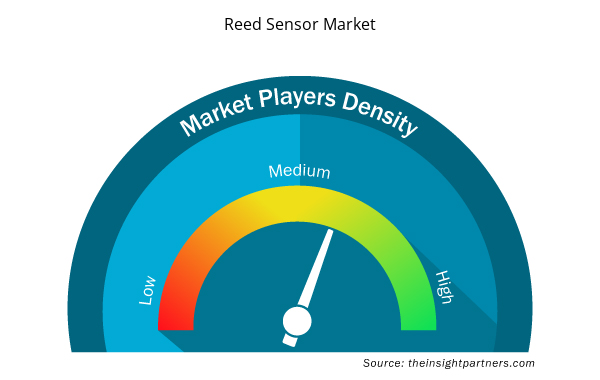
リードセンサー市場のプレーヤー密度:ビジネスダイナミクスへの影響を理解する
リード センサー市場は、消費者の嗜好の変化、技術の進歩、製品の利点に対する認識の高まりなどの要因により、エンド ユーザーの需要が高まり、急速に成長しています。需要が高まるにつれて、企業は提供内容を拡大し、消費者のニーズを満たすために革新を起こし、新たなトレンドを活用し、市場の成長をさらに促進しています。
市場プレーヤー密度とは、特定の市場または業界内で活動している企業または会社の分布を指します。これは、特定の市場スペースに、その規模または総市場価値と比較して、どれだけの競合相手 (市場プレーヤー) が存在するかを示します。
リードセンサー市場で事業を展開している主要企業は次のとおりです。
- HSIセンシング
- コトテクノロジー
- リテルヒューズ株式会社
- PIC株式会社
- ピカリングエレクトロニクス株式会社
- RMCIP
免責事項:上記の企業は、特定の順序でランク付けされていません。

- リードセンサー市場のトップキープレーヤーの概要を入手
リードセンサー市場のニュースと最近の動向
リード センサー市場は、主要な企業出版物、協会データ、データベースなどの一次調査と二次調査後の定性的および定量的データを収集することによって評価されます。以下は、市場の動向の一覧です。
- エイブリック株式会社は、消費電流が極めて低く、磁気感度が高く、長寿命で動作消費電流が160nA以下という優れた特性を持つ磁気センサ、表面実装型TMR(トンネル磁気抵抗)センサIC「S-5701 Bシリーズ」を2021年3月に発売しました。
(出典:エイブリック株式会社、同社ウェブサイト、2021年)
- 2023 年 8 月、Littelfuse, Inc. は、世界最小のサブミニチュア フランジ マウント リード センサーである最新製品 59155 および 59156 を発表しました。センサーのアーキテクチャは、コンパクトなサイズ、非接触型アクティベーション、カスタマイズを可能にし、さまざまな業界のさまざまな狭い間隔のアプリケーションに適しています。
(出典:Littelfuse, Inc.、企業ウェブサイト、2022年)
リードセンサー市場レポートの対象範囲と成果物
「リードセンサー市場規模と予測(2021〜2031年)」レポートでは、以下の分野をカバーする市場の詳細な分析を提供しています。
- 対象範囲に含まれるすべての主要市場セグメントの世界、地域、国レベルでの市場規模と予測
- 市場の動向(推進要因、制約、主要な機会など)
- 今後の主な動向
- 詳細なPEST/ポーターの5つの力とSWOT分析
- 主要な市場動向、主要プレーヤー、規制、最近の市場動向を網羅した世界および地域の市場分析
- 市場集中、ヒートマップ分析、主要プレーヤー、最近の動向を網羅した業界の状況と競争分析
- 詳細な企業プロフィール
- 過去2年間の分析、基準年、CAGRによる予測(7年間)
- PEST分析とSWOT分析
- 市場規模価値/数量 - 世界、地域、国
- 業界と競争環境
- Excel データセット


- Bioremediation Technology and Services Market
- Print Management Software Market
- High Speed Cable Market
- Saudi Arabia Drywall Panels Market
- Military Rubber Tracks Market
- Europe Tortilla Market
- Wind Turbine Composites Market
- Virtual Production Market
- Semiconductor Metrology and Inspection Market
- Helicopters Market

Report Coverage
Revenue forecast, Company Analysis, Industry landscape, Growth factors, and Trends

Segment Covered
This text is related
to segments covered.

Regional Scope
North America, Europe, Asia Pacific, Middle East & Africa, South & Central America

Country Scope
This text is related
to country scope.
よくある質問
The global reed sensor market was estimated to be US$ 2.14 billion in 2023 and is expected to grow at a CAGR of 10.1 % during the forecast period 2023 - 2031.
Reed sensor applications in the automotive industry are the major factors that propel the global reed sensor market.
Sensors for autonomous vehicles to play a significant role in the global reed sensor market in the coming years.
The global reed sensor market is expected to reach US$ 4.61 billion by 2031.
The key players holding the majority of shares in the global reed sensor market are HSI Sensing, Coto Technology, Littelfuse Inc., PIC GmbH, and Pickering Electronics Ltd.
Trends and growth analysis reports related to Electronics and Semiconductor : READ MORE..
The Insight Partners performs research in 4 major stages: Data Collection & Secondary Research, Primary Research, Data Analysis and Data Triangulation & Final Review.
- Data Collection and Secondary Research:
As a market research and consulting firm operating from a decade, we have published and advised several client across the globe. First step for any study will start with an assessment of currently available data and insights from existing reports. Further, historical and current market information is collected from Investor Presentations, Annual Reports, SEC Filings, etc., and other information related to company’s performance and market positioning are gathered from Paid Databases (Factiva, Hoovers, and Reuters) and various other publications available in public domain.
Several associations trade associates, technical forums, institutes, societies and organization are accessed to gain technical as well as market related insights through their publications such as research papers, blogs and press releases related to the studies are referred to get cues about the market. Further, white papers, journals, magazines, and other news articles published in last 3 years are scrutinized and analyzed to understand the current market trends.
- Primary Research:
The primarily interview analysis comprise of data obtained from industry participants interview and answers to survey questions gathered by in-house primary team.
For primary research, interviews are conducted with industry experts/CEOs/Marketing Managers/VPs/Subject Matter Experts from both demand and supply side to get a 360-degree view of the market. The primary team conducts several interviews based on the complexity of the markets to understand the various market trends and dynamics which makes research more credible and precise.
A typical research interview fulfils the following functions:
- Provides first-hand information on the market size, market trends, growth trends, competitive landscape, and outlook
- Validates and strengthens in-house secondary research findings
- Develops the analysis team’s expertise and market understanding
Primary research involves email interactions and telephone interviews for each market, category, segment, and sub-segment across geographies. The participants who typically take part in such a process include, but are not limited to:
- Industry participants: VPs, business development managers, market intelligence managers and national sales managers
- Outside experts: Valuation experts, research analysts and key opinion leaders specializing in the electronics and semiconductor industry.
Below is the breakup of our primary respondents by company, designation, and region:
Once we receive the confirmation from primary research sources or primary respondents, we finalize the base year market estimation and forecast the data as per the macroeconomic and microeconomic factors assessed during data collection.
- Data Analysis:
Once data is validated through both secondary as well as primary respondents, we finalize the market estimations by hypothesis formulation and factor analysis at regional and country level.
- Macro-Economic Factor Analysis:
We analyse macroeconomic indicators such the gross domestic product (GDP), increase in the demand for goods and services across industries, technological advancement, regional economic growth, governmental policies, the influence of COVID-19, PEST analysis, and other aspects. This analysis aids in setting benchmarks for various nations/regions and approximating market splits. Additionally, the general trend of the aforementioned components aid in determining the market's development possibilities.
- Country Level Data:
Various factors that are especially aligned to the country are taken into account to determine the market size for a certain area and country, including the presence of vendors, such as headquarters and offices, the country's GDP, demand patterns, and industry growth. To comprehend the market dynamics for the nation, a number of growth variables, inhibitors, application areas, and current market trends are researched. The aforementioned elements aid in determining the country's overall market's growth potential.
- Company Profile:
The “Table of Contents” is formulated by listing and analyzing more than 25 - 30 companies operating in the market ecosystem across geographies. However, we profile only 10 companies as a standard practice in our syndicate reports. These 10 companies comprise leading, emerging, and regional players. Nonetheless, our analysis is not restricted to the 10 listed companies, we also analyze other companies present in the market to develop a holistic view and understand the prevailing trends. The “Company Profiles” section in the report covers key facts, business description, products & services, financial information, SWOT analysis, and key developments. The financial information presented is extracted from the annual reports and official documents of the publicly listed companies. Upon collecting the information for the sections of respective companies, we verify them via various primary sources and then compile the data in respective company profiles. The company level information helps us in deriving the base number as well as in forecasting the market size.
- Developing Base Number:
Aggregation of sales statistics (2020-2022) and macro-economic factor, and other secondary and primary research insights are utilized to arrive at base number and related market shares for 2022. The data gaps are identified in this step and relevant market data is analyzed, collected from paid primary interviews or databases. On finalizing the base year market size, forecasts are developed on the basis of macro-economic, industry and market growth factors and company level analysis.
- Data Triangulation and Final Review:
The market findings and base year market size calculations are validated from supply as well as demand side. Demand side validations are based on macro-economic factor analysis and benchmarks for respective regions and countries. In case of supply side validations, revenues of major companies are estimated (in case not available) based on industry benchmark, approximate number of employees, product portfolio, and primary interviews revenues are gathered. Further revenue from target product/service segment is assessed to avoid overshooting of market statistics. In case of heavy deviations between supply and demand side values, all thes steps are repeated to achieve synchronization.
We follow an iterative model, wherein we share our research findings with Subject Matter Experts (SME’s) and Key Opinion Leaders (KOLs) until consensus view of the market is not formulated – this model negates any drastic deviation in the opinions of experts. Only validated and universally acceptable research findings are quoted in our reports.
We have important check points that we use to validate our research findings – which we call – data triangulation, where we validate the information, we generate from secondary sources with primary interviews and then we re-validate with our internal data bases and Subject matter experts. This comprehensive model enables us to deliver high quality, reliable data in shortest possible time.