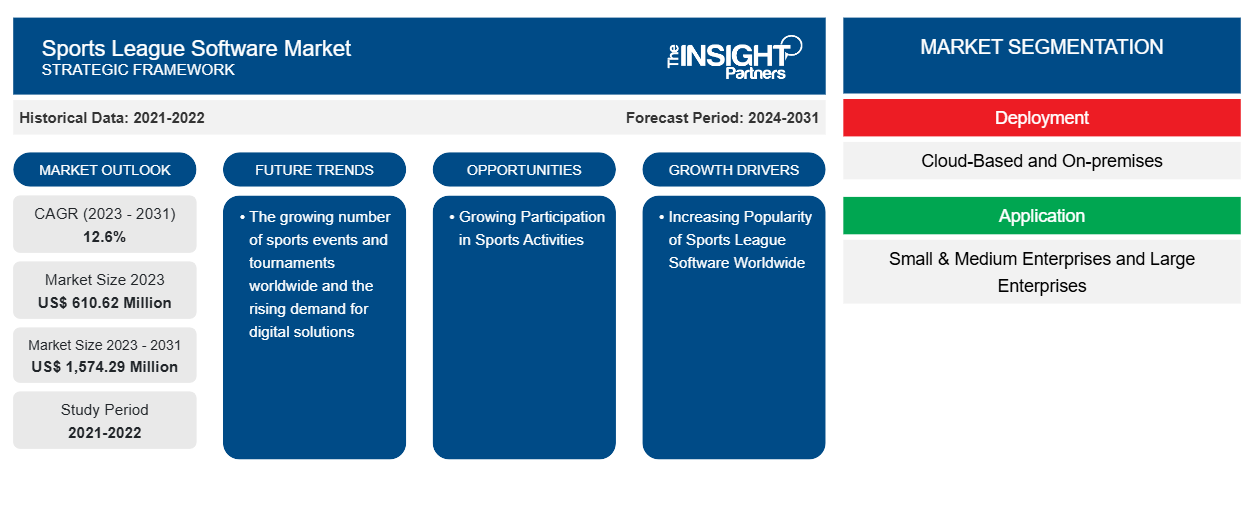
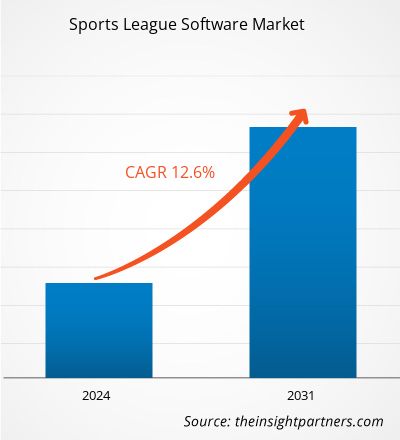
スポーツリーグ ソフトウェアの市場規模は、2023 年の 6 億 1,062 万ドルから 2031 年には 15 億 7,429 万ドルに達すると予測されています。市場は 2023 年から2031 年にかけて 12.6% のCAGRを記録すると予想されています。世界中でスポーツ イベントやトーナメントの数が増え、デジタル ソリューションに対する需要が高まることは、今後もスポーツリーグ ソフトウェア市場の主要なトレンドであり続けると思われます。
スポーツリーグソフトウェア市場分析
スポーツリーグ ソフトウェア市場は、世界中でスポーツリーグ ソフトウェアの人気が高まり、物理的なイベントを超えたファン エンゲージメントの需要が高まっているため、急速に成長しています。市場は、オンライン スポーツ ゲームの人気が高まり、モバイル ベースのスポーツリーグ ソフトウェアが好まれる傾向にあることから、着実に拡大しています。さらに、技術インフラストラクチャの開発への投資の増加とスポーツ活動への参加の増加により、市場の成長に有利な機会が生まれています。
スポーツリーグソフトウェア市場の概要
スポーツリーグソフトウェアを使用すると、スポーツ管理者や主催者はイベントのスケジュール設定、施設の管理、イベント登録の自動化、プレーヤーデータとチームの割り当ての追跡を行うことができます。このソフトウェアは強力なアルゴリズムと多様なインターフェイスを使用して構築されており、効率的なデータ分析を可能にし、パフォーマンスの向上と戦略計画に役立つ洞察を提供します。通常、ソフトウェアはクラウドベースのプラットフォームで実行されますが、一部のバージョンではオンプレミスのインストールもサポートされています。このソフトウェアを使用すると、手動による介入を最小限に抑えながら、スポーツ運営の多くの要素を監視および制御できるという利点がユーザーに提供されます。ユーザーフレンドリーなダッシュボードとカスタマイズされたモジュールが提供され、管理作業を合理化し、リソースの割り当てを最適化します。ただし、教育機関によるスポーツ活動への投資の増加は、市場の成長の機会を生み出しています。
要件に合わせてレポートをカスタマイズする
このレポートの一部、国レベルの分析、Excelデータパックなど、あらゆるレポートを無料でカスタマイズできます。また、スタートアップや大学向けのお得なオファーや割引もご利用いただけます。
スポーツリーグ ソフトウェア市場:
- このレポートの主要な市場動向を入手してください。この無料サンプルには、市場動向から見積もりや予測に至るまでのデータ分析が含まれます。
スポーツリーグ ソフトウェア市場の推進要因と機会
世界中でスポーツリーグソフトウェアの人気が高まり、市場を牽引
スポーツ業界におけるクラウド コンピューティングの可能性に対する認識が高まっているため、クラウドベースのスポーツ リーグ ソフトウェアの需要が高まっています。業界では、クラウド コンピューティングの価値は、より合理化された効率的な運用を可能にすることだと考えています。クラウドベースのスポーツ リーグ ソフトウェアにより、企業はどこからでもスポーツ運営を管理できるようになり、拡張性とコスト効率性という利点も加わります。さらに、スポーツ リーグ ソフトウェアでは、人間によるデータ入力も不要になるため、データの精度が向上し、意思決定が迅速化されます。これらの要因が予測期間中に市場を牽引すると予想されます。
スポーツ活動への参加の増加 - スポーツリーグ ソフトウェア市場におけるチャンス
プロスポーツ選手の増加とオンラインスポーツゲームの人気の高まりに伴うスポーツへの参加の増加が、世界中で市場を牽引しています。これにより、収益を最大化するために業務を効果的に管理するためのスポーツリーグソフトウェアに対する企業間の需要が高まっています。さらに、モバイルデバイスの普及により、アスリートやスポーツチームは外出先でもスポーツリーグソフトウェアにアクセスできるようになり、業務効率が向上しています。したがって、これらの要因により、近い将来、市場に大きな成長の機会が生まれます。
スポーツリーグソフトウェア市場レポートセグメンテーション分析
スポーツリーグ ソフトウェア市場分析の導出に貢献した主要なセグメントは、展開とアプリケーションです。
- 導入に基づいて、スポーツリーグ ソフトウェア市場はクラウドベースとオンプレミスに分かれています。クラウドベースのシステム セグメントは、2023 年に大きな市場シェアを占めました。
- アプリケーションの観点から見ると、市場は中小企業と大企業に分類されます。大企業セグメントは2023年に大きな市場シェアを占めました。
スポーツリーグ ソフトウェアの地域別市場シェア分析
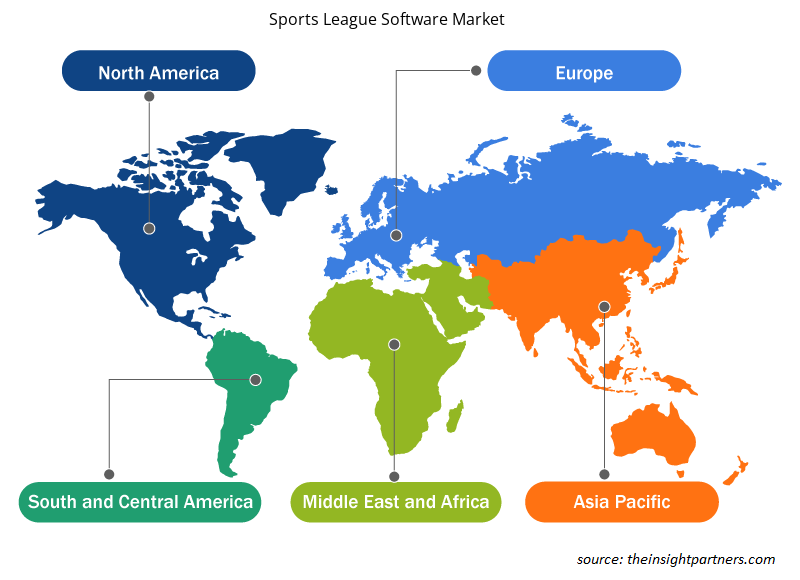
スポーツリーグ ソフトウェア市場レポートの地理的範囲は、主に北米、アジア太平洋、ヨーロッパ、中東およびアフリカ、南米/中南米の 5 つの地域に分かれています。
収益面では、スポーツチーム数の増加と、スポーツ運営を効率的に管理するための費用対効果の高いソリューションに対するニーズの高まりにより、北米がスポーツリーグ ソフトウェア市場で最大のシェアを占めています。技術の進歩とクラウドベースのソリューションの採用の増加により、市場は近い将来に拡大すると予想されています。これらのソリューションは、柔軟性、拡張性、費用対効果など、スポーツチームや組織を惹きつける大きなメリットをユーザーに提供します。さらに、予測期間中、スポーツ イベントやトーナメントの数の増加が市場を後押ししています。
スポーツリーグ ソフトウェア市場の地域別分析
予測期間を通じてスポーツリーグ ソフトウェア市場に影響を与える地域的な傾向と要因は、Insight Partners のアナリストによって徹底的に説明されています。このセクションでは、北米、ヨーロッパ、アジア太平洋、中東およびアフリカ、南米および中米にわたるスポーツリーグ ソフトウェア市場のセグメントと地理についても説明します。
- スポーツリーグソフトウェア市場の地域別データを入手
スポーツリーグソフトウェア市場レポートの範囲
| レポート属性 | 詳細 |
|---|---|
| 2023年の市場規模 | 6億1,062万米ドル |
| 2031年までの市場規模 | 15億7,429万米ドル |
| 世界のCAGR(2023年~2031年) | 12.6% |
| 履歴データ | 2021-2022 |
| 予測期間 | 2024-2031 |
| 対象セグメント | 展開別
|
| 対象地域と国 | 北米
|
| 市場リーダーと主要企業プロフィール |
|
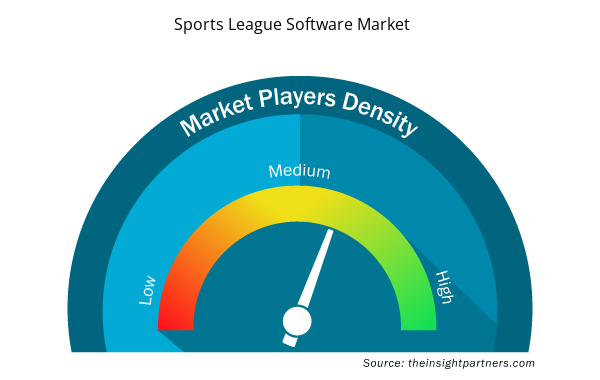
スポーツリーグ ソフトウェア市場のプレーヤー密度: ビジネス ダイナミクスへの影響を理解する
スポーツ リーグ ソフトウェア市場は、消費者の嗜好の変化、技術の進歩、製品の利点に対する認識の高まりなどの要因により、エンド ユーザーの需要が高まり、急速に成長しています。需要が高まるにつれて、企業は提供内容を拡大し、消費者のニーズを満たすために革新を起こし、新たなトレンドを活用し、市場の成長をさらに促進しています。
市場プレーヤー密度とは、特定の市場または業界内で活動している企業または会社の分布を指します。これは、特定の市場スペースに、その市場規模または総市場価値に対してどれだけの競合相手 (市場プレーヤー) が存在するかを示します。
スポーツリーグ ソフトウェア市場で活動している主要企業は次のとおりです。
- アクティブネットワークLLC
- エンゲージスポーツLLC
- EZ施設
- ジャージーウォッチ
- リーグ共和国
- 株式会社プレイオン
免責事項:上記の企業は、特定の順序でランク付けされていません。
- スポーツリーグソフトウェア市場のトップキープレーヤーの概要を入手
スポーツリーグソフトウェア市場のニュースと最近の動向
スポーツ リーグ ソフトウェア市場は、主要な企業出版物、協会データ、データベースなどの一次調査と二次調査後の定性的および定量的データを収集することで評価されます。以下は、スポーツ リーグ ソフトウェアと戦略の市場における動向の一覧です。
- 2023 年 1 月、Jonas Club Software は、2023 年 1 月 24 日から 27 日までフロリダ州オーランドで開催された 2023 PGA ショーに参加しました。同社は、ブース #3929 で完全に再設計された ClubHouse Online モバイル アプリやその他のスポーツ管理ソフトウェアの独占プレビューを含む、最新の革新的な製品とソフトウェアを展示しました。(出典: Jonas Club Software、プレスリリース、2023 年)
スポーツリーグ ソフトウェア市場レポートの対象範囲と成果物
「スポーツリーグソフトウェア市場規模と予測(2021〜2031年)」レポートでは、以下の分野をカバーする市場の詳細な分析を提供しています。
- 対象範囲に含まれるすべての主要市場セグメントの世界、地域、国レベルでの市場規模と予測
- 市場の動向(推進要因、制約、主要な機会など)
- 今後の主な動向
- 詳細なPEST/ポーターの5つの力とSWOT分析
- 主要な市場動向、主要プレーヤー、規制、最近の市場動向を網羅した世界および地域の市場分析
- 市場集中、ヒートマップ分析、主要プレーヤー、最近の動向を網羅した業界の状況と競争分析
- 詳細な企業プロフィール
- 過去2年間の分析、基準年、CAGRによる予測(7年間)
- PEST分析とSWOT分析
- 市場規模価値/数量 - 世界、地域、国
- 業界と競争環境
- Excel データセット
- Artificial Intelligence in Healthcare Diagnosis Market
- Extracellular Matrix Market
- Intradermal Injection Market
- Volumetric Video Market
- Wire Harness Market
- Pharmacovigilance and Drug Safety Software Market
- Enzymatic DNA Synthesis Market
- Vertical Farming Crops Market
- Hydrolyzed Collagen Market
- Aircraft Landing Gear Market

Report Coverage
Revenue forecast, Company Analysis, Industry landscape, Growth factors, and Trends

Segment Covered
This text is related
to segments covered.

Regional Scope
North America, Europe, Asia Pacific, Middle East & Africa, South & Central America

Country Scope
This text is related
to country scope.
よくある質問
The global sports league software market was estimated to be US$ 610.62 million in 2023 and is expected to grow at a CAGR of 12.6% during the forecast period 2023 - 2031.
The increasing popularity of sports league software worldwide and the growing demand for fan engagement beyond physical events are the major factors that propel the global sports league software market.
The growing number of sports events and tournaments worldwide and the rising demand for digital solutions to play a significant role in the global sports league software market in the coming years.
The key players holding majority shares in the global sports league software market are ACTIVE Network, LLC, Engage Sports, LLC, EZ Facility, Jersey Watch, and LeagueRepublic.
The global sports league software market is expected to reach US$ 1,574.29 million by 2031.
The incremental growth expected to be recorded for the global sports league software market during the forecast period is US$ 963.67 million.
Trends and growth analysis reports related to Technology, Media and Telecommunications : READ MORE..
The Insight Partners performs research in 4 major stages: Data Collection & Secondary Research, Primary Research, Data Analysis and Data Triangulation & Final Review.
- Data Collection and Secondary Research:
As a market research and consulting firm operating from a decade, we have published and advised several client across the globe. First step for any study will start with an assessment of currently available data and insights from existing reports. Further, historical and current market information is collected from Investor Presentations, Annual Reports, SEC Filings, etc., and other information related to company’s performance and market positioning are gathered from Paid Databases (Factiva, Hoovers, and Reuters) and various other publications available in public domain.
Several associations trade associates, technical forums, institutes, societies and organization are accessed to gain technical as well as market related insights through their publications such as research papers, blogs and press releases related to the studies are referred to get cues about the market. Further, white papers, journals, magazines, and other news articles published in last 3 years are scrutinized and analyzed to understand the current market trends.
- Primary Research:
The primarily interview analysis comprise of data obtained from industry participants interview and answers to survey questions gathered by in-house primary team.
For primary research, interviews are conducted with industry experts/CEOs/Marketing Managers/VPs/Subject Matter Experts from both demand and supply side to get a 360-degree view of the market. The primary team conducts several interviews based on the complexity of the markets to understand the various market trends and dynamics which makes research more credible and precise.
A typical research interview fulfils the following functions:
- Provides first-hand information on the market size, market trends, growth trends, competitive landscape, and outlook
- Validates and strengthens in-house secondary research findings
- Develops the analysis team’s expertise and market understanding
Primary research involves email interactions and telephone interviews for each market, category, segment, and sub-segment across geographies. The participants who typically take part in such a process include, but are not limited to:
- Industry participants: VPs, business development managers, market intelligence managers and national sales managers
- Outside experts: Valuation experts, research analysts and key opinion leaders specializing in the electronics and semiconductor industry.
Below is the breakup of our primary respondents by company, designation, and region:

Once we receive the confirmation from primary research sources or primary respondents, we finalize the base year market estimation and forecast the data as per the macroeconomic and microeconomic factors assessed during data collection.
- Data Analysis:
Once data is validated through both secondary as well as primary respondents, we finalize the market estimations by hypothesis formulation and factor analysis at regional and country level.
- Macro-Economic Factor Analysis:
We analyse macroeconomic indicators such the gross domestic product (GDP), increase in the demand for goods and services across industries, technological advancement, regional economic growth, governmental policies, the influence of COVID-19, PEST analysis, and other aspects. This analysis aids in setting benchmarks for various nations/regions and approximating market splits. Additionally, the general trend of the aforementioned components aid in determining the market's development possibilities.
- Country Level Data:
Various factors that are especially aligned to the country are taken into account to determine the market size for a certain area and country, including the presence of vendors, such as headquarters and offices, the country's GDP, demand patterns, and industry growth. To comprehend the market dynamics for the nation, a number of growth variables, inhibitors, application areas, and current market trends are researched. The aforementioned elements aid in determining the country's overall market's growth potential.
- Company Profile:
The “Table of Contents” is formulated by listing and analyzing more than 25 - 30 companies operating in the market ecosystem across geographies. However, we profile only 10 companies as a standard practice in our syndicate reports. These 10 companies comprise leading, emerging, and regional players. Nonetheless, our analysis is not restricted to the 10 listed companies, we also analyze other companies present in the market to develop a holistic view and understand the prevailing trends. The “Company Profiles” section in the report covers key facts, business description, products & services, financial information, SWOT analysis, and key developments. The financial information presented is extracted from the annual reports and official documents of the publicly listed companies. Upon collecting the information for the sections of respective companies, we verify them via various primary sources and then compile the data in respective company profiles. The company level information helps us in deriving the base number as well as in forecasting the market size.
- Developing Base Number:
Aggregation of sales statistics (2020-2022) and macro-economic factor, and other secondary and primary research insights are utilized to arrive at base number and related market shares for 2022. The data gaps are identified in this step and relevant market data is analyzed, collected from paid primary interviews or databases. On finalizing the base year market size, forecasts are developed on the basis of macro-economic, industry and market growth factors and company level analysis.
- Data Triangulation and Final Review:
The market findings and base year market size calculations are validated from supply as well as demand side. Demand side validations are based on macro-economic factor analysis and benchmarks for respective regions and countries. In case of supply side validations, revenues of major companies are estimated (in case not available) based on industry benchmark, approximate number of employees, product portfolio, and primary interviews revenues are gathered. Further revenue from target product/service segment is assessed to avoid overshooting of market statistics. In case of heavy deviations between supply and demand side values, all thes steps are repeated to achieve synchronization.
We follow an iterative model, wherein we share our research findings with Subject Matter Experts (SME’s) and Key Opinion Leaders (KOLs) until consensus view of the market is not formulated – this model negates any drastic deviation in the opinions of experts. Only validated and universally acceptable research findings are quoted in our reports.
We have important check points that we use to validate our research findings – which we call – data triangulation, where we validate the information, we generate from secondary sources with primary interviews and then we re-validate with our internal data bases and Subject matter experts. This comprehensive model enables us to deliver high quality, reliable data in shortest possible time.
 このレポートの無料サンプルを入手する