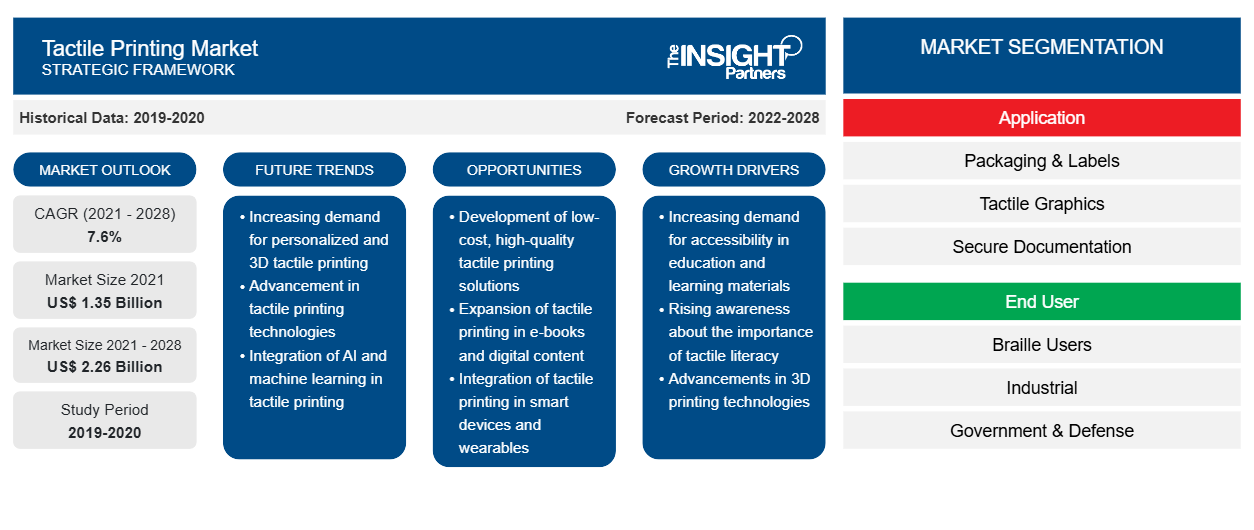
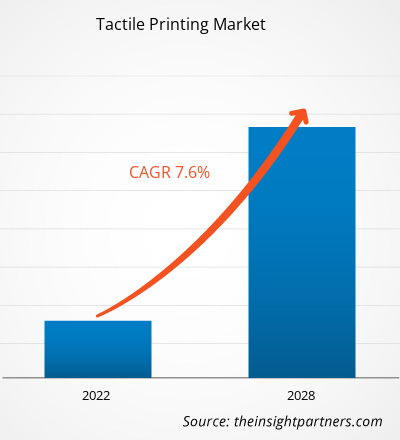
触覚印刷市場は2021年に13億5,327万米ドルと評価され、2028年までに22億5,792万米ドルに達すると予測されており、2021年から2028年にかけて7.6%のCAGRで成長すると予想されています。
触覚印刷は、触覚で感知できるテクスチャを印刷基材上に作成するプロセスです。触覚印刷は、医薬品、医療用パッケージ、ヒューマンサービス、健康科学、農業、サービス、およびその他の分野でさまざまな用途があります。触覚印刷の需要は、マッピング、ラベリング、パッケージング、セキュリティ、および安全な文書化におけるこの技術の使用の増加によって主に推進されています。さらに、点字印刷ゲーム、リストバンド、音楽カード、ピン、スイッチ、名刺、場所ラベル、ステッカー、グリーティングカード、および電卓などのカスタマイズされたソリューションの需要の高まりによる点字印刷技術への投資の増加は、触覚印刷市場の成長を促進しています。多くの国が視覚障害者の雇用促進に重点を置いているため、点字印刷業界は触覚印刷市場のプレーヤーに大きな機会を提供しています。
要件に合わせてレポートをカスタマイズする
このレポートの一部、国レベルの分析、Excelデータパックなど、あらゆるレポートを無料でカスタマイズできます。また、スタートアップや大学向けのお得なオファーや割引もご利用いただけます。
触覚印刷市場:
- このレポートの主要な市場動向を入手してください。この無料サンプルには、市場動向から見積もりや予測に至るまでのデータ分析が含まれます。
COVID-19パンデミックが触覚印刷市場に与える影響
バリューチェーン全体の需要と供給の混乱により、世界の触覚印刷市場で事業を展開する企業は、収益と事業成長の低下を目の当たりにしています。そのため、この流行により、2020年の市場全体の成長はある程度抑制されました。しかし、世界中の商業および産業ユーザーからの需要の増加が予想されるため、市場の成長は2021年第3四半期から正常化し、2021年から2028年まで安定したペースで成長し続けると予想されています。
触覚印刷市場の洞察
視覚障害者を支援する触覚グラフィックスの需要が高まる
中小企業の雇用主は、多様な候補者に雇用機会を提供し、身体に障害のある候補者を労働力として受け入れています。その結果、マーケティング、ビジネス管理および運営、人材サービス、健康科学、農業などの分野では、視覚障害のある志望者を大規模に雇用しています。視覚障害者を雇用している他のいくつかの分野には、非営利団体、地方、州、連邦政府、自営業の起業家が含まれます。法律の変更や公民権法も、視覚障害者のキャリア機会にプラスの影響を与えています。したがって、職場でこれらの人々を支援するために、触覚標識ボードと地図の需要が高まっています。
アプリケーションベースの市場分析
アプリケーションに基づいて、触覚印刷市場は、パッケージングとラベル、触覚グラフィックス、および安全なドキュメントに分類されます。パッケージングとラベルのセグメントは、2020年に市場をリードしました。触覚印刷は、さまざまな垂直分野のパッケージングとラベリング業務で主要なアプリケーションであり、企業がより広い顧客ベースを獲得するのに役立ちます。触覚印刷されたパッケージング材料とラベルは、視覚障害者にも役立ちます。さらに、触覚印刷の使用は、ブランドがパッケージに流行のプレゼンテーションと装飾的な装飾を施すのに役立ち、バリアやその他の特別な機能を提供します。
活動しているプレーヤーは
触覚印刷
市場での地位を維持するために、企業は合併、買収、市場イニシアチブなどの戦略を採用しています。主要企業によるいくつかの動向を以下に示します。
- 2020 年、ViewPlus Technologies Inc. は、現在販売中の Power-Dot Braille で心地よい丸みを帯びた点の形状を維持しながら、デスクトップ点字プリンターの中で最も強力で読みやすい点字ドットを導入しました。VP Delta 2 と VP Columbia 2 は、高解像度の触覚グラフィックと米国議会図書館 (LOC) 点字をエンボス加工します。
- 2021年、ローランドDGA株式会社は、ラベル、パッケージ、看板、ディスプレイ、室内装飾品の制作を新たなレベルに引き上げるために独自に設計された次世代UVプリンター/カッター、VersaUV LEC2-640およびLEC2-330の発売を発表しました。
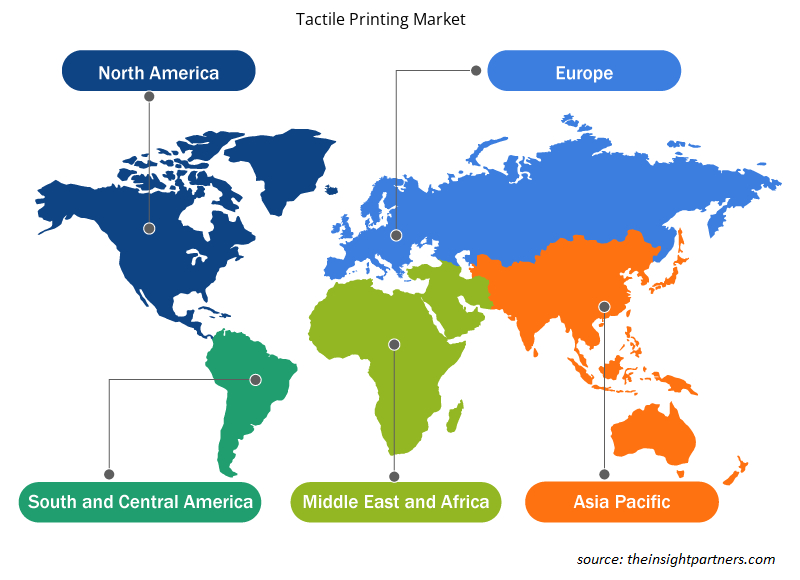
触覚印刷市場の地域別洞察
予測期間を通じて触覚印刷市場に影響を与える地域的な傾向と要因は、Insight Partners のアナリストによって徹底的に説明されています。このセクションでは、北米、ヨーロッパ、アジア太平洋、中東、アフリカ、南米、中米にわたる触覚印刷市場のセグメントと地理についても説明します。
- 触覚印刷市場の地域別データを入手
触覚印刷市場レポートの範囲
| レポート属性 | 詳細 |
|---|---|
| 2021年の市場規模 | 13億5千万米ドル |
| 2028年までの市場規模 | 22億6千万米ドル |
| 世界のCAGR(2021年~2028年) | 7.6% |
| 履歴データ | 2019-2020 |
| 予測期間 | 2022-2028 |
| 対象セグメント | アプリケーション別
|
| 対象地域と国 | 北米
|
| 市場リーダーと主要企業プロフィール |
|
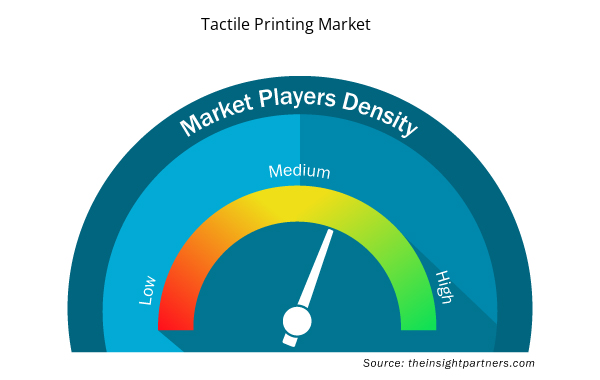
市場プレーヤーの密度:ビジネスダイナミクスへの影響を理解する
触覚印刷市場は、消費者の嗜好の変化、技術の進歩、製品の利点に対する認識の高まりなどの要因により、エンドユーザーの需要が高まり、急速に成長しています。需要が高まるにつれて、企業は提供を拡大し、消費者のニーズを満たすために革新し、新たなトレンドを活用し、市場の成長をさらに促進しています。
市場プレーヤー密度とは、特定の市場または業界内で活動している企業または会社の分布を指します。これは、特定の市場スペースに、その市場規模または総市場価値に対してどれだけの競合相手 (市場プレーヤー) が存在するかを示します。
触覚印刷市場で事業を展開している主要企業は次のとおりです。
- アルティックス
- コニカミノルタ株式会社
- リンク印刷会社
- スターディプリント&デザイン株式会社
- アメリカンサーモフォーム
免責事項:上記の企業は、特定の順序でランク付けされていません。
- 触覚印刷市場のトップキープレーヤーの概要を入手
触覚印刷市場は以下のように分類されています。
触覚印刷市場 – 用途別
- 包装とラベル
- 触覚グラフィック
- 安全なドキュメント
触覚印刷市場 – エンドユーザー別
- 点字ユーザー
- 産業
- 政府と防衛
触覚印刷市場 – 地域別
北米
- 私たち
- カナダ
- メキシコ
ヨーロッパ
- ドイツ
- フランス
- イタリア
- 英国
- ロシア
- その他のヨーロッパ
アジア太平洋(APAC)
- オーストラリア
- 中国
- インド
- 日本
- 韓国
- その他のアジア太平洋地域
中東およびアフリカ(MEA)
- 南アフリカ
- サウジアラビア
- アラブ首長国連邦
- MEAの残り
南アメリカ(SAM)
- ブラジル
- アルゼンチン
- 残りのSAM
企業プロフィール
- アルティックス
- コニカミノルタ株式会社
- リンク印刷会社
- スターディプリント&デザイン株式会社
- アメリカンサーモフォーム
- キヤノン株式会社
- 点字索引
- 兼松USA
- ビュープラステクノロジーズ株式会社
- ローランド ディー.ジー.株式会社
- 過去2年間の分析、基準年、CAGRによる予測(7年間)
- PEST分析とSWOT分析
- 市場規模価値/数量 - 世界、地域、国
- 業界と競争環境
- Excel データセット
- Third Party Logistics Market
- Toothpaste Market
- Photo Editing Software Market
- Lyophilization Services for Biopharmaceuticals Market
- Integrated Platform Management System Market
- Bathroom Vanities Market
- Arterial Blood Gas Kits Market
- Aircraft MRO Market
- Pressure Vessel Composite Materials Market
- Authentication and Brand Protection Market

Report Coverage
Revenue forecast, Company Analysis, Industry landscape, Growth factors, and Trends

Segment Covered
This text is related
to segments covered.

Regional Scope
North America, Europe, Asia Pacific, Middle East & Africa, South & Central America

Country Scope
This text is related
to country scope.
よくある質問
The tactile printing market by application has been segmented into packaging and labels, tactile graphics, and secure documentation. The packaging and labels segment led the tactile printing market with a market share of more than 60% in 2020.
The demand for tactile printing is being majorly driven by the growing use of this technique in mapping, labeling, packaging, security, and secure documentation. Further, increasing investments in the Braille printing technology due to the escalating demand for customized solutions such as Braille printed games, wristbands, musical cards, pins, switches, visiting cards, location labels, stickers, greeting cards, and calculators is augmenting the market growth. With many countries focusing on encouraging the employment of visually impaired people, the Braille printing industry is presenting significant opportunities to the tactile printing market players.
APAC led the global tactile printing market with a revenue share of more than 30% in 2020.The dominance of the region is attributed to the rise in demand for tactile printing in the automotive, chemicals, cosmetics, and health and beauty industries, among others. Increasing awareness about hygiene and transforming lifestyle of consumers, leading to high preference for contamination-free food, in countries such as India, China, and Indonesia have stimulated developments in packaging inks and coating materials in APAC. Moreover, high pace of industrialization and urbanization is fuelling the adoption of tactile printing technology in the region.
Trends and growth analysis reports related to Electronics and Semiconductor : READ MORE..
The List of Companies - Tactile Printing Market
- Altix
- Konica Minolta, Inc.
- Rink Printing Company
- Sturdy Print & Design Ltd
- American Thermoform
- Canon Inc
- Index Braille
- Kanematsu USA
- ViewPlus Technologies Inc
- Roland DG Corporation
The Insight Partners performs research in 4 major stages: Data Collection & Secondary Research, Primary Research, Data Analysis and Data Triangulation & Final Review.
- Data Collection and Secondary Research:
As a market research and consulting firm operating from a decade, we have published and advised several client across the globe. First step for any study will start with an assessment of currently available data and insights from existing reports. Further, historical and current market information is collected from Investor Presentations, Annual Reports, SEC Filings, etc., and other information related to company’s performance and market positioning are gathered from Paid Databases (Factiva, Hoovers, and Reuters) and various other publications available in public domain.
Several associations trade associates, technical forums, institutes, societies and organization are accessed to gain technical as well as market related insights through their publications such as research papers, blogs and press releases related to the studies are referred to get cues about the market. Further, white papers, journals, magazines, and other news articles published in last 3 years are scrutinized and analyzed to understand the current market trends.
- Primary Research:
The primarily interview analysis comprise of data obtained from industry participants interview and answers to survey questions gathered by in-house primary team.
For primary research, interviews are conducted with industry experts/CEOs/Marketing Managers/VPs/Subject Matter Experts from both demand and supply side to get a 360-degree view of the market. The primary team conducts several interviews based on the complexity of the markets to understand the various market trends and dynamics which makes research more credible and precise.
A typical research interview fulfils the following functions:
- Provides first-hand information on the market size, market trends, growth trends, competitive landscape, and outlook
- Validates and strengthens in-house secondary research findings
- Develops the analysis team’s expertise and market understanding
Primary research involves email interactions and telephone interviews for each market, category, segment, and sub-segment across geographies. The participants who typically take part in such a process include, but are not limited to:
- Industry participants: VPs, business development managers, market intelligence managers and national sales managers
- Outside experts: Valuation experts, research analysts and key opinion leaders specializing in the electronics and semiconductor industry.
Below is the breakup of our primary respondents by company, designation, and region:

Once we receive the confirmation from primary research sources or primary respondents, we finalize the base year market estimation and forecast the data as per the macroeconomic and microeconomic factors assessed during data collection.
- Data Analysis:
Once data is validated through both secondary as well as primary respondents, we finalize the market estimations by hypothesis formulation and factor analysis at regional and country level.
- Macro-Economic Factor Analysis:
We analyse macroeconomic indicators such the gross domestic product (GDP), increase in the demand for goods and services across industries, technological advancement, regional economic growth, governmental policies, the influence of COVID-19, PEST analysis, and other aspects. This analysis aids in setting benchmarks for various nations/regions and approximating market splits. Additionally, the general trend of the aforementioned components aid in determining the market's development possibilities.
- Country Level Data:
Various factors that are especially aligned to the country are taken into account to determine the market size for a certain area and country, including the presence of vendors, such as headquarters and offices, the country's GDP, demand patterns, and industry growth. To comprehend the market dynamics for the nation, a number of growth variables, inhibitors, application areas, and current market trends are researched. The aforementioned elements aid in determining the country's overall market's growth potential.
- Company Profile:
The “Table of Contents” is formulated by listing and analyzing more than 25 - 30 companies operating in the market ecosystem across geographies. However, we profile only 10 companies as a standard practice in our syndicate reports. These 10 companies comprise leading, emerging, and regional players. Nonetheless, our analysis is not restricted to the 10 listed companies, we also analyze other companies present in the market to develop a holistic view and understand the prevailing trends. The “Company Profiles” section in the report covers key facts, business description, products & services, financial information, SWOT analysis, and key developments. The financial information presented is extracted from the annual reports and official documents of the publicly listed companies. Upon collecting the information for the sections of respective companies, we verify them via various primary sources and then compile the data in respective company profiles. The company level information helps us in deriving the base number as well as in forecasting the market size.
- Developing Base Number:
Aggregation of sales statistics (2020-2022) and macro-economic factor, and other secondary and primary research insights are utilized to arrive at base number and related market shares for 2022. The data gaps are identified in this step and relevant market data is analyzed, collected from paid primary interviews or databases. On finalizing the base year market size, forecasts are developed on the basis of macro-economic, industry and market growth factors and company level analysis.
- Data Triangulation and Final Review:
The market findings and base year market size calculations are validated from supply as well as demand side. Demand side validations are based on macro-economic factor analysis and benchmarks for respective regions and countries. In case of supply side validations, revenues of major companies are estimated (in case not available) based on industry benchmark, approximate number of employees, product portfolio, and primary interviews revenues are gathered. Further revenue from target product/service segment is assessed to avoid overshooting of market statistics. In case of heavy deviations between supply and demand side values, all thes steps are repeated to achieve synchronization.
We follow an iterative model, wherein we share our research findings with Subject Matter Experts (SME’s) and Key Opinion Leaders (KOLs) until consensus view of the market is not formulated – this model negates any drastic deviation in the opinions of experts. Only validated and universally acceptable research findings are quoted in our reports.
We have important check points that we use to validate our research findings – which we call – data triangulation, where we validate the information, we generate from secondary sources with primary interviews and then we re-validate with our internal data bases and Subject matter experts. This comprehensive model enables us to deliver high quality, reliable data in shortest possible time.
 このレポートの無料サンプルを入手する