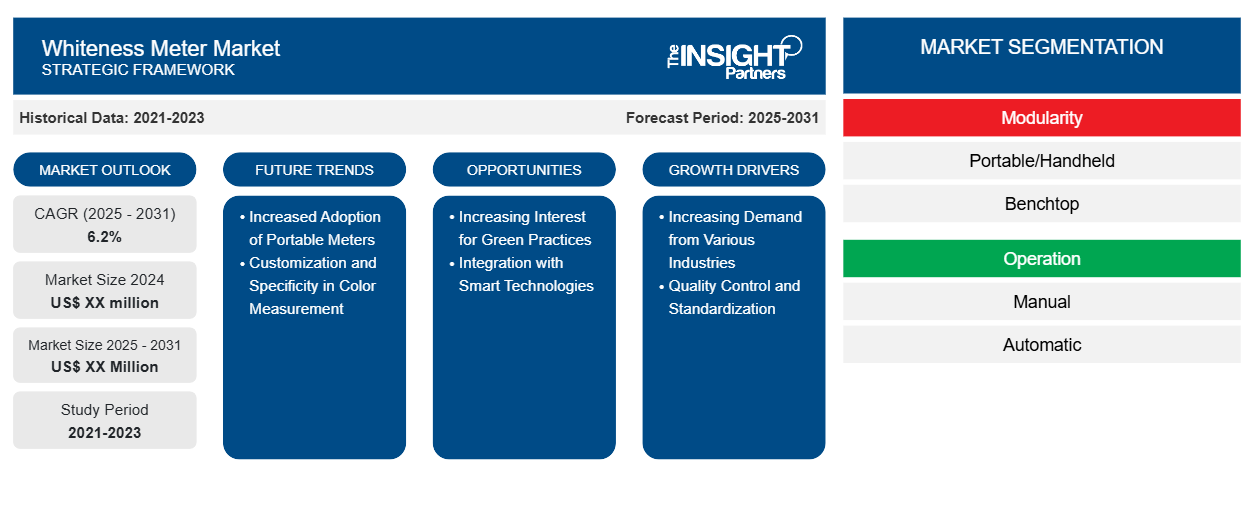
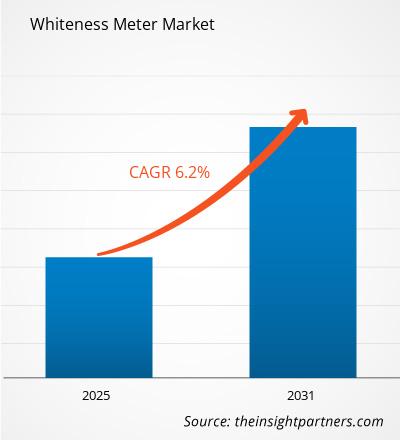
ホワイトネスメーター市場は、2023年から2031年にかけて6.2%のCAGRで成長し、市場規模は2023年のXX百万米ドルから2031年にはXX百万米ドルに拡大すると予想されています。
レポートは、モジュール性(ポータブル/ハンドヘルド、ベンチトップ)、操作(手動、自動)、業界(繊維、建設、塗料、化学、紙パルプ、プラスチック、食品および飲料、その他)、地理(北米、ヨーロッパ、アジア太平洋、中東およびアフリカ、南米および中米)によってセグメント化されています。
グローバル分析は、地域レベルと主要国でさらに細分化されています。レポートでは、上記の分析とセグメントの値をUSDで提供しています。
報告書の目的
The Insight Partners によるホワイトネスメーター市場のレポートは、現在の状況と将来の成長、主な推進要因、課題、機会を説明することを目的としています。これにより、次のようなさまざまなビジネス関係者に洞察が提供されます。
- テクノロジープロバイダー/メーカー: 進化する市場の動向を理解し、潜在的な成長機会を把握することで、情報に基づいた戦略的意思決定が可能になります。
- 投資家: 市場の成長率、市場の財務予測、バリュー チェーン全体に存在する機会に関する包括的な傾向分析を実施します。
- 規制機関: 市場の濫用を最小限に抑え、投資家の信用と信頼を維持し、市場の完全性と安定性を維持することを目的として、市場における政策と警察活動を規制します。
ホワイトネスメーター市場のセグメンテーション
モジュール性
- ポータブル/ハンドヘルド
- ベンチトップ
手術
- マニュアル
- 自動
業界
- 繊維
- 工事
- 塗料
- 化学薬品
- 紙・パルプ
- プラスチック
- 食品・飲料
- その他
地理
- 北米
- ヨーロッパ
- アジア太平洋
- 南米と中央アメリカ
- 中東およびアフリカ
地理
- 北米
- ヨーロッパ
- アジア太平洋
- 南米と中央アメリカ
- 中東およびアフリカ
要件に合わせてレポートをカスタマイズする
このレポートの一部、国レベルの分析、Excelデータパックなど、あらゆるレポートを無料でカスタマイズできます。また、スタートアップや大学向けのお得なオファーや割引もご利用いただけます。
ホワイトネスメーター市場:戦略的洞察
- このレポートの主要な市場動向を入手してください。この無料サンプルには、市場動向から見積もりや予測に至るまでのデータ分析が含まれます。
ホワイトネスメーター市場の成長要因
- さまざまな業界からの需要の増加: 食品や飲料、建設、塗料などのいくつかの分野からの需要が高いため、白色度計の市場は重要です。食品分野では、小麦粉や砂糖などの製品の品質と均質性を確認するために白色度計が使用されています。色はこの業界の主要な品質パラメータであるため、白色度計は、建設や塗料の材料の品質と美的レベルが達成されていることを確認するのに役立ちます。したがって、このような正確な白色度測定ツールの需要が大きく増加しています。
- 品質管理と標準化: 業界全体で品質要求が高まっていることは、製品の外観の適合性に対する要求が高まっている一面でもあります。白色度計やその他の品質管理機器は、多くの品質保証プロセスに不可欠な白色度と色の正確な測定に非常に役立ちます。品質管理とのこの関連性は、製品の外観が消費者の認識と満足度に影響を与える重要な役割を果たす可能性があるほとんどの製造環境に根ざしています。
ホワイトネスメーター市場の今後の動向
- ポータブル メーターの採用増加: ポータブル ホワイトネス メーターの採用が拡大しています。ポータブル ホワイトネス メーターは、現場でのホワイトネスをテストするための便利で柔軟なツールです。ポータブル ホワイトネス メーター デバイスは、ラボベースのテスト プロセスとは異なり、非常に高い精度で測定するのにほとんど時間がかからないため、世界中で製造ラインで採用されています。
- 色測定のカスタマイズと特異性: 業界が製品要件の特定化にますます重点を置くようになるにつれて、よりカスタマイズ可能な白色度計への傾向が高まっています。たとえば、業界によっては、白色度だけでなく、明るさ、不透明度、コントラストなどの他の色パラメータも測定できる白色度計が必要になる場合があります。包装、印刷、繊維業界の特定のアプリケーション向けに測定ツールをカスタマイズすることは、重要な傾向です。メーカーは、さまざまな業界の独自のニーズに対応できる特殊な白色度計を提供しており、より正確で信頼性の高い色測定が可能です。
ホワイトネスメーターの市場機会
- グリーン プラクティスへの関心の高まり: 持続可能性と環境に優しいプラクティスへの関心が高まっているため、ホワイトネス メーター メーカーのビジネス範囲は大きく広がっています。たとえば、エネルギー消費量が少ないメーターや持続可能な素材で作られたメーターの生産は、グリーン志向の消費者や組織にアピールします。持続可能性はブランド イメージをプラスに高め、新しい市場セグメントを生み出します。
- スマート テクノロジーとの統合: 非常に有望な開発は、ホワイトネス メーターとスマート テクノロジー、IoT、クラウド コンピューティングの統合です。スマート ホワイトネス メーターにより、企業はリアルタイムのデータ分析とリモート モニタリングを利用できるようになり、生産プロセスのより適切な制御、品質の向上、エンドツーエンドの製造プロセスの効率的な管理が可能になります。このようにして、機能性と魅力を高めるデジタル化のトレンドを生み出し、さらなる採用を促進できます。
ホワイトネスメーター市場の地域別分析
予測期間を通じてホワイトネスメーター市場に影響を与える地域的な傾向と要因は、Insight Partners のアナリストによって徹底的に説明されています。このセクションでは、北米、ヨーロッパ、アジア太平洋、中東、アフリカ、南米、中米にわたるホワイトネスメーター市場のセグメントと地理についても説明します。
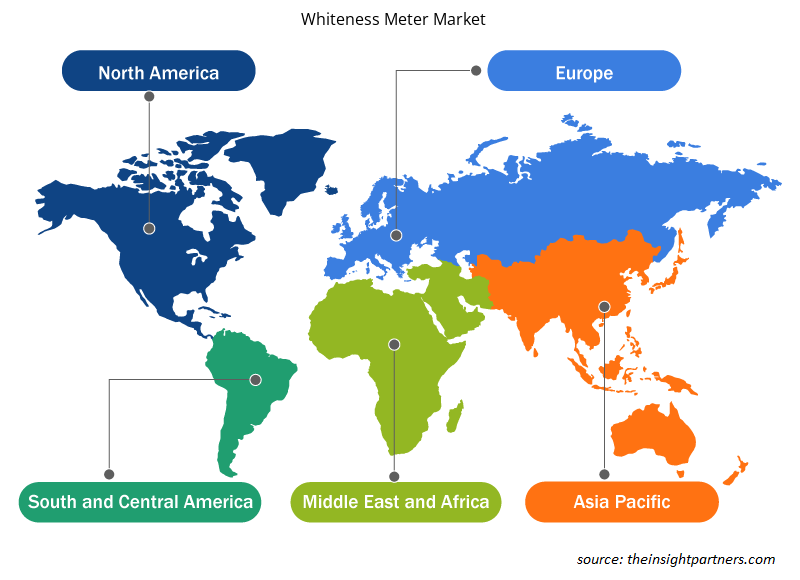
- ホワイトネスメーター市場の地域別データを入手
ホワイトネスメーター市場レポートの範囲
| レポート属性 | 詳細 |
|---|---|
| 2023年の市場規模 | XX百万米ドル |
| 2031年までの市場規模 | XX百万米ドル |
| 世界のCAGR(2023年~2031年) | 6.2% |
| 履歴データ | 2021-2022 |
| 予測期間 | 2024-2031 |
| 対象セグメント | モジュール化による
|
| 対象地域と国 | 北米
|
| 市場リーダーと主要企業プロフィール |
|
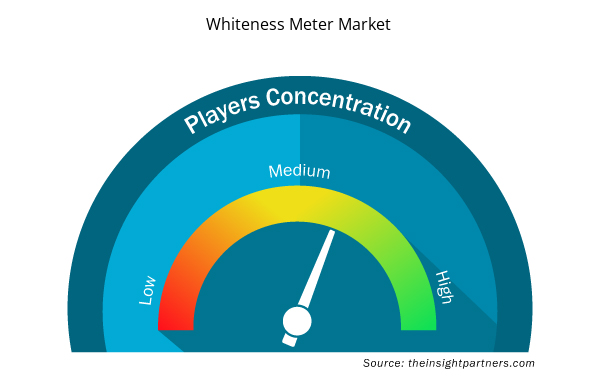
ホワイトネスメーター市場のプレーヤー密度:ビジネスダイナミクスへの影響を理解する
ホワイトネスメーター市場は、消費者の嗜好の変化、技術の進歩、製品の利点に対する認識の高まりなどの要因により、エンドユーザーの需要が高まり、急速に成長しています。需要が高まるにつれて、企業は提供を拡大し、消費者のニーズを満たすために革新し、新たなトレンドを活用し、市場の成長をさらに促進しています。
市場プレーヤー密度とは、特定の市場または業界内で活動している企業または会社の分布を指します。これは、特定の市場スペースに、その市場規模または総市場価値に対してどれだけの競合相手 (市場プレーヤー) が存在するかを示します。
ホワイトネスメーター市場で事業を展開している主要企業は次のとおりです。
- カリフォルニア工科大学エンジニアリングサービス
- EIE インスツルメンツ株式会社
- ケットUS
- ラボトロン・イクイップメント株式会社
- マンガル計装
免責事項:上記の企業は、特定の順序でランク付けされていません。
- ホワイトネスメーター市場のトップキープレーヤーの概要を入手
主なセールスポイント
- 包括的なカバレッジ: レポートでは、ホワイトネスメーター市場の製品、サービス、タイプ、エンドユーザーの分析を包括的にカバーし、全体的な展望を提供します。
- 専門家による分析: レポートは、業界の専門家とアナリストの深い理解に基づいてまとめられています。
- 最新情報: このレポートは、最新の情報とデータの傾向を網羅しているため、ビジネスの関連性を保証します。
- カスタマイズ オプション: このレポートは、特定のクライアント要件に対応し、ビジネス戦略に適切に適合するようにカスタマイズできます。
したがって、ホワイトネスメーター市場に関する調査レポートは、業界のシナリオと成長の見通しを解読し理解する道の先導役となることができます。いくつかの正当な懸念があるかもしれませんが、このレポートの全体的な利点は欠点を上回る傾向があります。
- 過去2年間の分析、基準年、CAGRによる予測(7年間)
- PEST分析とSWOT分析
- 市場規模価値/数量 - 世界、地域、国
- 業界と競争環境
- Excel データセット

Report Coverage
Revenue forecast, Company Analysis, Industry landscape, Growth factors, and Trends

Segment Covered
This text is related
to segments covered.

Regional Scope
North America, Europe, Asia Pacific, Middle East & Africa, South & Central America

Country Scope
This text is related
to country scope.
よくある質問
Some of the customization options available based on the request are an additional 3-5 company profiles and country-specific analysis of 3-5 countries of your choice. Customizations are to be requested/discussed before making final order confirmation# as our team would review the same and check the feasibility
The report can be delivered in PDF/PPT format; we can also share excel dataset based on the request
Increased Adoption of Portable Meters is anticipated to play a significant role in the global Whiteness Meter Market in the coming years
Increasing Demand from Various Industries and Quality Control and Standardization are the major factors driving the Whiteness Meter Market
The Whiteness Meter Market is estimated to witness a CAGR of 6.2% from 2023 to 2031
Trends and growth analysis reports related to Electronics and Semiconductor : READ MORE..
1.Caltech Engineering Services
2.EIE INSTRUMENTS PVT. LTD.
3.Kett US
4.Labtron Equipment Ltd
5.Mangal Instrumentation
6.Mesu Lab Instruments (Guangzhou) Co.,Ltd
7.MxRady Lab Solutions Pvt Ltd
8.Optics Technology
9.PCE Deutschland GmbH
The Insight Partners performs research in 4 major stages: Data Collection & Secondary Research, Primary Research, Data Analysis and Data Triangulation & Final Review.
- Data Collection and Secondary Research:
As a market research and consulting firm operating from a decade, we have published and advised several client across the globe. First step for any study will start with an assessment of currently available data and insights from existing reports. Further, historical and current market information is collected from Investor Presentations, Annual Reports, SEC Filings, etc., and other information related to company’s performance and market positioning are gathered from Paid Databases (Factiva, Hoovers, and Reuters) and various other publications available in public domain.
Several associations trade associates, technical forums, institutes, societies and organization are accessed to gain technical as well as market related insights through their publications such as research papers, blogs and press releases related to the studies are referred to get cues about the market. Further, white papers, journals, magazines, and other news articles published in last 3 years are scrutinized and analyzed to understand the current market trends.
- Primary Research:
The primarily interview analysis comprise of data obtained from industry participants interview and answers to survey questions gathered by in-house primary team.
For primary research, interviews are conducted with industry experts/CEOs/Marketing Managers/VPs/Subject Matter Experts from both demand and supply side to get a 360-degree view of the market. The primary team conducts several interviews based on the complexity of the markets to understand the various market trends and dynamics which makes research more credible and precise.
A typical research interview fulfils the following functions:
- Provides first-hand information on the market size, market trends, growth trends, competitive landscape, and outlook
- Validates and strengthens in-house secondary research findings
- Develops the analysis team’s expertise and market understanding
Primary research involves email interactions and telephone interviews for each market, category, segment, and sub-segment across geographies. The participants who typically take part in such a process include, but are not limited to:
- Industry participants: VPs, business development managers, market intelligence managers and national sales managers
- Outside experts: Valuation experts, research analysts and key opinion leaders specializing in the electronics and semiconductor industry.
Below is the breakup of our primary respondents by company, designation, and region:

Once we receive the confirmation from primary research sources or primary respondents, we finalize the base year market estimation and forecast the data as per the macroeconomic and microeconomic factors assessed during data collection.
- Data Analysis:
Once data is validated through both secondary as well as primary respondents, we finalize the market estimations by hypothesis formulation and factor analysis at regional and country level.
- Macro-Economic Factor Analysis:
We analyse macroeconomic indicators such the gross domestic product (GDP), increase in the demand for goods and services across industries, technological advancement, regional economic growth, governmental policies, the influence of COVID-19, PEST analysis, and other aspects. This analysis aids in setting benchmarks for various nations/regions and approximating market splits. Additionally, the general trend of the aforementioned components aid in determining the market's development possibilities.
- Country Level Data:
Various factors that are especially aligned to the country are taken into account to determine the market size for a certain area and country, including the presence of vendors, such as headquarters and offices, the country's GDP, demand patterns, and industry growth. To comprehend the market dynamics for the nation, a number of growth variables, inhibitors, application areas, and current market trends are researched. The aforementioned elements aid in determining the country's overall market's growth potential.
- Company Profile:
The “Table of Contents” is formulated by listing and analyzing more than 25 - 30 companies operating in the market ecosystem across geographies. However, we profile only 10 companies as a standard practice in our syndicate reports. These 10 companies comprise leading, emerging, and regional players. Nonetheless, our analysis is not restricted to the 10 listed companies, we also analyze other companies present in the market to develop a holistic view and understand the prevailing trends. The “Company Profiles” section in the report covers key facts, business description, products & services, financial information, SWOT analysis, and key developments. The financial information presented is extracted from the annual reports and official documents of the publicly listed companies. Upon collecting the information for the sections of respective companies, we verify them via various primary sources and then compile the data in respective company profiles. The company level information helps us in deriving the base number as well as in forecasting the market size.
- Developing Base Number:
Aggregation of sales statistics (2020-2022) and macro-economic factor, and other secondary and primary research insights are utilized to arrive at base number and related market shares for 2022. The data gaps are identified in this step and relevant market data is analyzed, collected from paid primary interviews or databases. On finalizing the base year market size, forecasts are developed on the basis of macro-economic, industry and market growth factors and company level analysis.
- Data Triangulation and Final Review:
The market findings and base year market size calculations are validated from supply as well as demand side. Demand side validations are based on macro-economic factor analysis and benchmarks for respective regions and countries. In case of supply side validations, revenues of major companies are estimated (in case not available) based on industry benchmark, approximate number of employees, product portfolio, and primary interviews revenues are gathered. Further revenue from target product/service segment is assessed to avoid overshooting of market statistics. In case of heavy deviations between supply and demand side values, all thes steps are repeated to achieve synchronization.
We follow an iterative model, wherein we share our research findings with Subject Matter Experts (SME’s) and Key Opinion Leaders (KOLs) until consensus view of the market is not formulated – this model negates any drastic deviation in the opinions of experts. Only validated and universally acceptable research findings are quoted in our reports.
We have important check points that we use to validate our research findings – which we call – data triangulation, where we validate the information, we generate from secondary sources with primary interviews and then we re-validate with our internal data bases and Subject matter experts. This comprehensive model enables us to deliver high quality, reliable data in shortest possible time.
 このレポートの無料サンプルを入手する