
세그먼트, 지역, 역학, 최근 개발 및 전략적 통찰력에 따른 물류 시장 보고서 2030의 3D 측정 센서
2030년까지 물류 시장 3D 측정 센서 전망 - 유형별(이미지 센서, 위치 센서, 음향 센서 등) 및 기술별(스테레오 비전, 구조화 광, 레이저 광 등) 글로벌 분석
- 상태 : 게시됨
- 보고서 코드 : TIPRE00030010
- 범주 : 전자 및 반도체
- 페이지 수 : 150
- 사용 가능한 보고서 형식 :


- 최종 업데이트 일자 : June 12, 2024

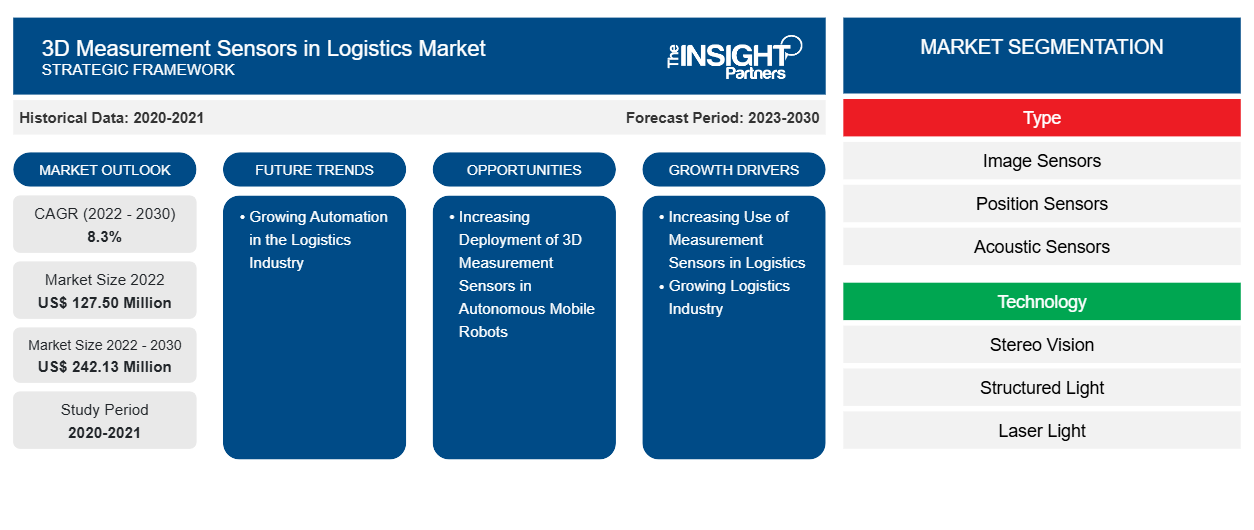
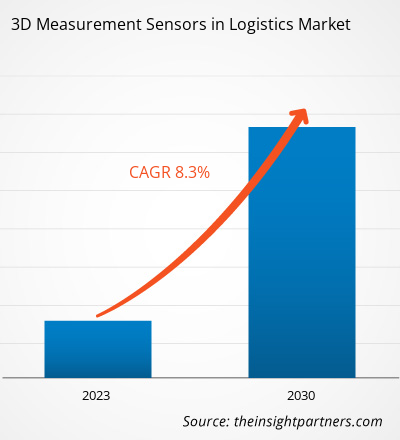
[연구보고서] 물류용 3D 측정센서 시장 규모는 2022년 1억2,750만달러에서 2030년 2억4,213만달러로 성장할 것으로 예상되며, 예측 기간 동안 8.3%의 CAGR을 기록할 것으로 추산됩니다.CAGR of 8.3% during the forecast period.
분석가 관점:
3D 이미지 센서, 3D 위치 센서, 3D 깊이 센서에 대한 수요는 전 세계 물류 산업에서 증가하고 있습니다. 이러한 센서는 창고 내에서 상품의 이동을 추적하는 데 도움이 되기 때문입니다. 또한 이러한 센서는 회사가 병목 현상을 식별하고 필요에 따라 창고 레이아웃을 최적화하는 데 도움이 되어 물류 시장에서 3D 측정 센서 의 성장을 촉진 합니다. 또한 전자 상거래 산업이 성장함에 따라 물류 부문이 엄청나게 성장하고 있습니다. 이러한 성장은 머신 비전, 자산 추적, 데이터 캡처 스캐닝 및 객체 치수 지정을 통해 실시간 데이터를 제공하여 운영 효율성을 더욱 향상시키기 위한 자동화에 대한 필요성을 높이고 있습니다. 또한 로봇 공학에서 3D 측정 센서의 사용이 증가하고 있습니다. 센서는 로봇이 주변 환경을 더 잘 인식하도록 돕고 창고에서 픽 앤 그랩 작업을 효율적으로 수행하는 데 도움이 되어 물류 시장에서 3D 측정 센서의 성장 기회를 창출할 수 있습니다.
시장 개요:
3D 측정 센서는 전자적으로 정보를 얻고 이 데이터를 사용하여 사람, 장치 및 세계 간의 인터페이스를 개선하는 데 사용됩니다. 이러한 센서는 근적외선 반사, 사진, 기하학적 원리 및 고급 컴퓨팅 파워를 사용하여 기계가 사람과 사물에 대한 세부 정보를 수집할 수 있도록 하는 3D 감지 기술로 작동하며, 이는 의미 있는 정보로 추가 처리될 수 있습니다. 3D 센서에 대한 수요는 창고 및 물류 운영에서 효율성을 높이기 위해 사용됨에 따라 엄청난 성장을 목격하고 있습니다. 창고에서 센서는 제품 손상 및 기타 불일치 사항을 보다 효과적으로 모니터링하는 데 도움이 되므로 주문 이행에 사용되므로 물류 시장에서 3D 측정 센서의 성장을 촉진합니다.
귀하의 요구 사항에 맞게 이 보고서를 사용자 정의하세요
이 보고서의 일부 또는 국가 수준 분석, Excel 데이터 팩을 포함하여 모든 보고서에 대한 사용자 정의를 무료로 받을 수 있으며 신생 기업 및 대학을 위한 훌륭한 혜택과 할인 혜택을 이용할 수 있습니다.
물류 시장의 3D 측정 센서: 전략적 통찰력
-
이 보고서의 주요 시장 동향을 알아보세요.이 무료 샘플에는 시장 동향부터 추정 및 예측까지 다양한 데이터 분석이 포함됩니다.
시장 동인:
물류 시장에서 측정 센서 사용 증가 물류 시장에서의 3D 측정 센서
이미지 센서 , 위치 센서, 음향 센서와 같은 측정 센서의 사용이 증가함에 따라 여러 물류 작업이 간소화되었습니다. 이미지 센서는 물류 유통 시스템에서 대상 인식에 사용되어 유통 프로세스를 효율적으로 관리합니다. 위치 센서는 모든 재료 유형 및 표면 속성의 물체 위치를 감지하는 데 사용됩니다. 위치 센서는 물체의 이동에 대한 데이터를 신호로 변환하여 위치 피드백을 제공하는 데 도움이 됩니다. 재고 수준 모니터링, 재고 오류 감소, 보관 공간 최적화와 같은 다양한 물류 및 창고 관리 작업은 측정 센서의 도움으로 쉽게 수행할 수 있습니다. 창고 내에서 상품의 이동을 추적하는 것 외에도 이러한 센서는 회사가 병목 현상을 식별하고 창고 레이아웃을 최적화하는 데 도움이 됩니다. 또한 측정 센서를 사용하여 비상 사고 현장에서 데이터를 수집하여 물류 작업을 분석할 수 있습니다. 이 데이터는 새로운 작업에 대한 계획 및 준비를 개선하는 데 도움이 될 수 있습니다. 실시간 정보는 더 나은 상황 인식을 제공할 수 있으며 인공 지능 또는 최적화 알고리즘을 기반으로 하는 자동 의사 결정 지원을 위한 입력으로 사용할 수도 있습니다. 따라서 유통 센터와 창고의 효율성을 높이기 위해 측정 센서를 사용하는 빈도가 증가함에 따라 물류 시장에서 3D 측정 센서의 성장이 촉진되고 있습니다.
세그먼트 분석:
기술에 따라 물류 시장의 3D 측정 센서는 다음과 같이 구분됩니다.
- 스테레오 비전
- 구조화된 빛
- 레이저 빛
- 기타
구조화된 조명 세그먼트는 2022년 물류 시장에서 가장 큰 3D 측정 센서를 차지했습니다. 구조화된 조명 기술은 물류에서 3D 측정 기능을 향상시켜 정확한 체적 분석, 차원 검사, 분류 최적화, 로드 계획 및 품질 관리를 가능하게 합니다. 또한 물류에서 물체의 정확한 차원 검사를 가능하게 합니다. 따라서 구조화된 조명에 대한 수요 증가는 예측 기간 동안 물류 시장에서 3D 측정 센서 성장을 더욱 촉진할 것입니다.
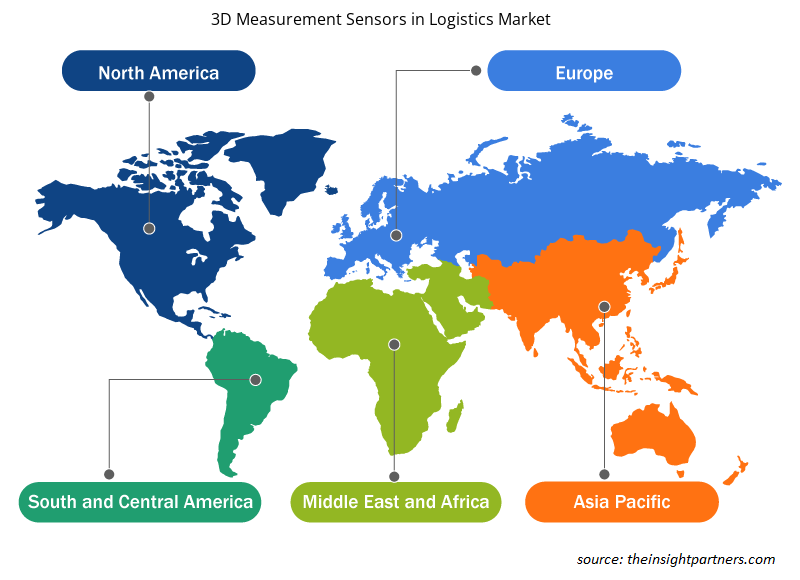
지역 분석:
물류 시장 규모에서 3D 측정 센서는 크게 북미, 유럽, 아시아 태평양(APAC), 중동 및 아프리카(MEA), 남미(SAM)의 5개 주요 지역으로 구분됩니다. 북미는 2022년 물류 시장 점유율에서 가장 큰 3D 측정 센서를 보유했고, 그 뒤를 유럽과 APAC이 이었습니다. APAC은 2022년부터 2030년까지 물류 시장에서 3D 측정 센서에서 가장 높은 CAGR을 기록할 것으로 예상됩니다.
북미에서는 기술 혁신이 물류 시장에서 3D 측정 센서의 성장 기회를 제공할 것으로 예상됩니다. 이 지역의 다양한 물류 회사는 생산성을 높이기 위해 창고를 자동화하고 있습니다. 이는 3D 카메라 와 로봇을 포함한 다양한 창고 자동화 솔루션에 대한 수요를 증가시켜 북미 물류 시장에서 3D 측정 센서의 성장을 촉진하고 있습니다. 또한 이 지역은 전자상거래 산업에서 엄청난 성장을 목격하고 있으며, 이는 물류 산업에서 자동화 도입을 증가시켜 물류 시장 성장에서 3D 측정 센서를 촉진하고 있습니다.
주요 플레이어 분석:
Micro-Epsilon Messtechnik GmbH & Co KG, Infineon Technologies AG, Sony Semiconductor Solutions Corp, Cognex Corp, ifm Electronic GmbH, Intel Corp, LMI Technologies Inc, Keyence Corp, OMRON Corp, Sick AG는 보고서에서 운영되는 물류 시장 플레이어의 주요 3D 측정 센서 중 일부입니다. 플레이어 중에서 Micro-Epsilon Messtechnik GmbH & Co KG와 Infineon Technologies AG는 다양한 제품 포트폴리오로 인해 물류 시장 플레이어의 상위 2개 3D 측정 센서입니다.
물류 시장의 3D 측정 센서 지역 통찰력
Insight Partners의 분석가들은 예측 기간 동안 물류 시장에서 3D 측정 센서에 영향을 미치는 지역적 추세와 요인을 철저히 설명했습니다. 이 섹션에서는 북미, 유럽, 아시아 태평양, 중동 및 아프리카, 남미 및 중미의 물류 시장 세그먼트와 지리에 대해서도 설명합니다.
- 물류 시장에서 3D 측정 센서에 대한 지역별 특정 데이터 얻기
물류 시장 보고서 범위의 3D 측정 센서
| 보고서 속성 | 세부 |
|---|---|
| 2022년 시장 규모 | 1억 2,750만 달러 |
| 2030년까지 시장 규모 | 2억 4,213만 달러 |
| 글로벌 CAGR (2022-2030) | 8.3% |
| 역사적 데이터 | 2020-2021 |
| 예측 기간 | 2023-2030 |
| 다루는 세그먼트 |
유형별로
|
| 포함된 지역 및 국가 |
북아메리카
|
| 시장 선도 기업 및 주요 회사 프로필 |
|
물류 시장 플레이어의 3D 측정 센서 밀도: 비즈니스 역학에 미치는 영향 이해
물류 시장의 3D 측정 센서 시장은 소비자 선호도의 변화, 기술 발전, 제품의 이점에 대한 인식 증가와 같은 요인으로 인해 최종 사용자 수요가 증가함에 따라 빠르게 성장하고 있습니다. 수요가 증가함에 따라 기업은 제품을 확장하고, 소비자의 요구를 충족하기 위해 혁신하고, 새로운 트렌드를 활용하여 시장 성장을 더욱 촉진하고 있습니다.
시장 참여자 밀도는 특정 시장이나 산업 내에서 운영되는 회사나 기업의 분포를 말합니다. 주어진 시장 공간에 얼마나 많은 경쟁자(시장 참여자)가 존재하는지 그 규모나 전체 시장 가치에 비해 나타냅니다.
물류 시장에서 3D 측정 센서를 운영하는 주요 회사는 다음과 같습니다.
- Micro-Epsilon Messtechnik GmbH & Co KG
- 인피니언 테크놀로지스 AG
- 소니 세미컨덕터 솔루션스 코퍼레이션
- 코그넥스 코퍼레이션
- ifm 전자 GmbH
면책 조항 : 위에 나열된 회사는 어떤 특별한 순서에 따라 순위가 매겨지지 않았습니다.
- 물류 시장의 3D 측정 센서 주요 업체 개요를 알아보세요
최근 개발 사항:
합병 및 인수와 같은 무기적 및 유기적 전략은 물류 시장의 3D 측정 센서 기업에서 널리 채택되고 있습니다. 최근 몇 가지 주요 시장 개발은 다음과 같습니다.
- 2021년, Micro-Epsilon은 3D 스냅샷 센서 surfaceCONTROL 3D 3200을 개발했으며, 무광 표면에서 정밀한 기하학, 모양 및 표면 측정에 적합한 선택입니다. 이 센서는 자동화된 인라인 품질 검사를 위해 개발되었습니다.
- 2020년, Infineon Technologies AG는 Cypress Semiconductor Corporation의 인수를 완료했습니다. 이 인수는 고객에게 현실과 디지털 세계를 연결하고 디지털화를 형성하기 위한 업계에서 가장 포괄적인 포트폴리오를 제공하는 경향이 있습니다.
- 2020년 OMRON Corporation은 일본에서 9월 1일부터, 전 세계적으로는 10월 1일부터 B5L 시리즈 내장형 3D TOF 센서 모듈을 판매한다고 발표했습니다. B5L 시리즈는 고유한 광학 설계 기술을 활용하여 햇빛 아래에서도 넓은 영역에 걸쳐 3차원 거리 정보를 안정화합니다.
- 2019년 SICK 그룹은 합작법인의 소유주인 Schädler로부터 미결제 주식 50%를 이전하여 칠레 합작법인 SICK SpA 인수를 완료했습니다. SICK는 이 인수의 결과로 SICK SpA의 유일한 소유자가 되었고, 남미 시장에서의 입지를 강화했습니다.
- 2019년 SICK AG는 중국에 새로운 생산 시설을 개장했으며, 여기에서는 현지화된 제품 제조와 개별 고객을 위한 시스템 구축에 집중할 것입니다. 이 확장을 통해 회사는 고객에게 더욱 향상된 자동화 솔루션을 제공할 수 있게 될 것입니다.

나빈은 맞춤형, 신디케이트 및 컨설팅 프로젝트 전반에 걸쳐 9년 이상의 전문 지식을 보유한 시장 조사 및 컨설팅 전문가입니다. 현재 부사장으로 재직 중이며, 프로젝트 가치 사슬 전반의 이해관계자들을 성공적으로 관리해 왔으며, 100편 이상의 연구 보고서와 30건 이상의 컨설팅 업무를 수행했습니다. 그는 산업 및 정부 프로젝트 전반에 걸쳐 다양한 업무를 수행하며 고객 성공과 데이터 기반 의사 결정에 크게 기여하고 있습니다.
나빈은 카르나타카주 VTU에서 전자통신 공학 학위를, 마니팔 대학교에서 마케팅 및 운영 MBA를 취득했습니다. 그는 9년 동안 IEEE 회원으로 활발하게 활동하며 컨퍼런스, 기술 심포지엄에 참여하고 지역 및 지역 차원에서 자원봉사 활동을 해왔습니다. 현재 직책을 맡기 전에는 IndustryARC에서 준전략 컨설턴트로, 휴렛팩커드(HP Global)에서 산업용 서버 컨설턴트로 근무했습니다.
- 포괄적인 시장 규모 산정 및 전망 분석
- 상세 시장 세분화 분석
- 심층적인 시장 동향 및 요인 분석
- 지역 및 국가별 인사이트
- 경쟁 구도 및 기업 벤치마킹
- 전략적 비즈니스 인텔리전스
사용 후기
Insight Partners의 SCADA 시스템 시장 보고서는 포괄적이며, 현재 동향과 미래 전망에 대한 귀중한 통찰력을 제공합니다. 팀은 매우 전문적이고, 신속하게 대응하며, 처음부터 끝까지 지원해 주었습니다. 저희는 매우 만족하며 Insight Partners의 서비스를 적극 추천합니다.
란 케뎀 파트너, Reali Technologies LTDs아주 구체적인 소프트웨어 시장에 대한 보고서를 요청했는데, 팀에서 며칠 만에 보고서를 작성해 주셨습니다. 정보는 매우 관련성이 높고 잘 정리되어 있었습니다. 그 후 보고서에 몇 가지 수정과 추가 사항을 요청했습니다. 팀원들의 응답도 매우 빨랐고, 일주일도 채 되지 않아 최종 보고서를 받았습니다.
장-에르브 젠 의장, 퓨처 애널리티카The Insight Partners와 함께 중요한 시장 조사 및 예측 작업을 진행했습니다. Insight Partners는 기회와 위험에 대한 명확한 통찰력을 제공하여 계획을 세우는 데 큰 도움이 되었습니다. The Insight Partners의 조사는 사용하기 쉬웠고, 탄탄한 데이터를 기반으로 했습니다. 덕분에 현명하고 자신 있는 결정을 내릴 수 있었습니다. The Insight Partners를 강력 추천합니다.
피유시 나그팔 수석 부사장, 하이빔 글로벌Insight Partners는 탄탄한 분야 전문성을 바탕으로 통찰력 있고 체계적인 시장 조사를 제공했습니다. Insight Partners 팀은 처음부터 끝까지 전문적이고 신속하게 대응했습니다. 사용자 친화적인 웹사이트 덕분에 업계 보고서에 쉽게 접근할 수 있었습니다. 신뢰할 수 있고 고품질의 조사 서비스를 원하신다면 Insight Partners를 강력 추천합니다.
아다치 유키히코 대표이사, 딥블루 주식회사The Insight Partners에서 시장 보고서를 구매한 것은 이번이 처음입니다. 처음에는 확신이 없었지만, 웹사이트를 방문하고 나서 위험을 감수하고 시장 보고서를 구매하는 것이 더 편하다는 것을 알게 되었습니다. 보고서의 품질과 고객 서비스에 매우 만족합니다. 처음 보고서를 보고 몇 가지 질문과 의견이 있었지만, 분석가와 이메일로 몇 차례 대화를 나눈 후, 전략 기획 과정에 참고할 수 있는 보고서를 확보했다고 생각합니다. 시간을 내어 긍정적인 경험을 선사해 주셔서 정말 감사합니다. 다른 사람들에게도 귀사의 서비스를 적극 추천할 것이며, 추가적인 시장 데이터가 필요할 때면 가장 먼저 귀사에 연락하겠습니다.
존 스즈키 사장 겸 최고 경영자, 이사회 이사, BK 테크놀로지스나이지리아 감염성 질환 IVD 시장 관련 정보 요청에 응해 주신 귀사의 지원과 전문성에 감사드립니다. 귀사의 인내심과 지도, 그리고 할인 혜택을 기꺼이 제공해 주셔서 결국 계약을 성사시킬 수 있었습니다. 첫 만남을 통해 귀사가 저에게 심어주신 좋은 인상을 바탕으로 앞으로도 The Insight Partners와 함께할 수 있기를 기대합니다.
치지오케 박사 오니아 전무이사, 파인크레스트 헬스케어 유한회사구매 이유
- 정보에 기반한 의사 결정
- 시장 역학 이해
- 경쟁 분석
- 고객 인사이트
- 시장 예측
- 위험 완화
- 전략 기획
- 투자 타당성 분석
- 신흥 시장 파악
- 마케팅 전략 강화
- 운영 효율성 향상
- 규제 동향에 발맞춰 대응


