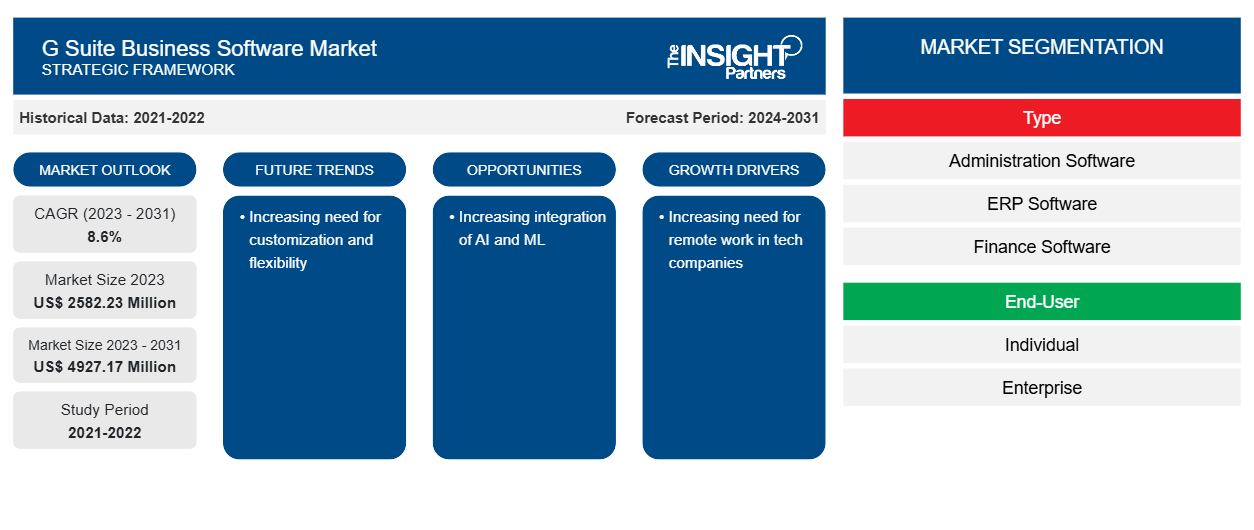
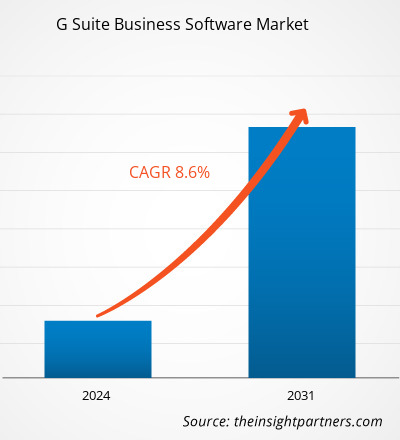
G Suite 비즈니스 소프트웨어 시장 규모는 2023년 25억 8,223만 달러에서 2031년 49억 2,717만 달러로 성장할 것으로 예상됩니다. 이 시장은 2023~2031년 동안 8.6%의 CAGR을 기록할 것으로 예상됩니다. 사용자 정의 및 유연성에 대한 필요성이 증가하는 것은 시장의 주요 추세로 남을 가능성이 높습니다.
G Suite 비즈니스 소프트웨어 시장 분석
G Suite를 사용하면 기업과 조직이 비즈니스 프로세스의 마지막에 Google의 클라우드 기반 생산성 및 협업 도구 모음을 활용할 수 있습니다. 다양한 타사 개발자와 솔루션 제공업체는 기업의 요구 사항에 따라 G Suite 솔루션의 우수한 거버넌스 및 관리를 제공합니다. Calendly는 Google 캘린더와 원활하게 작동하여 모든 예약 및 일정 관련 활동을 관리하는 G Suite용 솔루션을 제공합니다. Mixmax는 영업, 고객 성공, 채용, 영업 운영, 리더십 및 기업가를 위한 캘린더 솔루션과 이메일 생산성 플랫폼을 제공합니다. 타사 회사는 기업의 생산성과 관리 용이성을 향상시키고 고객에게 맞춤형 요구 사항을 제공하는 G Suite용 추가 도구를 제공합니다.
G Suite 비즈니스 소프트웨어 시장 개요
G Suite는 Google에서 설계하고 제공하는 SaaS(Software as a Service) 애플리케이션 모음입니다. 이러한 클라우드 기반 앱은 비즈니스, 협업, 생산성, 교육과 같은 다양한 분야에 초점을 맞춥니다. Gmail, Docs, Sheets, Drive, Calendar, Google+, Slides, Forms, Sites, Hangouts, Keep은 Google에서 제공하는 주요 G-Suite 도구입니다. G Suite는 전 세계의 기업 과 개인에게 귀중한 리소스입니다.
귀하의 요구 사항에 맞게 이 보고서를 사용자 정의하세요
이 보고서의 일부 또는 국가 수준 분석, Excel 데이터 팩을 포함하여 모든 보고서에 대한 사용자 정의를 무료로 받을 수 있으며 신생 기업 및 대학을 위한 훌륭한 혜택과 할인 혜택을 이용할 수 있습니다.
G Suite 비즈니스 소프트웨어 시장:
- 이 보고서의 주요 시장 동향을 알아보세요.이 무료 샘플에는 시장 동향부터 추정 및 예측까지 다양한 데이터 분석이 포함됩니다.
G Suite 비즈니스 소프트웨어 시장 동인 및 기회
기술 회사에서 원격 근무에 대한 필요성 증가
고용주들은 원격 또는 하이브리드 작업 모델을 제공하는 회사의 직위에 점점 더 관심을 갖고 있으며, 점점 더 많은 고용주들이 이러한 추세를 인식하고 있습니다. 구인 공고 웹사이트 FlexJobs.com의 보고서에 따르면 2021년부터 2022년까지 원격 직책 공고가 전년 대비 12%에서 12%로 증가했습니다. 원격 근무의 인기는 주요 요인이 되었으며 고용주가 재택 근무에 대한 고용 정책을 개선함에 따라 증가할 가능성이 높습니다. 따라서 기술 회사에서 원격 근무에 대한 펜 수요가 증가함에 따라 G Suite 비즈니스 소프트웨어 시장이 주도되고 있습니다.
AI의 통합 증가
AI와 ML의 도움으로 G Suite는 보안 도구를 추가합니다. 다양한 회사가 AI와 ML 기술을 사용하여 G Suite 비즈니스 소프트웨어를 배포하고 있습니다. 예를 들어, 2020년에 검색 대기업은 Google Docs 및 Sheets와 비슷하지만 사무실에 맞게 조정된 앱 세트인 AI를 사용하여 G Suite에 대한 여러 업데이트를 발표했습니다. 이 회사는 샌프란시스코에서 열린 연례 Google Cloud Next 컨퍼런스에서 이를 발표했습니다. 따라서 G Suite 비즈니스 소프트웨어와 AI의 통합이 증가함에 따라 시장에 더 많은 기회가 창출되고 있습니다.
G Suite 비즈니스 소프트웨어 시장 보고서 세분화 분석
G Suite 비즈니스 소프트웨어 시장 분석에서 중요한 요소는 유형과 최종 사용자입니다.
- G Suite 비즈니스 소프트웨어 시장은 유형에 따라 관리 소프트웨어, ERP 소프트웨어, 재무 소프트웨어, HR 소프트웨어 등으로 구분됩니다. 맞춤형 세그먼트는 2023년에 더 큰 시장 점유율을 차지했습니다.
- 최종 사용자를 기준으로 시장은 개인, 기업, 기타로 구분됩니다.
지역별 G Suite 비즈니스 소프트웨어 시장 점유율 분석
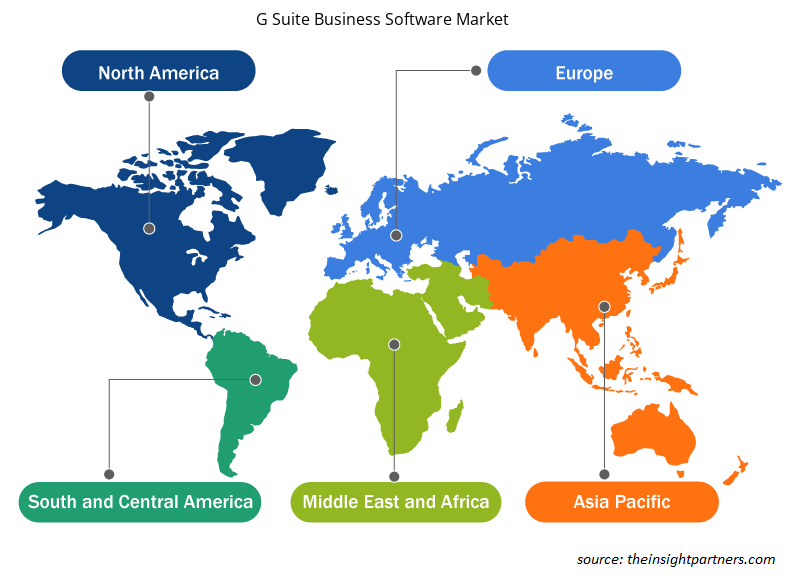
G Suite 비즈니스 소프트웨어 시장 보고서의 지리적 범위는 주로 북미, 아시아 태평양, 유럽, 중동 및 아프리카, 남중부 아메리카의 5개 지역으로 나뉩니다.
APAC는 G Suite 비즈니스 소프트웨어 시장을 지배합니다. 이 지역의 G Suite 비즈니스 소프트웨어 시장은 조직의 보안 개선 이니셔티브 증가와 잘 정립된 G Suite 비즈니스 소프트웨어 공급업체 의 존재 등 다양한 요인으로 인해 성장하고 있습니다 .
G Suite 비즈니스 소프트웨어 시장 지역 통찰력
Insight Partners의 분석가들은 예측 기간 동안 G Suite 비즈니스 소프트웨어 시장에 영향을 미치는 지역적 추세와 요인을 철저히 설명했습니다. 이 섹션에서는 북미, 유럽, 아시아 태평양, 중동 및 아프리카, 남미 및 중미의 G Suite 비즈니스 소프트웨어 시장 세그먼트와 지리적 분포도 논의합니다.
- G Suite 비즈니스 소프트웨어 시장에 대한 지역별 데이터 얻기
G Suite 비즈니스 소프트웨어 시장 보고서 범위
| 보고서 속성 | 세부 |
|---|---|
| 2023년 시장 규모 | 25억 8,223만 달러 |
| 2031년까지 시장 규모 | 49억 2,717만 달러 |
| 글로벌 CAGR (2023-2031) | 8.6% |
| 역사적 데이터 | 2021-2022 |
| 예측 기간 | 2024-2031 |
| 다루는 세그먼트 | 유형별로
|
| 포함된 지역 및 국가 | 북아메리카
|
| 시장 선도 기업 및 주요 회사 프로필 |
|
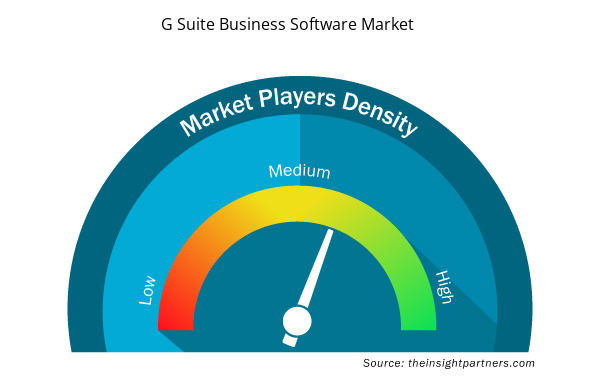
G Suite 비즈니스 소프트웨어 시장 참여자 밀도: 비즈니스 역학에 미치는 영향 이해
G Suite 비즈니스 소프트웨어 시장은 소비자 선호도의 변화, 기술 발전, 제품의 이점에 대한 인식 증가와 같은 요인으로 인해 최종 사용자 수요가 증가함에 따라 빠르게 성장하고 있습니다. 수요가 증가함에 따라 기업은 제품을 확장하고, 소비자의 요구를 충족하기 위해 혁신하고, 새로운 트렌드를 활용하여 시장 성장을 더욱 촉진하고 있습니다.
시장 참여자 밀도는 특정 시장이나 산업 내에서 운영되는 회사나 기업의 분포를 말합니다. 주어진 시장 공간에 얼마나 많은 경쟁자(시장 참여자)가 존재하는지 그 규모나 전체 시장 가치에 비해 나타냅니다.
G Suite 비즈니스 소프트웨어 시장에서 운영되는 주요 회사는 다음과 같습니다.
- 홈
- 메일트랙.IO
- 칼렌들리
- 주식회사 넷헌트
- 믹스맥스
- Salesforce.com 주식회사
면책 조항 : 위에 나열된 회사는 어떤 특별한 순서에 따라 순위가 매겨지지 않았습니다.
- G Suite 비즈니스 소프트웨어 시장 주요 업체 개요를 알아보세요
G Suite 비즈니스 소프트웨어 시장 뉴스 및 최근 개발 사항
G suite 비즈니스 소프트웨어 시장은 1차 및 2차 조사 이후의 질적, 양적 데이터를 수집하여 평가합니다. 여기에는 중요한 기업 출판물, 협회 데이터, 데이터베이스가 포함됩니다. G suite 비즈니스 소프트웨어 시장의 몇 가지 개발 사항은 다음과 같습니다.
- Google은 Gmail, Drive, Docs, Meet 등을 포함한 기업용 온라인 생산성 및 협업 도구 세트인 G Suite를 리브랜딩했습니다. 새 이름은 Google Workspace로, 이 회사는 올해 초에 이 서비스에 대한 새로운 협업 도구 세트와 Google Meet 통합을 처음 도입했을 때 이미 암시한 이름입니다. (출처: Google, 보도자료, 2020년 10월)
- Google의 G Suite에 새로운 AI 및 보안 도구가 추가되었습니다. 이 검색 대기업은 Google Docs 및 Sheets와 비슷하지만 사무실에 맞게 조정된 앱 세트인 G Suite에 대한 여러 업데이트를 발표했습니다. (출처: Tungsram Group, 보도 자료, 2021년 7월)
G Suite 비즈니스 소프트웨어 시장 보고서 범위 및 제공물
"G Suite 비즈니스 소프트웨어 시장 규모 및 예측(2021-2031)" 보고서는 아래 영역을 포괄하는 시장에 대한 자세한 분석을 제공합니다.
- 범위에 포함된 모든 주요 시장 세그먼트에 대한 글로벌, 지역 및 국가 수준의 G Suite 비즈니스 소프트웨어 시장 규모 및 예측
- G Suite 비즈니스 소프트웨어 시장 동향과 동인, 제약, 주요 기회와 같은 시장 역학
- 자세한 PEST/포터의 5가지 힘 및 SWOT 분석
- 주요 시장 동향, 글로벌 및 지역 프레임워크, 주요 업체, 규정 및 최근 시장 개발 사항을 포괄하는 G Suite 비즈니스 소프트웨어 시장 분석
- 시장 집중도, 히트맵 분석, 유명 업체, G Suite 비즈니스 소프트웨어 시장의 최근 개발 사항을 다루는 산업 환경 및 경쟁 분석
- 자세한 회사 프로필
- 역사적 분석(2년), 기준 연도, CAGR을 포함한 예측(7년)
- PEST 및 SWOT 분석
- 시장 규모 가치/양 - 글로벌, 지역, 국가
- 산업 및 경쟁 환경
- Excel 데이터 세트
- Arterial Blood Gas Kits Market
- Europe Surety Market
- Resistance Bands Market
- Fixed-Base Operator Market
- Radiopharmaceuticals Market
- Digital Language Learning Market
- Batter and Breader Premixes Market
- Dairy Flavors Market
- Artificial Intelligence in Healthcare Diagnosis Market
- Aesthetic Medical Devices Market

Report Coverage
Revenue forecast, Company Analysis, Industry landscape, Growth factors, and Trends

Segment Covered
This text is related
to segments covered.

Regional Scope
North America, Europe, Asia Pacific, Middle East & Africa, South & Central America

Country Scope
This text is related
to country scope.
자주 묻는 질문
The expected CAGR of the global G suite business software market is 8.6%.
The global G suite business software market is expected to reach US$ 4927.17 million by 2031.
The key players holding majority shares in the global G suite business software market are GROOVE, MAILTRACK.IO, Calendly, NetHunt Inc., Mixmax, Salesforce.com, inc., Rewardly, Inc, Zendesk, Expensify, Inc., and Freshworks Inc.
The increasing need for customization and flexibility is anticipated to play a significant role in the global G suite business software market in the coming years.
The increasing need for remote work in tech companies and the increasing integration of AI and ML are the major factors that propel the global G suite business software market.
Europe dominates the G suite business software market.
Trends and growth analysis reports related to Technology, Media and Telecommunications : READ MORE..
The Insight Partners performs research in 4 major stages: Data Collection & Secondary Research, Primary Research, Data Analysis and Data Triangulation & Final Review.
- Data Collection and Secondary Research:
As a market research and consulting firm operating from a decade, we have published and advised several client across the globe. First step for any study will start with an assessment of currently available data and insights from existing reports. Further, historical and current market information is collected from Investor Presentations, Annual Reports, SEC Filings, etc., and other information related to company’s performance and market positioning are gathered from Paid Databases (Factiva, Hoovers, and Reuters) and various other publications available in public domain.
Several associations trade associates, technical forums, institutes, societies and organization are accessed to gain technical as well as market related insights through their publications such as research papers, blogs and press releases related to the studies are referred to get cues about the market. Further, white papers, journals, magazines, and other news articles published in last 3 years are scrutinized and analyzed to understand the current market trends.
- Primary Research:
The primarily interview analysis comprise of data obtained from industry participants interview and answers to survey questions gathered by in-house primary team.
For primary research, interviews are conducted with industry experts/CEOs/Marketing Managers/VPs/Subject Matter Experts from both demand and supply side to get a 360-degree view of the market. The primary team conducts several interviews based on the complexity of the markets to understand the various market trends and dynamics which makes research more credible and precise.
A typical research interview fulfils the following functions:
- Provides first-hand information on the market size, market trends, growth trends, competitive landscape, and outlook
- Validates and strengthens in-house secondary research findings
- Develops the analysis team’s expertise and market understanding
Primary research involves email interactions and telephone interviews for each market, category, segment, and sub-segment across geographies. The participants who typically take part in such a process include, but are not limited to:
- Industry participants: VPs, business development managers, market intelligence managers and national sales managers
- Outside experts: Valuation experts, research analysts and key opinion leaders specializing in the electronics and semiconductor industry.
Below is the breakup of our primary respondents by company, designation, and region:

Once we receive the confirmation from primary research sources or primary respondents, we finalize the base year market estimation and forecast the data as per the macroeconomic and microeconomic factors assessed during data collection.
- Data Analysis:
Once data is validated through both secondary as well as primary respondents, we finalize the market estimations by hypothesis formulation and factor analysis at regional and country level.
- Macro-Economic Factor Analysis:
We analyse macroeconomic indicators such the gross domestic product (GDP), increase in the demand for goods and services across industries, technological advancement, regional economic growth, governmental policies, the influence of COVID-19, PEST analysis, and other aspects. This analysis aids in setting benchmarks for various nations/regions and approximating market splits. Additionally, the general trend of the aforementioned components aid in determining the market's development possibilities.
- Country Level Data:
Various factors that are especially aligned to the country are taken into account to determine the market size for a certain area and country, including the presence of vendors, such as headquarters and offices, the country's GDP, demand patterns, and industry growth. To comprehend the market dynamics for the nation, a number of growth variables, inhibitors, application areas, and current market trends are researched. The aforementioned elements aid in determining the country's overall market's growth potential.
- Company Profile:
The “Table of Contents” is formulated by listing and analyzing more than 25 - 30 companies operating in the market ecosystem across geographies. However, we profile only 10 companies as a standard practice in our syndicate reports. These 10 companies comprise leading, emerging, and regional players. Nonetheless, our analysis is not restricted to the 10 listed companies, we also analyze other companies present in the market to develop a holistic view and understand the prevailing trends. The “Company Profiles” section in the report covers key facts, business description, products & services, financial information, SWOT analysis, and key developments. The financial information presented is extracted from the annual reports and official documents of the publicly listed companies. Upon collecting the information for the sections of respective companies, we verify them via various primary sources and then compile the data in respective company profiles. The company level information helps us in deriving the base number as well as in forecasting the market size.
- Developing Base Number:
Aggregation of sales statistics (2020-2022) and macro-economic factor, and other secondary and primary research insights are utilized to arrive at base number and related market shares for 2022. The data gaps are identified in this step and relevant market data is analyzed, collected from paid primary interviews or databases. On finalizing the base year market size, forecasts are developed on the basis of macro-economic, industry and market growth factors and company level analysis.
- Data Triangulation and Final Review:
The market findings and base year market size calculations are validated from supply as well as demand side. Demand side validations are based on macro-economic factor analysis and benchmarks for respective regions and countries. In case of supply side validations, revenues of major companies are estimated (in case not available) based on industry benchmark, approximate number of employees, product portfolio, and primary interviews revenues are gathered. Further revenue from target product/service segment is assessed to avoid overshooting of market statistics. In case of heavy deviations between supply and demand side values, all thes steps are repeated to achieve synchronization.
We follow an iterative model, wherein we share our research findings with Subject Matter Experts (SME’s) and Key Opinion Leaders (KOLs) until consensus view of the market is not formulated – this model negates any drastic deviation in the opinions of experts. Only validated and universally acceptable research findings are quoted in our reports.
We have important check points that we use to validate our research findings – which we call – data triangulation, where we validate the information, we generate from secondary sources with primary interviews and then we re-validate with our internal data bases and Subject matter experts. This comprehensive model enables us to deliver high quality, reliable data in shortest possible time.
 이 보고서에 대한 무료 샘플을 받으세요