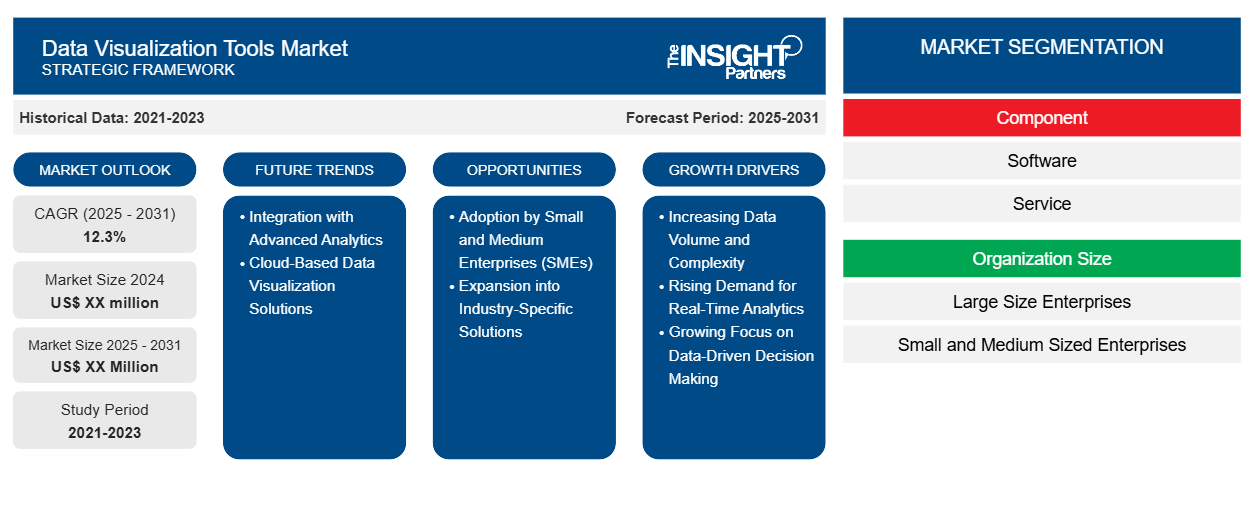
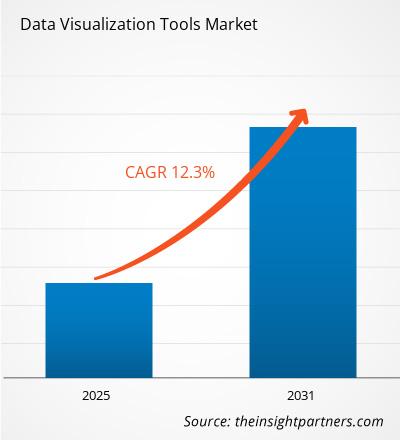
The Data Visualization Tools Market is expected to register a CAGR of 12.3% from 2025 to 2031, with a market size expanding from US$ XX million in 2024 to US$ XX Million by 2031.
The report is segmented By Component (Software, Service), Organization Size (Large Size Enterprises, Small and Medium Sized Enterprises), Deployment (Cloud, On-premise), End-users (BFSI, IT and Telecommunication, Manufacturing, Healthcare & Life Sciences, Retail and E-commerce, Government, Others). The global analysis is further broken-down at regional level and major countries. The report offers the value in USD for the above analysis and segments
Purpose of the Report
The report Data Visualization Tools Market by The Insight Partners aims to describe the present landscape and future growth, top driving factors, challenges, and opportunities. This will provide insights to various business stakeholders, such as:
- Technology Providers/Manufacturers: To understand the evolving market dynamics and know the potential growth opportunities, enabling them to make informed strategic decisions.
- Investors: To conduct a comprehensive trend analysis regarding the market growth rate, market financial projections, and opportunities that exist across the value chain.
- Regulatory bodies: To regulate policies and police activities in the market with the aim of minimizing abuse, preserving investor trust and confidence, and upholding the integrity and stability of the market.
Data Visualization Tools Market Segmentation
Component
- Software
- Service
Organization Size
- Large Size Enterprises
- Small and Medium Sized Enterprises
Deployment
- Cloud
- On-premise
End-users
- BFSI
- IT and Telecommunication
- Manufacturing
- Healthcare & Life Sciences
- Retail and E-commerce
- Government
Customize This Report To Suit Your Requirement
You will get customization on any report - free of charge - including parts of this report, or country-level analysis, Excel Data pack, as well as avail great offers and discounts for start-ups & universities
Data Visualization Tools Market: Strategic Insights
- Get Top Key Market Trends of this report.This FREE sample will include data analysis, ranging from market trends to estimates and forecasts.
Data Visualization Tools Market Growth Drivers
- Increasing Data Volume and Complexity: As organizations generate and store massive amounts of data, the complexity of analyzing and deriving insights grows. Data visualization tools help users make sense of large, complex datasets by presenting them in an easy-to-understand visual format. This demand for efficient data interpretation is driving the adoption of data visualization tools across various industries, from finance to healthcare.
- Rising Demand for Real-Time Analytics: The growing need for real-time data analysis is a key driver of the data visualization market. Businesses are increasingly relying on real-time dashboards and visual analytics to make quicker, data-driven decisions. These tools allow companies to monitor performance, track KPIs, and respond to market changes instantly, boosting the demand for effective visualization software.
- Growing Focus on Data-Driven Decision Making: More organizations are adopting data-driven strategies to stay competitive. Data visualization tools enable decision-makers to view trends, identify patterns, and analyze KPIs easily. By transforming raw data into interactive visuals, these tools support faster and more accurate decision-making, driving market growth across industries.
Data Visualization Tools Market Future Trends
- Integration with Advanced Analytics: Data visualization tools are increasingly being integrated with advanced analytics technologies, such as artificial intelligence (AI) and machine learning (ML). This integration allows users to create more predictive and actionable insights through enhanced visualizations. As these capabilities evolve, they are pushing the adoption of data visualization tools, making them more valuable for businesses looking to extract deeper insights from their data.
- Cloud-Based Data Visualization Solutions: Cloud-based data visualization tools are becoming more prevalent due to their scalability, ease of access, and cost-effectiveness. These solutions allow businesses to collaborate on visual analytics from anywhere, reduce the need for on-premise infrastructure, and provide real-time access to data. This trend is driving the growth of cloud-based platforms within the data visualization market, especially for remote teams and global enterprises.
Data Visualization Tools Market Opportunities
- Adoption by Small and Medium Enterprises (SMEs): Traditionally, data visualization tools were primarily adopted by large enterprises. However, as these tools become more affordable and user-friendly, there is a growing opportunity to cater to small and medium-sized enterprises (SMEs). Offering tailored, cost-effective solutions to SMEs allows vendors to tap into an underserved market, expanding the data visualization tools market significantly.
- Expansion into Industry-Specific Solutions: There is an increasing demand for data visualization tools that are customized for specific industries, such as healthcare, finance, and retail. By developing vertical-specific solutions, providers can address unique needs like regulatory compliance, financial forecasting, or patient care insights. This industry-focused approach presents a significant opportunity for growth, as organizations seek tailored solutions for more precise and relevant data visualization.
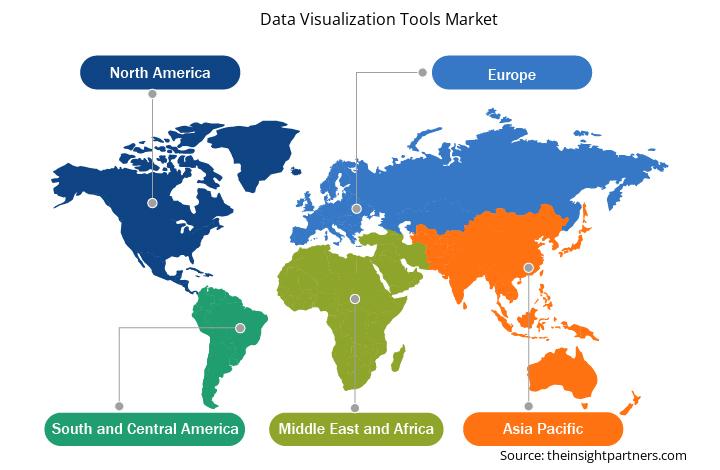
Data Visualization Tools Market Regional Insights
The regional trends and factors influencing the Data Visualization Tools Market throughout the forecast period have been thoroughly explained by the analysts at Insight Partners. This section also discusses Data Visualization Tools Market segments and geography across North America, Europe, Asia Pacific, Middle East and Africa, and South and Central America.
- Get the Regional Specific Data for Data Visualization Tools Market
Data Visualization Tools Market Report Scope
| Report Attribute | Details |
|---|---|
| Market size in 2024 | US$ XX million |
| Market Size by 2031 | US$ XX Million |
| Global CAGR (2025 - 2031) | 12.3% |
| Historical Data | 2021-2023 |
| Forecast period | 2025-2031 |
| Segments Covered |
By Component
|
| Regions and Countries Covered | North America
|
| Market leaders and key company profiles |
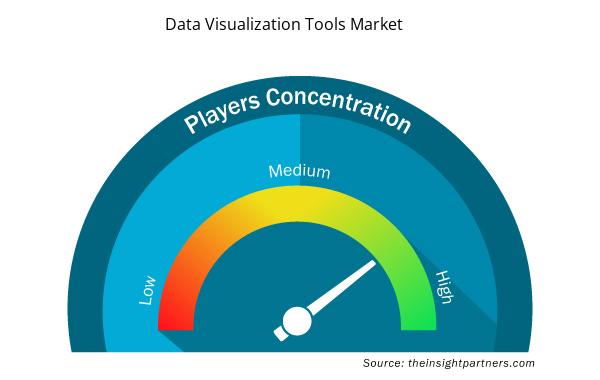
Data Visualization Tools Market Players Density: Understanding Its Impact on Business Dynamics
The Data Visualization Tools Market market is growing rapidly, driven by increasing end-user demand due to factors such as evolving consumer preferences, technological advancements, and greater awareness of the product's benefits. As demand rises, businesses are expanding their offerings, innovating to meet consumer needs, and capitalizing on emerging trends, which further fuels market growth.
Market players density refers to the distribution of firms or companies operating within a particular market or industry. It indicates how many competitors (market players) are present in a given market space relative to its size or total market value.
Major Companies operating in the Data Visualization Tools Market are:
- Salesforce, Inc.
- Alibaba Cloud
- Oracle
- Amazon Web Services, Inc.
- SAS Institute Inc.
- Sisense Inc.
Disclaimer: The companies listed above are not ranked in any particular order.
- Get the Data Visualization Tools Market top key players overview
Key Selling Points
- Comprehensive Coverage: The report comprehensively covers the analysis of products, services, types, and end users of the Data Visualization Tools Market, providing a holistic landscape.
- Expert Analysis: The report is compiled based on the in-depth understanding of industry experts and analysts.
- Up-to-date Information: The report assures business relevance due to its coverage of recent information and data trends.
- Customization Options: This report can be customized to cater to specific client requirements and suit the business strategies aptly.
The research report on the Data Visualization Tools Market can, therefore, help spearhead the trail of decoding and understanding the industry scenario and growth prospects. Although there can be a few valid concerns, the overall benefits of this report tend to outweigh the disadvantages.
- Historical Analysis (2 Years), Base Year, Forecast (7 Years) with CAGR
- PEST and SWOT Analysis
- Market Size Value / Volume - Global, Regional, Country
- Industry and Competitive Landscape
- Excel Dataset
- Vertical Farming Crops Market
- Sports Technology Market
- Sterilization Services Market
- Adaptive Traffic Control System Market
- Webbing Market
- Dealer Management System Market
- Semiconductor Metrology and Inspection Market
- Nuclear Decommissioning Services Market
- Point of Care Diagnostics Market
- Sandwich Panel Market

Report Coverage
Revenue forecast, Company Analysis, Industry landscape, Growth factors, and Trends

Segment Covered
This text is related
to segments covered.

Regional Scope
North America, Europe, Asia Pacific, Middle East & Africa, South & Central America

Country Scope
This text is related
to country scope.
Frequently Asked Questions
Some of the customization options available based on the request are an additional 3–5 company profiles and country-specific analysis of 3–5 countries of your choice. Customizations are to be requested/discussed before making final order confirmation# as our team would review the same and check the feasibility
The report can be delivered in PDF/PPT format; we can also share excel dataset based on the request
Integration with Advanced Analytics and Cloud-Based Data Visualization Solutions to play a significant role in the global data visualization tools market in the coming years
Increasing Data Volume and Complexity and Rising Demand for Real-Time Analytics fueling market demand are the major factors driving the data visualization tools market
The global data visualization tools market is expected to grow at a CAGR of 12.3% during the forecast period 2024 - 2031
 Get Free Sample For