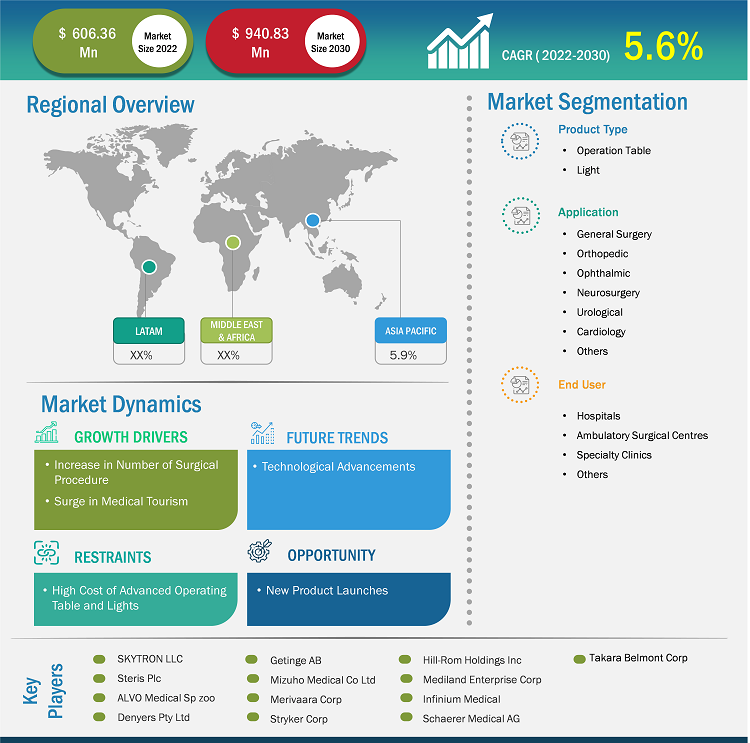
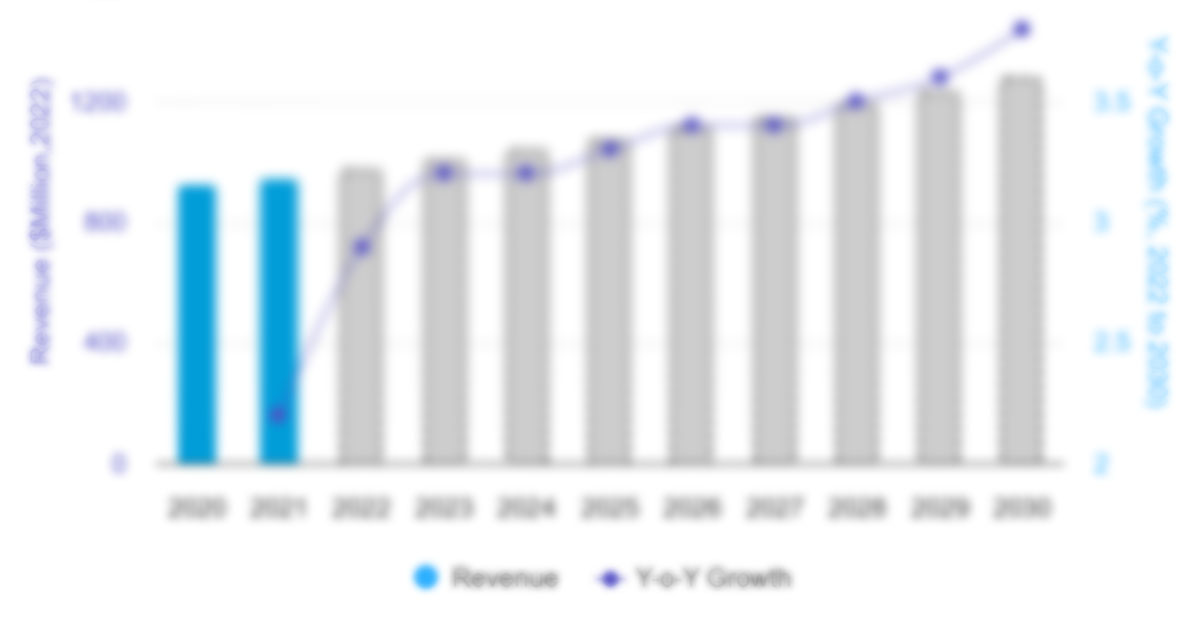
The operating table and light market size was valued at US$ 606.36 million in 2022 and is projected to reach US$ 940.83 million by 2030. It is estimated to register a CAGR of 12.3% during 2022–2030
Market Insights and Analyst View:
The operating table and light market size is increasing with the growing number of surgical procedures performed owing to the rising prevalence of chronic conditions such as cardiovascular disease, cancer, and orthopedic disorders. Additionally, an upsurge in medical tourism in developing regions such as South & Central America and Asia Pacific is expected to create the demand for operating tables and lights. The launch and adoption of advanced operating tables and lights, and the burgeoning healthcare expenditure in developing countries also contribute to the operating table and light market growth, as these are essential equipment in operating rooms.
Growth Drivers and Challenges:
Asia Pacific countries offer high-quality and low-cost medical care to a large population and the cost of procedures is 40–80% less in these countries, compared to the cost of the same procedures in the US. The region has the presence of major global market players, including medical technology and pharmaceutical companies, which create and maintain a cutting-edge research environment for uninterrupted innovations in the field of medicine. According to the International Monetary Fund Report, Asia Pacific is expected to grow by 4.6% in terms of GDP in 2023; India and China together contribute to almost 50% of the global GDP growth. India is one of the fastest developing countries in Asia Pacific and is equipped with advanced healthcare facilities, which has drawn the attention of neighboring countries such as Sri Lanka, Indonesia, Bangladesh, and Maldives. As per an article published in the Times of India in 2022, ~2 million patients from 78 different countries visit India every year to seek medical treatments. The Indian government also supports medical tourism in the country through the “Heal in India Initiative” that eases the visa forex norms for patients. Thailand, Malaysia, and Singapore, among others, are also major medical tourism destinations preferred by patients all over the world.
Governments of countries in the Middle East & Africa are collaborating with governments of developed countries across the world to improve their healthcare services, which would help them attract medical tourists in large numbers. The UAE government has collaborated with US-based hospitals, which provides the healthcare sector in the UAE access to cutting-edge technologies. This allows them to improve healthcare facilities, services, and patient care. For instance, Mayo Clinic, Johns Hopkins Hospital, and the Cleveland Clinic Foundation have signed memoranda of understanding with the ambassador of the UAE for facilitating ongoing collaborations between the American hospitals and their counterparts in the UAE to provide enhanced medical care to designated Emirati patients. In the UAE, the healthcare system is mostly funded by the government; however, in the last few years, there has been a significant increase in private sector investments in this sector. Thus, the operating table and light market is flourishing with developments in healthcare services and an increase in medical tourism in Asia Pacific, the Middle East & Africa, and South & Central America.
Operating tables and lights are crucial equipment as they help healthcare professionals provide high-quality care during surgical procedures, which is followed by a speedy recovery of patients. The high cost of operating tables and lights is mainly ascribed to the cost of materials, technologies, R&D, and regulatory compliance. Manufacturers may charge premium prices for their advanced products due to the specialized nature of the equipment. Moreover, the regulatory policies vary in every country, which can lead to fluctuations in the set of mandatory requirements for the operating table and lights.
Manufacturers operating in the operating table and light market are focused on the development and manufacturing of advanced products to provide comfort and ease of access for both patients and healthcare professionals during surgical procedures. The incorporation of upgraded technologies can increase the cost of equipment, making them unaffordable for various healthcare facilities in low- and middle-income countries. This leads to the lack of access to proper equipment in healthcare facilities, compromising patient care and safety. Further, the high maintenance cost of operating tables and lights adds to the financial burden for healthcare facilities. Therefore, the high cost of operating tables and lights, maintenance, and regulatory policies hamper the growth of the operating table and light market in Asia Pacific, the Middle East & Africa, and South & Central America.
Customize Research To Suit Your Requirement
We can optimize and tailor the analysis and scope which is unmet through our standard offerings. This flexibility will help you gain the exact information needed for your business planning and decision making.
APAC, MEA and SCA Operating Table and Light Market: Strategic Insights
Market Size Value in US$ 606.36 million in 2022 Market Size Value by US$ 940.83 million by 2030 Growth rate CAGR of 12.3% from 2022 to 2030 Forecast Period 2022-2030 Base Year 2022

Mrinal
Have a question?
Mrinal will walk you through a 15-minute call to present the report’s content and answer all queries if you have any.
 Speak to Analyst
Customize Research To Suit Your Requirement
We can optimize and tailor the analysis and scope which is unmet through our standard offerings. This flexibility will help you gain the exact information needed for your business planning and decision making.
APAC, MEA and SCA Operating Table and Light Market: Strategic Insights
| Market Size Value in | US$ 606.36 million in 2022 |
| Market Size Value by | US$ 940.83 million by 2030 |
| Growth rate | CAGR of 12.3% from 2022 to 2030 |
| Forecast Period | 2022-2030 |
| Base Year | 2022 |
Mrinal
Have a question?
Mrinal will walk you through a 15-minute call to present the report’s content and answer all queries if you have any.
Speak to Analyst
Report Segmentation and Scope:
The operating table and light market is segmented on the basis of product type, application, and end user. Based on product type, the market is bifurcated into operation tables and lights. The operation table segment is subsegmented into general surgery tables, orthopedic surgery tables, neurosurgical operating tables, laparoscopic surgical tables, bariatric surgery tables, radiolucent operating tables, and others. The market for the lights segment is further bifurcated into LED lights and halogen lights. Based on technology, the market for operation tables is further classified into non-powered and powered. Based on application, the operating table and light market is segmented into general surgery, orthopedic, ophthalmic, neurosurgery, urology, cardiology, and others. In terms of end user, the operating table and light market is segmented into ambulatory surgical centers, specialty clinics, and others. Based on geography, the operating table and light market is divided into Asia Pacific (China, Japan, India, South Korea, Australia, Indonesia, Malaysia, Vietnam, Thailand, Philippines, Nepal, and Rest of Asia Pacific), Middle East & Africa (UAE, Saudi Arabia, South Africa, Turkey, Africa, Egypt, Iraq, Syria, Kuwait, and Rest of Middle East & Africa), and South & Central America (Brazil, Mexico, Argentina, Chile, Peru Columbia, Costa Rica, Ecuador, Venezuela, and the Rest of South & Central America).
- Sample PDF showcases the content structure and the nature of the information with qualitative and quantitative analysis.
- Request discounts available for Start-Ups & Universities
Segmental Analysis:
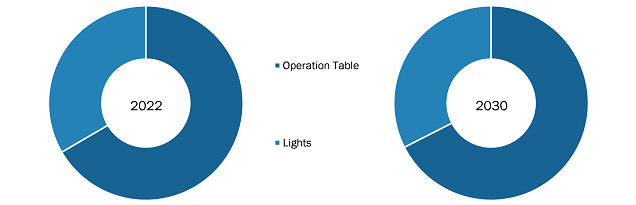
Based on product type, the operating table and light market is bifurcated into operation table and lights. The market for operation tables is subsegmented into general surgery tables, orthopedic surgery tables, neurosurgical operating tables, laparoscopic surgical tables, bariatric surgery tables, radiolucent operating tables, and others. The market for lights is further bifurcated into LED lights and halogen lights. Based on technology, the market for operation tables is further classified into non-powered and powered. In 2022, the operation table segment held a larger share of the overall operating table and light market, and it is further expected to record a higher CAGR during 2022–2028.
An operating table, also known as a surgical table, is generally used within a surgical suite or an operating room of healthcare facilities where surgeries are performed, such as hospitals and ambulatory surgery centers. Operating tables are either stationary or mobile; mobile tables can be moved from room to room. Operating tables are necessary for hassle-free orthopedic, cardiothoracic, robotic, bariatric, and urological procedures, among many others.
Manual operating tables are designed for operations performed on the head, neck, abdomen, chest, and limbs, among other general surgeries. These tables and shells are made of high-quality stainless steel. Surgeons can control the movements of manually operating tables in upward and downward directions, which provides them with easy and better access to the patient’s body. However, as there are no auto-control provisions in manual tables, operating them may lead to distractions for surgeons during surgical procedures.
In electric operating tables, functions such as table movements, height adjustments, and tabletop inclination angles can be controlled through remote control devices, which helps simplify surgical tasks without any distractions for the surgeon. Surgeons these days prefer working comfort during a surgical procedure, which triggers the demand for hydraulic, semi-electric, electro-hydraulic, and electric operating tables. The movements of a powered table can be controlled with the help of a remote control that helps the functioning of an electric actuator. For example, the KME-1204 sliding top electric OT table from Koinaa Medical Equipment is appropriate for all kinds of surgeries, including general surgery; cardiological, neurological, and vascular procedures; urology, gynecology, proctology, and plastic surgeries; laparoscopy; and traumatic surgeries.
Operating Table and Light Market, by Product Type – 2022 and 2030
- Sample PDF showcases the content structure and the nature of the information with qualitative and quantitative analysis.
- Request discounts available for Start-Ups & Universities
- Sample PDF showcases the content structure and the nature of the information with qualitative and quantitative analysis.
- Request discounts available for Start-Ups & Universities
Based on application, the operating table and light market is classified into general surgery, orthopedic, ophthalmic, neurosurgery, urology, cardiology, and others. In 2022, the orthopedic segment held the largest share of the market. The same segment is expected to record the fastest CAGR during 2022–2030. . Orthopedics focuses on the treatment of musculoskeletal systems, which primarily include bones, joints, ligaments, tendons, muscles, and nerves. A few of the more common types of orthopedic surgery procedures are hip replacement, knee replacement, ACL surgery, and shoulder cuff surgery. Orthopedic tables are designed for easy control and adjustability. Surgeons need precise control of the space around them, optimal access to the surgical site on the body, and flexibility while performing open and minimally invasive orthopedic procedures such as pelvic and hip fractures, anterior approach total hip arthroplasty (AATHA), and tibial and fibula fractures.
Based on end user, the operating table and light market is classified into hospitals, ambulatory surgical centers, specialty clinics, and others. In 2022, the hospitals segment held the largest share of the market. It is further estimated to register a significant CAGR during 2022–2030. Hospitals provide health care to people through complicated but specialized scientific equipment. They are classified as general, specialty, or government facilities. A general hospital is the most common form of hospital, which has an emergency department to deal with medical emergencies and sudden illnesses. Hospitals play an important role in the healthcare system and offer advanced treatment options for patients with orthopedic, ophthalmic, neurosurgery, urological, and cardiological issues, among others. Most surgeries are performed in hospitals, as they provide continuous patient care and monitoring. Surgical performance in the operating room (OR) is supported by effective lighting, which moderates the inherent environmental, operational, and visual challenges related to surgery. Moreover, without the operating tables, surgeons cannot successfully give shape to their surgical tasks.
Regional Analysis:
Based on geography, the operating table and light market is divided into Asia Pacific, Middle East & Africa, and South & Central America. Asia Pacific is the largest contributor to the growth of this market, and it is further expected to be the fastest-growing market in the coming years. The market growth in Asia Pacific is ascribed to the increasing number of surgical procedures, an upsurge in medical tourism, and a rise in the number of product launches. With a well-established healthcare system and the fast-growing pharmaceutical and medical industries, China accounts for a major market share of the operating tables and lights market in Asia Pacific. The market growth in this country is attributed to the increasing prevalence of chronic diseases. In China, there are many hospitals where cancer patients can receive care and treatment. Cancer hospitals offer the most advanced and competent oncology care. Moreover, primary, secondary, and tertiary cancer hospitals are the three levels of cancer hospitals in China based on their technology and resources. The tertiary cancer hospitals serve as China's national and regional medical centers for cancer treatment, and frequently provide therapies for a large number of patients with more serious and complex illnesses. According to an NIH study, from 2010 to 2020, yearly patient admissions by cancer hospitals in China climbed from 1.10 million to 3.24 million.
According to the Global Burden of Disease Study published in October 2020, there is a high burden of diseases in China, such as colorectal cancer, lung cancer, chronic kidney diseases, and heart diseases. Additionally, a study published (in 2023) in the Journal of the American Medical Association states that the prevalence of chronic kidney disease (CKD) is 8.2% in people aged 18 years or older in Mainland China. Moreover, the latest data from the International Agency for Research on Cancer (IARC) indicates the estimated age-standardized rate (ASR) for stomach cancer in China is 21 per 100,000, and the crude rate is 33.06; for pancreatic cancer, the ASR is 5 per 100,000 while the crude rate is 8.6. As per the same source, the estimated number of new cases of stomach cancer and pancreatic cancer among people aged 0–74 (of both genders) in 2020 was 478,508 and 124,994, respectively. Thus, the high burden of cancer results in a large number of diagnoses and surgical treatments, propelling the operating table and light market growth in China.
Industry Developments and Future Opportunities:
Various initiatives by key players operating in the operating table and light market are listed below:
- In March 2021, Pharmac approved the listing agreement with Denyers (NZ) Limited to supply operating tables and accessories to district Health Boards (DHBs). Upon purchasing operating tables and accessories from Denyers, DHBs agreed to follow the terms and conditions of the PHARMAC Agreement from March 01, 2021, including pricing.
- In March 2021, Mediland launched a novel C800 electrohydraulic operating table and SunLED Series surgical light with the theme "Feel in Control." Both these products had high-end features, offering surgeons a better operation experience and enhancing working conditions.
- In September 2020, Skytron launched the GS70 Salus surgical table, the first of the Guardian Series surgical table line of the company. This table offers unique and advanced features that would meet any specialized surgical needs of the healthcare professionals.
Competitive Landscape and Key Companies:
A few of the prominent players operating in the operating table and light market in Asia Pacific, the Middle East & Africa, and South & Central America are SKYTRON LLC, Steris Plc, ALVO Medical Sp zoo, Denyers Pty Ltd, Sciton Inc, Getinge AB, Mizuho Medical Co Ltd, Merivaara Corp, Stryker Corp, Hill-Rom Holdings Inc, Mediland Enterprise Corp, Infinium Medical, Schaerer Medical AG, and Takara Belmont Corp. These companies focus on new product launches and geographic expansions to meet the growing consumer demand worldwide as well as to increase their product range in specialty portfolios. Their global presence allows them to serve a large set of customers, subsequently allowing them to expand their market shares.

Report Coverage
Revenue forecast, Company Analysis, Industry landscape, Growth factors, and Trends

Segment Covered
Product Type, Application, End User, and Geography

Regional Scope
North America, Europe, Asia Pacific, Middle East & Africa, South & Central America

Country Scope
This text is related
to country scope.
Frequently Asked Questions
The DNA extraction, isolation, and purification market majorly consists of the players such as SKYTRON LLC, Steris Plc, ALVO Medical Sp zoo, Denyers Pty Ltd, Sciton Inc, Getinge AB, Mizuho Medical Co Ltd, Merivaara Corp, Stryker Corp, Hill-Rom Holdings Inc, Mediland Enterprise Corp, Infinium Medical, Schaerer Medical AG, and Takara Belmont Corp among others.
The factors that are driving growth of the market are increase in number of surgical procedures, and surge in medical tourism.
China holds the largest market share in operating table and light market. The growth of the market in the country. China is a developing country in Asia Pacific with a well-established healthcare system and a fast-growing pharmaceutical & medical industry. The country's market growth is attributed to the increasing prevalence of chronic diseases. In China, there are many hospitals where cancer patients can receive care and treatment.
An operating table, also known as a surgical table, is generally used within a surgical suite or an operating room of healthcare facilities where surgeries are performed, such as hospitals and ambulatory surgery centers. Operating tables are either stationary or mobile; mobile tables can be moved from room to room. Operating tables are necessary for hassle-free orthopedic, cardiothoracic, robotic, bariatric, and urological procedures, among many others. Surgical lights, also known as operating lights, are mainly used in operating rooms in hospitals and ambulatory surgical centers; they can also be used in examination rooms, labor and delivery rooms, and emergency rooms to maintain high-quality lighting conditions. These lights are used by proceduralists, surgeons, and clinicians. Surgical lights are used to illuminate operation sites on patients’ bodies to aid optimum visualization during procedures. They provide hours of bright light without overly heating the air around patients or operators.
The operating table and light market, based on application, is classified into general surgery, orthopedic, ophthalmic, neurosurgery, urology, cardiology, and others. The orthopedic segment held largest market share in 2022. However, the cardiology segment is anticipated to register a higher CAGR during 2022–2030.
The operating table and light market, based on product type, is bifurcated into operation table and lights. In 2022, the operation table segment held the larger share of the market. Moreover, the same segment is expected to grow fastest during 2022–2030.
Asia Pacific is expected to be the fastest growing region in the operating table and light market. The market in Asia Pacific is expected to witness significant growth due to the increase in number of cancer cases in Asian countries, which necessitates medications and surgeries for the prevention and treatment of tumors.
The operating table and light market, based on end user, divided into hospitals, ambulatory surgical centers, specialty clinics, and others. The hospitals segment held the largest share of the market in 2022. However, the specialty clinics segment is anticipated to register the highest CAGR in the market during 2022–2030.
1. Introduction
1.1 The Insight Partners Research Report Guidance
1.2 Market Segmentation
2. Executive Summary
2.1 Key Insights
3. Research Methodology
3.1 Coverage
3.2 Secondary Research
3.3 Primary Research
4. Operating Table and Light Market Landscape
4.1 Overview
4.2 PEST Analysis
4.2.1 Asia Pacific, Middle East & Africa, and South & Central America PEST Analysis
4.3 Import data for Operating Tables and Light
4.3.1 China: Operating Tables and Light Imported (Thousand Dollar) in the Year 2020, 2021 and 2022
4.3.2 India: Operating Tables and Light Imported (Thousand Dollar) in the Year 2020, 2021 and 2022
4.3.3 Indonesia: Operating Tables and Light Imported (Thousand Dollar) in the Year 2020, 2021 and 2022
4.3.4 Malaysia: Operating Tables and Light Imported (Thousand Dollar) in the Year 2020, 2021 and 2022
4.3.5 Malaysia: Operating Tables and Light Imported (Thousand Dollar) in the Year 2020, 2021 and 2022
4.3.6 Brazil: Operating Tables and Light Imported (Thousand Dollar) in the Year 2020, 2021 and 2022
4.3.7 Argentina: Operating Tables and Light Imported (Thousand Dollar) in the Year 2020, 2021 and 2022
4.3.8 Saudi Arabia: Operating Tables and Light Imported (Thousand Dollar) in the Year 2020, 2021 and 2022
4.3.9 Turkey: Operating Tables and Light Imported (Thousand Dollar) in the Year 2020, 2021 and 2022
5. Operating Table and Light Market - Key Industry Dynamics
5.1 Market Drivers
5.1.1 Increase in Number of Surgical Procedures
5.1.2 Surge in Medical Tourism
5.2 Market Restraints
5.2.1 High Cost of Advanced Operating Tables and Lights
5.3 Market Opportunities
5.3.1 New Product Launches
5.4 Future Trends
5.4.1 Technological Advancements
5.5 Impact Analysis
6. Operating Table and Light Market - Asia Pacific, Middle East & Africa, and South & Central America Market Analysis
6.1 Operating Table and Light Market Revenue (US$ Mn), 2022 – 2030
7. Asia Pacific, Middle East & Africa, and South & Central America Operating Table and Light Market – Revenue and Forecast to 2030 – by Product Type
7.1 Overview
7.2 Operating Table and Light Market Revenue Share, by Product Type, 2022 & 2030 (%)
7.3 Operation Table
7.3.1 Overview
7.3.2 Operation Table: Operating Table and Light Market – Revenue and Forecast to 2030 (US$ Million)
7.3.2.1 Operating Table and Light Market, by Operating Table, 2020–2030 (US$ Million)
7.3.2.2 Operating Table and Light Market, by Operating Table Technology, 2020–2030 (US$ Million)
7.4 Light
7.4.1 Overview
7.4.2 Light: Operating Table and Light Market – Revenue and Forecast to 2030 (US$ Million)
7.4.2.1 Operating Table and Light Market, by Lights, 2020–2030 (US$ Million)
8. Asia Pacific, Middle East & Africa, and South & Central America Operating Table and Light Market – Revenue and Forecast to 2030 – by Application.
8.1 Overview
8.2 Operating Table and Light Market Revenue Share, by Application 2022 & 2030 (%)
8.3 General Surgery
8.3.1 Overview
8.3.2 General Surgery: Operating Table and Light Market – Revenue and Forecast to 2030 (US$ Million)
8.4 Orthopedic
8.4.1 Overview
8.4.2 Orthopedic: Operating Table and Light Market – Revenue and Forecast to 2030 (US$ Million)
8.5 Ophthalmic
8.5.1 Overview
8.5.2 Ophthalmic: Operating Table and Light Market – Revenue and Forecast to 2030 (US$ Million)
8.6 Neurosurgery
8.6.1 Overview
8.6.2 Neurosurgery: Operating Table and Light Market – Revenue and Forecast to 2030 (US$ Million)
8.7 Urology
8.7.1 Overview
8.7.2 Urology: Operating Table and Light Market – Revenue and Forecast to 2030 (US$ Million)
8.8 Cardiology
8.8.1 Overview
8.8.2 Cardiology: Operating Table and Light Market – Revenue and Forecast to 2030 (US$ Million)
8.9 Others
8.9.1 Overview
8.9.2 Others: Operating Table and Light Market – Revenue and Forecast to 2030 (US$ Million)
9. Asia Pacific, Middle East & Africa, and South & Central America Operating Table and Light Market – Revenue and Forecast to 2030 – by End User
9.1 Overview
9.2 Operating Table and Light Market Revenue Share, by End User, 2022 & 2030 (%)
9.3 Hospitals
9.3.1 Overview
9.3.2 Hospitals: Operating Table and Light Market – Revenue and Forecast to 2030 (US$ Million)
9.4 Ambulatory Surgical Centers
9.4.1 Overview
9.4.2 Ambulatory Surgical Centers: Operating Table and Light Market – Revenue and Forecast to 2030 (US$ Million)
9.5 Specialty Clinics
9.5.1 Overview
9.5.2 Specialty Clinics: Operating Table and Light Market – Revenue and Forecast to 2030 (US$ Million)
9.6 Others
9.6.1 Overview
9.6.2 Others: Operating Table and Light Market – Revenue and Forecast to 2030 (US$ Million)
10. Operating Table and Light Market - Geographic Analysis
10.1 Asia Pacific Operating Table and Light Market, Revenue and Forecast to 2030
10.1.1 Overview
10.1.2 Asia Pacific Operating Table and Light Market Revenue and Forecast to 2030 (US$ Mn)
10.1.3 Asia Pacific: Operating Table and Light Market, by Product Type, 2020–2030 (US$ Million)
10.1.3.1 Asia Pacific: Operating Table and Light Market, Operation Table by Product Type, 2020–2030 (US$ Million)
10.1.3.2 Asia Pacific: Operating Table and Light Market, Light by Product Type, 2020–2030 (US$ Million)
10.1.3.3 Asia Pacific: Operating Table and Light Market, by Operation Table Technology for Product Type, 2020–2030 (US$ Million)
10.1.4 Asia Pacific: Operating Table and Light Market, by Application, 2020–2030 (US$ Million)
10.1.5 Asia Pacific: Operating Table and Light Market, by End User, 2020–2030 (US$ Million)
10.1.6 Asia Pacific Operating Table and Light Market, by Country
10.1.6.1 China
10.1.6.1.1 Overview
10.1.6.1.2 China Operating Table and Light Market Revenue and Forecast to 2030 (US$ Mn)
10.1.6.1.3 China: Operating Table and Light Market, by Product Type, 2020–2030 (US$ Million)
10.1.6.1.3.1 China: Operating Table and Light Market, Operation Table by Product Type, 2020–2030 (US$ Million)
10.1.6.1.3.2 China: Operating Table and Light Market, Light by Product Type, 2020–2030 (US$ Million)
10.1.6.1.3.3 China: Operating Table and Light Market, by Operation Table Technology for Product Type, 2020–2030 (US$ Million)
10.1.6.1.4 China: Operating Table and Light Market, by Application, 2020–2030 (US$ Million)
10.1.6.1.5 China: Operating Table and Light Market, by End User, 2020–2030 (US$ Million)
10.1.6.2 India
10.1.6.2.1 Overview
10.1.6.2.2 India Operating Table and Light Market Revenue and Forecast to 2030 (US$ Mn)
10.1.6.2.3 India: Operating Table and Light Market, by Product Type, 2020–2030 (US$ Million)
10.1.6.2.3.1 India: Operating Table and Light Market, Operation Table by Product Type, 2020–2030 (US$ Million)
10.1.6.2.3.2 India: Operating Table and Light Market, Light by Product Type, 2020–2030 (US$ Million)
10.1.6.2.3.3 India: Operating Table and Light Market, by Operation Table Technology for Product Type, 2020–2030 (US$ Million)
10.1.6.2.4 India: Operating Table and Light Market, by Application, 2020–2030 (US$ Million)
10.1.6.2.5 India: Operating Table and Light Market, by End User, 2020–2030 (US$ Million)
10.1.6.3 Australia
10.1.6.3.1 Overview
10.1.6.3.2 Australia Operating Table and Light Market Revenue and Forecast to 2030 (US$ Mn)
10.1.6.3.3 Australia: Operating Table and Light Market, by Product Type, 2020–2030 (US$ Million)
10.1.6.3.3.1 Australia: Operating Table and Light Market, Operation Table by Product Type, 2020–2030 (US$ Million)
10.1.6.3.3.2 Australia: Operating Table and Light Market, Light by Product Type, 2020–2030 (US$ Million)
10.1.6.3.3.3 Australia: Operating Table and Light Market, by Operation Table Technology for Product Type, 2020–2030 (US$ Million)
10.1.6.3.4 Australia: Operating Table and Light Market, by Application, 2020–2030 (US$ Million)
10.1.6.3.5 Australia: Operating Table and Light Market, by End User, 2020–2030 (US$ Million)
10.1.6.4 South Korea
10.1.6.4.1 Overview
10.1.6.4.2 South Korea Operating Table and Light Market Revenue and Forecast to 2030 (US$ Mn)
10.1.6.4.3 South Korea: Operating Table and Light Market, by Product Type, 2020–2030 (US$ Million)
10.1.6.4.3.1 South Korea: Operating Table and Light Market, Operation Table by Product Type, 2020–2030 (US$ Million)
10.1.6.4.3.2 South Korea: Operating Table and Light Market, Light by Product Type, 2020–2030 (US$ Million)
10.1.6.4.3.3 South Korea: Operating Table and Light Market, by Operation Table Technology for Product Type, 2020–2030 (US$ Million)
10.1.6.4.4 South Korea: Operating Table and Light Market, by Application, 2020–2030 (US$ Million)
10.1.6.4.5 South Korea: Operating Table and Light Market, by End User, 2020–2030 (US$ Million)
10.1.6.5 Nepal
10.1.6.5.1 Overview
10.1.6.5.2 Nepal Operating Table and Light Market Revenue and Forecast to 2030 (US$ Mn)
10.1.6.5.3 Nepal: Operating Table and Light Market, by Product Type, 2020–2030 (US$ Million)
10.1.6.5.3.1 Nepal: Operating Table and Light Market, Operation Table by Product Type, 2020–2030 (US$ Million)
10.1.6.5.3.2 Nepal: Operating Table and Light Market, Light by Product Type, 2020–2030 (US$ Million)
10.1.6.5.3.3 Nepal: Operating Table and Light Market, by Operation Table Technology for Product Type, 2020–2030 (US$ Million)
10.1.6.5.4 Nepal: Operating Table and Light Market, by Application, 2020–2030 (US$ Million)
10.1.6.5.5 Nepal: Operating Table and Light Market, by End User, 2020–2030 (US$ Million)
10.1.6.6 Thailand
10.1.6.6.1 Overview
10.1.6.6.2 Thailand Operating Table and Light Market Revenue and Forecast to 2030 (US$ Mn)
10.1.6.6.3 Thailand: Operating Table and Light Market, by Product Type, 2020–2030 (US$ Million)
10.1.6.6.3.1 Thailand: Operating Table and Light Market, Operation Table by Product Type, 2020–2030 (US$ Million)
10.1.6.6.3.2 Thailand: Operating Table and Light Market, Light by Product Type, 2020–2030 (US$ Million)
10.1.6.6.3.3 Thailand: Operating Table and Light Market, by Operation Table Technology for Product Type, 2020–2030 (US$ Million)
10.1.6.6.4 Thailand: Operating Table and Light Market, by Application, 2020–2030 (US$ Million)
10.1.6.6.5 Thailand: Operating Table and Light Market, by End User, 2020–2030 (US$ Million)
10.1.6.7 Vietnam
10.1.6.7.1 Overview
10.1.6.7.2 Vietnam Operating Table and Light Market Revenue and Forecast to 2030 (US$ Mn)
10.1.6.7.3 Vietnam: Operating Table and Light Market, by Product Type, 2020–2030 (US$ Million)
10.1.6.7.3.1 Vietnam: Operating Table and Light Market, Operation Table by Product Type, 2020–2030 (US$ Million)
10.1.6.7.3.2 Vietnam: Operating Table and Light Market, Light by Product Type, 2020–2030 (US$ Million)
10.1.6.7.3.3 Vietnam: Operating Table and Light Market, by Operation Table Technology for Product Type, 2020–2030 (US$ Million)
10.1.6.7.4 Vietnam: Operating Table and Light Market, by Application, 2020–2030 (US$ Million)
10.1.6.7.5 Vietnam: Operating Table and Light Market, by End User, 2020–2030 (US$ Million)
10.1.6.8 Malaysia
10.1.6.8.1 Overview
10.1.6.8.2 Malaysia Operating Table and Light Market Revenue and Forecast to 2030 (US$ Mn)
10.1.6.8.3 Malaysia: Operating Table and Light Market, by Product Type, 2020–2030 (US$ Million)
10.1.6.8.3.1 Malaysia: Operating Table and Light Market, Operation Table by Product Type, 2020–2030 (US$ Million)
10.1.6.8.3.2 Malaysia: Operating Table and Light Market, Light by Product Type, 2020–2030 (US$ Million)
10.1.6.8.3.3 Malaysia: Operating Table and Light Market, by Operation Table Technology for Product Type, 2020–2030 (US$ Million)
10.1.6.8.4 Malaysia: Operating Table and Light Market, by Application, 2020–2030 (US$ Million)
10.1.6.8.5 Malaysia: Operating Table and Light Market, by End User, 2020–2030 (US$ Million)
10.1.6.9 Indonesia
10.1.6.9.1 Overview
10.1.6.9.2 Indonesia Operating Table and Light Market Revenue and Forecast to 2030 (US$ Mn)
10.1.6.9.3 Indonesia: Operating Table and Light Market, by Product Type, 2020–2030 (US$ Million)
10.1.6.9.3.1 Indonesia: Operating Table and Light Market, Operation Table by Product Type, 2020–2030 (US$ Million)
10.1.6.9.3.2 Indonesia: Operating Table and Light Market, Light by Product Type, 2020–2030 (US$ Million)
10.1.6.9.3.3 Indonesia: Operating Table and Light Market, by Operation Table Technology for Product Type, 2020–2030 (US$ Million)
10.1.6.9.4 Indonesia: Operating Table and Light Market, by Application, 2020–2030 (US$ Million)
10.1.6.9.5 Indonesia: Operating Table and Light Market, by End User, 2020–2030 (US$ Million)
10.1.6.10 Philippines
10.1.6.10.1 Overview
10.1.6.10.2 Philippines Operating Table and Light Market Revenue and Forecast to 2030 (US$ Mn)
10.1.6.10.3 Philippines: Operating Table and Light Market, by Product Type, 2020–2030 (US$ Million)
10.1.6.10.3.1 Philippines: Operating Table and Light Market, Operation Table by Product Type, 2020–2030 (US$ Million)
10.1.6.10.3.2 Philippines: Operating Table and Light Market, Light by Product Type, 2020–2030 (US$ Million)
10.1.6.10.3.3 Philippines: Operating Table and Light Market, by Operation Table Technology for Product Type, 2020–2030 (US$ Million)
10.1.6.10.4 Philippines: Operating Table and Light Market, by Application, 2020–2030 (US$ Million)
10.1.6.10.5 Philippines: Operating Table and Light Market, by End User, 2020–2030 (US$ Million)
10.1.6.11 Rest of Asia Pacific
10.1.6.11.1 Overview
10.1.6.11.2 Rest of Asia Pacific Operating Table and Light Market Revenue and Forecast to 2030 (US$ Mn)
10.1.6.11.3 Rest of Asia Pacific: Operating Table and Light Market, by Product Type, 2020–2030 (US$ Million)
10.1.6.11.3.1 Rest of Asia Pacific: Operating Table and Light Market, Operation Table by Product Type, 2020–2030 (US$ Million)
10.1.6.11.3.2 Rest of Asia Pacific: Operating Table and Light Market, Light by Product Type, 2020–2030 (US$ Million)
10.1.6.11.3.3 Rest of Asia Pacific: Operating Table and Light Market, by Operation Table Technology for Product Type, 2020–2030 (US$ Million)
10.1.6.11.4 Rest of Asia Pacific: Operating Table and Light Market, by Application, 2020–2030 (US$ Million)
10.1.6.11.5 Rest of Asia Pacific: Operating Table and Light Market, by End User, 2020–2030 (US$ Million)
10.2 Middle East & Africa Operating Table and Light Market, Revenue and Forecast to 2030
10.2.1 Overview
10.2.2 Middle East & Africa Operating Table and Light Market Revenue and Forecast to 2030 (US$ Mn)
10.2.3 Middle East & Africa: Operating Table and Light Market, by Product Type, 2020–2030 (US$ Million)
10.2.3.1 Middle East & Africa: Operating Table and Light Market, Operation Table by Product Type, 2020–2030 (US$ Million)
10.2.3.2 Middle East & Africa: Operating Table and Light Market, Light by Product Type, 2020–2030 (US$ Million)
10.2.3.3 Middle East & Africa: Operating Table and Light Market, by Operation Table Technology for Product Type, 2020–2030 (US$ Million)
10.2.4 Middle East & Africa: Operating Table and Light Market, by Application, 2020–2030 (US$ Million)
10.2.5 Middle East & Africa: Operating Table and Light Market, by End User, 2020–2030 (US$ Million)
10.2.6 Middle East & Africa Operating Table and Light Market, by Country
10.2.6.1 UAE
10.2.6.1.1 Overview
10.2.6.1.2 UAE Operating Table and Light Market Revenue and Forecast to 2030 (US$ Mn)
10.2.6.1.3 UAE: Operating Table and Light Market, by Type, 2020–2030 (US$ Million)
10.2.6.1.3.1 UAE: Operating Table and Light Market, Operation Table by Product Type, 2020–2030 (US$ Million)
10.2.6.1.3.2 UAE: Operating Table and Light Market, Light by Product Type, 2020–2030 (US$ Million)
10.2.6.1.3.3 UAE: Operating Table and Light Market, by Operation Table Technology for Product Type, 2020–2030 (US$ Million)
10.2.6.1.4 UAE: Operating Table and Light Market, by Application, 2020–2030 (US$ Million)
10.2.6.1.5 UAE: Operating Table and Light Market, by End User, 2020–2030 (US$ Million)
10.2.6.2 Saudi Arabia
10.2.6.2.1 Overview
10.2.6.2.2 Saudi Arabia Operating Table and Light Market Revenue and Forecast to 2030 (US$ Mn)
10.2.6.2.3 Saudi Arabia: Operating Table and Light Market, by Product Type, 2020–2030 (US$ Million)
10.2.6.2.3.1 Saudi Arabia: Operating Table and Light Market, Operation Table by Product Type, 2020–2030 (US$ Million)
10.2.6.2.3.2 Saudi Arabia: Operating Table and Light Market, Light by Product Type, 2020–2030 (US$ Million)
10.2.6.2.3.3 Saudi Arabia: Operating Table and Light Market, by Operation Table Technology for Product Type, 2020–2030 (US$ Million)
10.2.6.2.4 Saudi Arabia: Operating Table and Light Market, by Application, 2020–2030 (US$ Million)
10.2.6.2.5 Saudi Arabia: Operating Table and Light Market, by End User, 2020–2030 (US$ Million)
10.2.6.3 South Africa
10.2.6.3.1 Overview
10.2.6.3.2 South Africa Operating Table and Light Market Revenue and Forecast to 2030 (US$ Mn)
10.2.6.3.3 South Africa: Operating Table and Light Market, by Product Type, 2020–2030 (US$ Million)
10.2.6.3.3.1 South Africa: Operating Table and Light Market, Operation Table by Product Type, 2020–2030 (US$ Million)
10.2.6.3.3.2 South Africa: Operating Table and Light Market, Light by Product Type, 2020–2030 (US$ Million)
10.2.6.3.3.3 South Africa: Operating Table and Light Market, by Operation Table Technology for Product Type, 2020–2030 (US$ Million)
10.2.6.3.4 South Africa: Operating Table and Light Market, by Application, 2020–2030 (US$ Million)
10.2.6.3.5 South Africa: Operating Table and Light Market, by End User, 2020–2030 (US$ Million)
10.2.6.4 Turkey
10.2.6.4.1 Overview
10.2.6.4.2 Turkey Operating Table and Light Market Revenue and Forecast to 2030 (US$ Mn)
10.2.6.4.3 Turkey: Operating Table and Light Market, by Product Type, 2020–2030 (US$ Million)
10.2.6.4.3.1 Turkey: Operating Table and Light Market, Operation Table by Product Type, 2020–2030 (US$ Million)
10.2.6.4.3.2 Turkey: Operating Table and Light Market, Light by Product Type, 2020–2030 (US$ Million)
10.2.6.4.3.3 Turkey: Operating Table and Light Market, by Operation Table Technology for Product Type, 2020–2030 (US$ Million)
10.2.6.4.4 Turkey: Operating Table and Light Market, by Application, 2020–2030 (US$ Million)
10.2.6.4.5 Turkey: Operating Table and Light Market, by End User, 2020–2030 (US$ Million)
10.2.6.5 Egypt
10.2.6.5.1 Overview
10.2.6.5.2 Egypt Operating Table and Light Market Revenue and Forecast to 2030 (US$ Mn)
10.2.6.5.3 Egypt: Operating Table and Light Market, by Product Type, 2020–2030 (US$ Million)
10.2.6.5.3.1 Egypt: Operating Table and Light Market, Operation Table by Product Type, 2020–2030 (US$ Million)
10.2.6.5.3.2 Egypt: Operating Table and Light Market, Light by Product Type, 2020–2030 (US$ Million)
10.2.6.5.3.3 Egypt: Operating Table and Light Market, by Operation Table Technology for Product Type, 2020–2030 (US$ Million)
10.2.6.5.4 Egypt: Operating Table and Light Market, by Application, 2020–2030 (US$ Million)
10.2.6.5.5 Egypt: Operating Table and Light Market, by End User, 2020–2030 (US$ Million)
10.2.6.6 Africa
10.2.6.6.1 Overview
10.2.6.6.2 Africa Operating Table and Light Market Revenue and Forecast to 2030 (US$ Mn)
10.2.6.6.3 Africa: Operating Table and Light Market, by Product Type, 2020–2030 (US$ Million)
10.2.6.6.3.1 Africa: Operating Table and Light Market, Operation Table by Product Type, 2020–2030 (US$ Million)
10.2.6.6.3.2 Africa: Operating Table and Light Market, Light by Product Type, 2020–2030 (US$ Million)
10.2.6.6.3.3 Africa: Operating Table and Light Market, by Operation Table Technology for Product Type, 2020–2030 (US$ Million)
10.2.6.6.4 Africa: Operating Table and Light Market, by Application, 2020–2030 (US$ Million)
10.2.6.6.5 Africa: Operating Table and Light Market, by End User, 2020–2030 (US$ Million)
10.2.6.7 Kuwait
10.2.6.7.1 Overview
10.2.6.7.2 Kuwait Operating Table and Light Market Revenue and Forecast to 2030 (US$ Mn)
10.2.6.7.3 Kuwait: Operating Table and Light Market, by Product Type, 2020–2030 (US$ Million)
10.2.6.7.3.1 Kuwait: Operating Table and Light Market, Operation Table by Product Type, 2020–2030 (US$ Million)
10.2.6.7.3.2 Kuwait: Operating Table and Light Market, Light by Product Type, 2020–2030 (US$ Million)
10.2.6.7.3.3 Kuwait: Operating Table and Light Market, by Operation Table Technology for Product Type, 2020–2030 (US$ Million)
10.2.6.7.4 Kuwait: Operating Table and Light Market, by Application, 2020–2030 (US$ Million)
10.2.6.7.5 Kuwait: Operating Table and Light Market, by End User, 2020–2030 (US$ Million)
10.2.6.8 Iraq
10.2.6.8.1 Overview
10.2.6.8.2 Iraq Operating Table and Light Market Revenue and Forecast to 2030 (US$ Mn)
10.2.6.8.3 Iraq: Operating Table and Light Market, by Product Type, 2020–2030 (US$ Million)
10.2.6.8.3.1 Iraq: Operating Table and Light Market, Operation Table by Product Type, 2020–2030 (US$ Million)
10.2.6.8.3.2 Iraq: Operating Table and Light Market, Light by Product Type, 2020–2030 (US$ Million)
10.2.6.8.3.3 Iraq: Operating Table and Light Market, by Operation Table Technology for Product Type, 2020–2030 (US$ Million)
10.2.6.8.4 Iraq: Operating Table and Light Market, by Application, 2020–2030 (US$ Million)
10.2.6.8.5 Iraq: Operating Table and Light Market, by End User, 2020–2030 (US$ Million)
10.2.6.9 Syria
10.2.6.9.1 Overview
10.2.6.9.2 Iraq Operating Table and Light Market Revenue and Forecast to 2030 (US$ Mn)
10.2.6.9.3 Syria: Operating Table and Light Market, by Product Type, 2020–2030 (US$ Million)
10.2.6.9.3.1 Syria: Operating Table and Light Market, Operation Table by Product Type, 2020–2030 (US$ Million)
10.2.6.9.3.2 Syria: Operating Table and Light Market, Light by Product Type, 2020–2030 (US$ Million)
10.2.6.9.3.3 Syria: Operating Table and Light Market, by Operation Table Technology for Product Type, 2020–2030 (US$ Million)
10.2.6.9.4 Syria: Operating Table and Light Market, by Application, 2020–2030 (US$ Million)
10.2.6.9.5 Syria: Operating Table and Light Market, by End User, 2020–2030 (US$ Million)
10.2.6.10 Rest of Middle East & Africa
10.2.6.10.1 Overview
10.2.6.10.2 Rest of Middle East & Africa Operating Table and Light Market Revenue and Forecast to 2030 (US$ Mn)
10.2.6.10.3 Rest of Middle East & Africa: Operating Table and Light Market, by Product Type, 2020–2030 (US$ Million)
10.2.6.10.3.1 Rest of Middle East & Africa: Operating Table and Light Market, Operation Table by Product Type, 2020–2030 (US$ Million)
10.2.6.10.3.2 Rest of Middle East & Africa: Operating Table and Light Market, Light by Product Type, 2020–2030 (US$ Million)
10.2.6.10.3.3 Rest of Middle East & Africa: Operating Table and Light Market, by Operation Table Technology for Product Type, 2020–2030 (US$ Million)
10.2.6.10.4 Rest of Middle East & Africa: Operating Table and Light Market, by Application, 2020–2030 (US$ Million)
10.2.6.10.5 Rest of Middle East & Africa: Operating Table and Light Market, by End User, 2020–2030 (US$ Million)
10.3 South & Central America Operating Table and Light Market, Revenue and Forecast to 2030
10.3.1 Overview
10.3.2 South & Central America Operating Table and Light Market Revenue and Forecast to 2030 (US$ Mn)
10.3.3 South & Central America: Operating Table and Light Market, by Product Type, 2020–2030 (US$ Million)
10.3.3.1 South & Central America: Operating Table and Light Market, Operation Table by Product Type, 2020–2030 (US$ Million)
10.3.3.2 South & Central America: Operating Table and Light Market, Light by Product Type, 2020–2030 (US$ Million)
10.3.3.3 South & Central America: Operating Table and Light Market, by Operation Table Technology for Product Type, 2020–2030 (US$ Million)
10.3.4 South & Central America: Operating Table and Light Market, by Application, 2020–2030 (US$ Million)
10.3.5 South & Central America: Operating Table and Light Market, by End User, 2020–2030 (US$ Million)
10.3.6 South & Central America Operating Table and Light Market, by Country
10.3.6.1 Brazil
10.3.6.1.1 Overview
10.3.6.1.2 Brazil Operating Table and Light Market Revenue and Forecast to 2030 (US$ Mn)
10.3.6.1.3 Brazil: Operating Table and Light Market, by Product Type, 2020–2030 (US$ Million)
10.3.6.1.3.1 Brazil: Operating Table and Light Market, Operation Table by Product Type, 2020–2030 (US$ Million)
10.3.6.1.3.2 Brazil: Operating Table and Light Market, Light by Product Type, 2020–2030 (US$ Million)
10.3.6.1.3.3 Brazil: Operating Table and Light Market, by Operation Table Technology for Product Type, 2020–2030 (US$ Million)
10.3.6.1.4 Brazil: Operating Table and Light Market, by Application, 2020–2030 (US$ Million)
10.3.6.1.5 Brazil: Operating Table and Light Market, by End User, 2020–2030 (US$ Million)
10.3.6.2 Mexico
10.3.6.2.1 Overview
10.3.6.2.2 Mexico Operating Table and Light Market Revenue and Forecast to 2030 (US$ Mn)
10.3.6.2.3 Mexico: Operating Table and Light Market, by Product Type, 2020–2030 (US$ Million)
10.3.6.2.3.1 Mexico: Operating Table and Light Market, Operation Table by Product Type, 2020–2030 (US$ Million)
10.3.6.2.3.2 Mexico: Operating Table and Light Market, Light by Product Type, 2020–2030 (US$ Million)
10.3.6.2.3.3 Mexico: Operating Table and Light Market, by Operation Table Technology for Product Type, 2020–2030 (US$ Million)
10.3.6.2.4 Mexico: Operating Table and Light Market, by Application, 2020–2030 (US$ Million)
10.3.6.2.5 Mexico: Operating Table and Light Market, by End User, 2020–2030 (US$ Million)
10.3.6.3 Argentina
10.3.6.3.1 Overview
10.3.6.3.2 Argentina Operating Table and Light Market Revenue and Forecast to 2030 (US$ Mn)
10.3.6.3.3 Argentina: Operating Table and Light Market, by Product Type, 2020–2030 (US$ Million)
10.3.6.3.3.1 Argentina: Operating Table and Light Market, Operation Table by Product Type, 2020–2030 (US$ Million)
10.3.6.3.3.2 Argentina: Operating Table and Light Market, Light by Product Type, 2020–2030 (US$ Million)
10.3.6.3.3.3 Argentina: Operating Table and Light Market, by Operation Table Technology for Product Type, 2020–2030 (US$ Million)
10.3.6.3.4 Argentina: Operating Table and Light Market, by Application, 2020–2030 (US$ Million)
10.3.6.3.5 Argentina: Operating Table and Light Market, by End User, 2020–2030 (US$ Million)
10.3.6.4 Chile
10.3.6.4.1 Overview
10.3.6.4.2 Chile Operating Table and Light Market Revenue and Forecast to 2030 (US$ Mn)
10.3.6.4.3 Chile: Operating Table and Light Market, by Product Type, 2020–2030 (US$ Million)
10.3.6.4.3.1 Chile: Operating Table and Light Market, Operation Table by Product Type, 2020–2030 (US$ Million)
10.3.6.4.3.2 Chile: Operating Table and Light Market, Light by Product Type, 2020–2030 (US$ Million)
10.3.6.4.3.3 Chile: Operating Table and Light Market, by Operation Table Technology for Product Type, 2020–2030 (US$ Million)
10.3.6.4.4 Chile: Operating Table and Light Market, by Application, 2020–2030 (US$ Million)
10.3.6.4.5 Chile: Operating Table and Light Market, by End User, 2020–2030 (US$ Million)
10.3.6.5 Peru
10.3.6.5.1 Overview
10.3.6.5.2 Peru Operating Table and Light Market Revenue and Forecast to 2030 (US$ Mn)
10.3.6.5.3 Peru: Operating Table and Light Market, by Product Type, 2020–2030 (US$ Million)
10.3.6.5.3.1 Peru: Operating Table and Light Market, Operation Table by Product Type, 2020–2030 (US$ Million)
10.3.6.5.3.2 Peru: Operating Table and Light Market, Light by Product Type, 2020–2030 (US$ Million)
10.3.6.5.3.3 Peru: Operating Table and Light Market, by Operation Table Technology for Product Type, 2020–2030 (US$ Million)
10.3.6.5.4 Peru: Operating Table and Light Market, by Application, 2020–2030 (US$ Million)
10.3.6.5.5 Peru: Operating Table and Light Market, by End User, 2020–2030 (US$ Million)
10.3.6.6 Colombia
10.3.6.6.1 Overview
10.3.6.6.2 Colombia Operating Table and Light Market Revenue and Forecast to 2030 (US$ Mn)
10.3.6.6.3 Colombia: Operating Table and Light Market, by Product Type, 2020–2030 (US$ Million)
10.3.6.6.3.1 Colombia: Operating Table and Light Market, Operation Table by Product Type, 2020–2030 (US$ Million)
10.3.6.6.3.2 Colombia: Operating Table and Light Market, Light by Product Type, 2020–2030 (US$ Million)
10.3.6.6.3.3 Colombia: Operating Table and Light Market, by Operation Table Technology for Product Type, 2020–2030 (US$ Million)
10.3.6.6.4 Colombia: Operating Table and Light Market, by Application, 2020–2030 (US$ Million)
10.3.6.6.5 Colombia: Operating Table and Light Market, by End User, 2020–2030 (US$ Million)
10.3.6.7 Costa Rica
10.3.6.7.1 Overview
10.3.6.7.2 Costa Rica Operating Table and Light Market Revenue and Forecast to 2030 (US$ Mn)
10.3.6.7.3 Costa Rica: Operating Table and Light Market, by Product Type, 2020–2030 (US$ Million)
10.3.6.7.3.1 Costa Rica: Operating Table and Light Market, Operation Table by Product Type, 2020–2030 (US$ Million)
10.3.6.7.3.2 Costa Rica: Operating Table and Light Market, Light by Product Type, 2020–2030 (US$ Million)
10.3.6.7.3.3 Costa Rica: Operating Table and Light Market, by Operation Table Technology for Product Type, 2020–2030 (US$ Million)
10.3.6.7.4 Costa Rica: Operating Table and Light Market, by Application, 2020–2030 (US$ Million)
10.3.6.7.5 Costa Rica: Operating Table and Light Market, by End User, 2020–2030 (US$ Million)
10.3.6.8 Ecuador
10.3.6.8.1 Overview
10.3.6.8.2 Ecuador Operating Table and Light Market Revenue and Forecast to 2030 (US$ Mn)
10.3.6.8.3 Ecuador: Operating Table and Light Market, by Product Type, 2020–2030 (US$ Million)
10.3.6.8.3.1 Ecuador: Operating Table and Light Market, Operation Table by Product Type, 2020–2030 (US$ Million)
10.3.6.8.3.2 Ecuador: Operating Table and Light Market, Light by Product Type, 2020–2030 (US$ Million)
10.3.6.8.3.3 Ecuador: Operating Table and Light Market, by Operation Table Technology for Product Type, 2020–2030 (US$ Million)
10.3.6.8.4 Ecuador: Operating Table and Light Market, by Application, 2020–2030 (US$ Million)
10.3.6.8.5 Ecuador: Operating Table and Light Market, by End User, 2020–2030 (US$ Million)
10.3.6.9 Venezuela
10.3.6.9.1 Overview
10.3.6.9.2 Venezuela Operating Table and Light Market Revenue and Forecast to 2030 (US$ Mn)
10.3.6.9.3 Venezuela: Operating Table and Light Market, by Product Type, 2020–2030 (US$ Million)
10.3.6.9.3.1 Venezuela: Operating Table and Light Market, Operation Table by Product Type, 2020–2030 (US$ Million)
10.3.6.9.3.2 Venezuela: Operating Table and Light Market, Light by Product Type, 2020–2030 (US$ Million)
10.3.6.9.3.3 Venezuela: Operating Table and Light Market, by Operation Table Technology for Product Type, 2020–2030 (US$ Million)
10.3.6.9.4 Venezuela: Operating Table and Light Market, by Application, 2020–2030 (US$ Million)
10.3.6.9.5 Venezuela: Operating Table and Light Market, by End User, 2020–2030 (US$ Million)
10.3.6.10 Rest of South & Central America
10.3.6.10.1 Overview
10.3.6.10.2 Rest of South & Central America Operating Table and Light Market Revenue and Forecast to 2030 (US$ Mn)
10.3.6.10.3 Rest of South & Central America: Operating Table and Light Market, by Product Type, 2020–2030 (US$ Million)
10.3.6.10.3.1 Rest of South & Central America: Operating Table and Light Market, Operation Table by Product Type, 2020–2030 (US$ Million)
10.3.6.10.3.2 Rest of South & Central America: Operating Table and Light Market, Light by Product Type, 2020–2030 (US$ Million)
10.3.6.10.3.3 Rest of South & Central America: Operating Table and Light Market, by Operation Table Technology for Product Type, 2020–2030 (US$ Million)
10.3.6.10.4 Rest of South & Central America: Operating Table and Light Market, by Application, 2020–2030 (US$ Million)
10.3.6.10.5 Rest of South & Central America: Operating Table and Light Market, by End User, 2020–2030 (US$ Million)
11. Operating Table and Light Market Industry Landscape
11.1 Overview
11.1.1 Recent Developments
12. Company Profiles
12.1 SKYTRON LLC
12.1.1 Key Facts
12.1.2 Business Description
12.1.3 Products and Services
12.1.4 Financial Overview
12.1.5 SWOT Analysis
12.1.6 Key Developments
12.2 Steris Plc
12.2.1 Key Facts
12.2.2 Business Description
12.2.3 Products and Services
12.2.4 Financial Overview
12.2.5 SWOT Analysis
12.2.6 Key Developments
12.3 ALVO Medical Sp zoo
12.3.1 Key Facts
12.3.2 Business Description
12.3.3 Products and Services
12.3.4 Financial Overview
12.3.5 SWOT Analysis
12.3.6 Key Developments
12.4 Denyers Pty Ltd
12.4.1 Key Facts
12.4.2 Business Description
12.4.3 Products and Services
12.4.4 Financial Overview
12.4.5 SWOT Analysis
12.4.6 Key Developments
12.5 Getinge AB
12.5.1 Key Facts
12.5.2 Business Description
12.5.3 Products and Services
12.5.4 Financial Overview
12.5.5 SWOT Analysis
12.5.6 Key Developments
12.6 Mizuho Medical Co Ltd
12.6.1 Key Facts
12.6.2 Business Description
12.6.3 Products and Services
12.6.4 Financial Overview
12.6.5 SWOT Analysis
12.6.6 Key Developments
12.7 Merivaara Corp
12.7.1 Key Facts
12.7.2 Business Description
12.7.3 Products and Services
12.7.4 Financial Overview
12.7.5 SWOT Analysis
12.7.6 Key Developments
12.8 Stryker Corp
12.8.1 Key Facts
12.8.2 Business Description
12.8.3 Products and Services
12.8.4 Financial Overview
12.8.5 SWOT Analysis
12.8.6 Key Developments
12.9 Hill-Rom Holdings Inc
12.9.1 Key Facts
12.9.2 Business Description
12.9.3 Products and Services
12.9.4 Financial Overview
12.9.5 SWOT Analysis
12.9.6 Key Developments
12.10 Mediland Enterprise Corp
12.10.1 Key Facts
12.10.2 Business Description
12.10.3 Products and Services
12.10.4 Financial Overview
12.10.5 SWOT Analysis
12.10.6 Key Developments
12.11 Infinium Medical
12.11.1 Key Facts
12.11.2 Business Description
12.11.3 Products and Services
12.11.4 Financial Overview
12.11.5 SWOT Analysis
12.11.6 Key Developments
12.12 Schaerer Medical AG
12.12.1 Key Facts
12.12.2 Business Description
12.12.3 Products and Services
12.12.4 Financial Overview
12.12.5 SWOT Analysis
12.12.6 Key Developments
12.13 Takara Belmont Corp
12.13.1 Key Facts
12.13.2 Business Description
12.13.3 Products and Services
12.13.4 Financial Overview
12.13.5 SWOT Analysis
12.13.6 Key Developments
13. Appendix
13.1 About Us
13.2 Glossary of Terms
List of Tables
Table 1. Operating Table and Light Market Segmentation
Table 2. Operating Table and Light Market, by Operating Table – Revenue and Forecast to 2030 (US$ Million)
Table 3. Operating Table and Light Market, by Operating Table Technology – Revenue and Forecast to 2030 (US$ Million)
Table 4. Operating Table and Light Market, by Lights – Revenue and Forecast to 2030 (US$ Million)
Table 5. Asia Pacific Operating Table and Light Market, by Product Type – Revenue and Forecast to 2030 (US$ Million)
Table 6. Asia Pacific Operating Table and Light Market, Operation Table by Product Type – Revenue and Forecast to 2030 (US$ Million)
Table 7. Asia Pacific Operating Table and Light Market, Light by Product Type – Revenue and Forecast to 2030 (US$ Million)
Table 8. Asia Pacific Operating Table and Light Market, by Operation Table Technology for Product Type – Revenue and Forecast to 2030 (US$ Million)
Table 9. Asia Pacific Operating Table and Light Market, by Application – Revenue and Forecast to 2030 (US$ Million)
Table 10. Asia Pacific Operating Table and Light Market, by End User – Revenue and Forecast to 2030 (US$ Million)
Table 11. China Operating Table and Light Market, by Product Type – Revenue and Forecast to 2030 (US$ Million)
Table 12. China Operating Table and Light Market, Operation Table by Product Type – Revenue and Forecast to 2030 (US$ Million)
Table 13. China Operating Table and Light Market, Light by Product Type – Revenue and Forecast to 2030 (US$ Million)
Table 14. China Operating Table and Light Market, by Operation Table Technology for Product Type – Revenue and Forecast to 2030 (US$ Million)
Table 15. China Operating Table and Light Market, by Application – Revenue and Forecast to 2030 (US$ Million)
Table 16. China Operating Table and Light Market, by End User – Revenue and Forecast to 2030 (US$ Million)
Table 17. India Operating Table and Light Market, by Product Type – Revenue and Forecast to 2030 (US$ Million)
Table 18. India Operating Table and Light Market, Operation Table by Product Type – Revenue and Forecast to 2030 (US$ Million)
Table 19. India Operating Table and Light Market, Light by Product Type – Revenue and Forecast to 2030 (US$ Million)
Table 20. India Operating Table and Light Market, by Operation Table Technology for Product Type – Revenue and Forecast to 2030 (US$ Million)
Table 21. India Operating Table and Light Market, by Application – Revenue and Forecast to 2030 (US$ Million)
Table 22. India Operating Table and Light Market, by End User – Revenue and Forecast to 2030 (US$ Million)
Table 23. Australia Operating Table and Light Market, by Product Type – Revenue and Forecast to 2030 (US$ Million)
Table 24. Australia Operating Table and Light Market, Operation Table by Product Type – Revenue and Forecast to 2030 (US$ Million)
Table 25. Australia Operating Table and Light Market, Light by Product Type – Revenue and Forecast to 2030 (US$ Million)
Table 26. Australia Operating Table and Light Market, by Operation Table Technology for Product Type – Revenue and Forecast to 2030 (US$ Million)
Table 27. Australia Operating Table and Light Market, by Application – Revenue and Forecast to 2030 (US$ Million)
Table 28. Australia Operating Table and Light Market, by End User – Revenue and Forecast to 2030 (US$ Million)
Table 29. South Korea Operating Table and Light Market, by Product Type – Revenue and Forecast to 2030 (US$ Million)
Table 30. South Korea Operating Table and Light Market, Operation Table by Product Type – Revenue and Forecast to 2030 (US$ Million)
Table 31. South Korea Operating Table and Light Market, Light by Product Type – Revenue and Forecast to 2030 (US$ Million)
Table 32. South Korea Operating Table and Light Market, by Operation Table Technology for Product Type – Revenue and Forecast to 2030 (US$ Million)
Table 33. South Korea Operating Table and Light Market, by Application – Revenue and Forecast to 2030 (US$ Million)
Table 34. South Korea Operating Table and Light Market, by End User – Revenue and Forecast to 2030 (US$ Million)
Table 35. Nepal Operating Table and Light Market, by Product Type – Revenue and Forecast to 2030 (US$ Million)
Table 36. Nepal Operating Table and Light Market, Operation Table by Product Type – Revenue and Forecast to 2030 (US$ Million)
Table 37. Nepal Operating Table and Light Market, Light by Product Type – Revenue and Forecast to 2030 (US$ Million)
Table 38. Nepal Operating Table and Light Market, by Operation Table Technology for Product Type – Revenue and Forecast to 2030 (US$ Million)
Table 39. Nepal Operating Table and Light Market, by Application – Revenue and Forecast to 2030 (US$ Million)
Table 40. Nepal Operating Table and Light Market, by End User – Revenue and Forecast to 2030 (US$ Million)
Table 41. Thailand Operating Table and Light Market, by Product Type – Revenue and Forecast to 2030 (US$ Million)
Table 42. Thailand Operating Table and Light Market, Operation Table by Product Type – Revenue and Forecast to 2030 (US$ Million)
Table 43. Thailand Operating Table and Light Market, Light by Product Type – Revenue and Forecast to 2030 (US$ Million)
Table 44. Thailand Operating Table and Light Market, by Operation Table Technology for Product Type – Revenue and Forecast to 2030 (US$ Million)
Table 45. Thailand Operating Table and Light Market, by Application – Revenue and Forecast to 2030 (US$ Million)
Table 46. Thailand Operating Table and Light Market, by End User – Revenue and Forecast to 2030 (US$ Million)
Table 47. Vietnam Operating Table and Light Market, by Product Type – Revenue and Forecast to 2030 (US$ Million)
Table 48. Vietnam Operating Table and Light Market, Operation Table by Product Type – Revenue and Forecast to 2030 (US$ Million)
Table 49. Vietnam Operating Table and Light Market, Light by Product Type – Revenue and Forecast to 2030 (US$ Million)
Table 50. Vietnam Operating Table and Light Market, by Operation Table Technology for Product Type – Revenue and Forecast to 2030 (US$ Million)
Table 51. Vietnam Operating Table and Light Market, by Application – Revenue and Forecast to 2030 (US$ Million)
Table 52. Vietnam Operating Table and Light Market, by End User – Revenue and Forecast to 2030 (US$ Million)
Table 53. Malaysia Operating Table and Light Market, by Product Type – Revenue and Forecast to 2030 (US$ Million)
Table 54. Malaysia Operating Table and Light Market, Operation Table by Product Type – Revenue and Forecast to 2030 (US$ Million)
Table 55. Malaysia Operating Table and Light Market, Light by Product Type – Revenue and Forecast to 2030 (US$ Million)
Table 56. Malaysia Operating Table and Light Market, by Operation Table Technology for Product Type – Revenue and Forecast to 2030 (US$ Million)
Table 57. Malaysia Operating Table and Light Market, by Application – Revenue and Forecast to 2030 (US$ Million)
Table 58. Malaysia Operating Table and Light Market, by End User – Revenue and Forecast to 2030 (US$ Million)
Table 59. Indonesia Operating Table and Light Market, by Product Type – Revenue and Forecast to 2030 (US$ Million)
Table 60. Indonesia Operating Table and Light Market, Operation Table by Product Type – Revenue and Forecast to 2030 (US$ Million)
Table 61. Indonesia Operating Table and Light Market, Light by Product Type – Revenue and Forecast to 2030 (US$ Million)
Table 62. Indonesia Operating Table and Light Market, by Operation Table Technology for Product Type – Revenue and Forecast to 2030 (US$ Million)
Table 63. Indonesia Operating Table and Light Market, by Application – Revenue and Forecast to 2030 (US$ Million)
Table 64. Indonesia Operating Table and Light Market, by End User – Revenue and Forecast to 2030 (US$ Million)
Table 65. Philippines Operating Table and Light Market, by Product Type – Revenue and Forecast to 2030 (US$ Million)
Table 66. Philippines Operating Table and Light Market, Operation Table by Product Type – Revenue and Forecast to 2030 (US$ Million)
Table 67. Philippines Operating Table and Light Market, Light by Product Type – Revenue and Forecast to 2030 (US$ Million)
Table 68. Philippines Operating Table and Light Market, by Operation Table Technology for Product Type – Revenue and Forecast to 2030 (US$ Million)
Table 69. Philippines Operating Table and Light Market, by Application – Revenue and Forecast to 2030 (US$ Million)
Table 70. Philippines Operating Table and Light Market, by End User – Revenue and Forecast to 2030 (US$ Million)
Table 71. Rest of Asia Pacific Operating Table and Light Market, by Product Type – Revenue and Forecast to 2030 (US$ Million)
Table 72. Rest of Asia Pacific Operating Table and Light Market, Operation Table by Product Type – Revenue and Forecast to 2030 (US$ Million)
Table 73. Rest of Asia Pacific Operating Table and Light Market, Light by Product Type – Revenue and Forecast to 2030 (US$ Million)
Table 74. Rest of Asia Pacific Operating Table and Light Market, by Operation Table Technology for Product Type – Revenue and Forecast to 2030 (US$ Million)
Table 75. Rest of Asia Pacific Operating Table and Light Market, by Application – Revenue and Forecast to 2030 (US$ Million)
Table 76. Rest of Asia Pacific Operating Table and Light Market, by End User – Revenue and Forecast to 2030 (US$ Million)
Table 77. Middle East & Africa Operating Table and Light Market, by Product Type – Revenue and Forecast to 2030 (US$ Million)
Table 78. Middle East & Africa Operating Table and Light Market, Operation Table by Product Type – Revenue and Forecast to 2030 (US$ Million)
Table 79. Middle East & Africa Operating Table and Light Market, Light by Product Type – Revenue and Forecast to 2030 (US$ Million)
Table 80. Middle East & Africa Operating Table and Light Market, by Operation Table Technology for Product Type – Revenue and Forecast to 2030 (US$ Million)
Table 81. Middle East & Africa Operating Table and Light Market, by Application – Revenue and Forecast to 2030 (US$ Million)
Table 82. Middle East & Africa Operating Table and Light Market, by End User – Revenue and Forecast to 2030 (US$ Million)
Table 83. UAE Operating Table and Light Market, by Type – Revenue and Forecast to 2030 (US$ Million)
Table 84. UAE Operating Table and Light Market, Operation Table by Product Type – Revenue and Forecast to 2030 (US$ Million)
Table 85. UAE Operating Table and Light Market, Light by Product Type – Revenue and Forecast to 2030 (US$ Million)
Table 86. UAE Operating Table and Light Market, by Operation Table Technology for Product Type – Revenue and Forecast to 2030 (US$ Million)
Table 87. UAE Operating Table and Light Market, by Application – Revenue and Forecast to 2030 (US$ Million)
Table 88. UAE Operating Table and Light Market, by End User – Revenue and Forecast to 2030 (US$ Million)
Table 89. Saudi Arabia Operating Table and Light Market, by Product Type – Revenue and Forecast to 2030 (US$ Million)
Table 90. Saudi Arabia Operating Table and Light Market, Operation Table by Product Type – Revenue and Forecast to 2030 (US$ Million)
Table 91. Saudi Arabia Operating Table and Light Market, Light by Product Type – Revenue and Forecast to 2030 (US$ Million)
Table 92. Saudi Arabia Operating Table and Light Market, by Operation Table Technology for Product Type – Revenue and Forecast to 2030 (US$ Million)
Table 93. Saudi Arabia Operating Table and Light Market, by Application – Revenue and Forecast to 2030 (US$ Million)
Table 94. Saudi Arabia Operating Table and Light Market, by End User – Revenue and Forecast to 2030 (US$ Million)
Table 95. South Africa Operating Table and Light Market, by Product Type – Revenue and Forecast to 2030 (US$ Million)
Table 96. South Africa Operating Table and Light Market, Operation Table by Product Type – Revenue and Forecast to 2030 (US$ Million)
Table 97. South Africa Operating Table and Light Market, Light by Product Type – Revenue and Forecast to 2030 (US$ Million)
Table 98. South Africa Operating Table and Light Market, by Operation Table Technology for Product Type – Revenue and Forecast to 2030 (US$ Million)
Table 99. South Africa Operating Table and Light Market, by Application – Revenue and Forecast to 2030 (US$ Million)
Table 100. South Africa Operating Table and Light Market, by End User – Revenue and Forecast to 2030 (US$ Million)
Table 101. Turkey Operating Table and Light Market, by Product Type – Revenue and Forecast to 2030 (US$ Million)
Table 102. Turkey Operating Table and Light Market, Operation Table by Product Type – Revenue and Forecast to 2030 (US$ Million)
Table 103. Turkey Operating Table and Light Market, Light by Product Type – Revenue and Forecast to 2030 (US$ Million)
Table 104. Turkey Operating Table and Light Market, by Operation Table Technology for Product Type – Revenue and Forecast to 2030 (US$ Million)
Table 105. Turkey Operating Table and Light Market, by Application – Revenue and Forecast to 2030 (US$ Million)
Table 106. Turkey Operating Table and Light Market, by End User – Revenue and Forecast to 2030 (US$ Million)
Table 107. Egypt Operating Table and Light Market, by Product Type – Revenue and Forecast to 2030 (US$ Million)
Table 108. Egypt Operating Table and Light Market, Operation Table by Product Type – Revenue and Forecast to 2030 (US$ Million)
Table 109. Egypt Operating Table and Light Market, Light by Product Type – Revenue and Forecast to 2030 (US$ Million)
Table 110. Egypt Operating Table and Light Market, by Operation Table Technology for Product Type – Revenue and Forecast to 2030 (US$ Million)
Table 111. Egypt Operating Table and Light Market, by Application – Revenue and Forecast to 2030 (US$ Million)
Table 112. Egypt Operating Table and Light Market, by End User – Revenue and Forecast to 2030 (US$ Million)
Table 113. Africa Operating Table and Light Market, by Product Type – Revenue and Forecast to 2030 (US$ Million)
Table 114. Africa Operating Table and Light Market, Operation Table by Product Type – Revenue and Forecast to 2030 (US$ Million)
Table 115. Africa Operating Table and Light Market, Light by Product Type – Revenue and Forecast to 2030 (US$ Million)
Table 116. Africa Operating Table and Light Market, by Operation Table Technology for Product Type – Revenue and Forecast to 2030 (US$ Million)
Table 117. Africa Operating Table and Light Market, by Application – Revenue and Forecast to 2030 (US$ Million)
Table 118. Africa Operating Table and Light Market, by End User – Revenue and Forecast to 2030 (US$ Million)
Table 119. Kuwait Operating Table and Light Market, by Product Type – Revenue and Forecast to 2030 (US$ Million)
Table 120. Kuwait Operating Table and Light Market, Operation Table by Product Type – Revenue and Forecast to 2030 (US$ Million)
Table 121. Kuwait Operating Table and Light Market, Light by Product Type – Revenue and Forecast to 2030 (US$ Million)
Table 122. Kuwait Operating Table and Light Market, by Operation Table Technology for Product Type – Revenue and Forecast to 2030 (US$ Million)
Table 123. Kuwait Operating Table and Light Market, by Application – Revenue and Forecast to 2030 (US$ Million)
Table 124. Kuwait Operating Table and Light Market, by End User – Revenue and Forecast to 2030 (US$ Million)
Table 125. Iraq Operating Table and Light Market, by Product Type – Revenue and Forecast to 2030 (US$ Million)
Table 126. Iraq Operating Table and Light Market, Operation Table by Product Type – Revenue and Forecast to 2030 (US$ Million)
Table 127. Iraq Operating Table and Light Market, Light by Product Type – Revenue and Forecast to 2030 (US$ Million)
Table 128. Iraq Operating Table and Light Market, by Operation Table Technology for Product Type – Revenue and Forecast to 2030 (US$ Million)
Table 129. Iraq Operating Table and Light Market, by Application – Revenue and Forecast to 2030 (US$ Million)
Table 130. Iraq Operating Table and Light Market, by End User – Revenue and Forecast to 2030 (US$ Million)
Table 131. Syria Operating Table and Light Market, by Product Type – Revenue and Forecast to 2030 (US$ Million)
Table 132. Syria Operating Table and Light Market, Operation Table by Product Type – Revenue and Forecast to 2030 (US$ Million)
Table 133. Syria Operating Table and Light Market, Light by Product Type – Revenue and Forecast to 2030 (US$ Million)
Table 134. Syria Operating Table and Light Market, by Operation Table Technology for Product Type – Revenue and Forecast to 2030 (US$ Million)
Table 135. Syria Operating Table and Light Market, by Application – Revenue and Forecast to 2030 (US$ Million)
Table 136. Syria Operating Table and Light Market, by End User – Revenue and Forecast to 2030 (US$ Million)
Table 137. Rest of Middle East & Africa Operating Table and Light Market, by Product Type – Revenue and Forecast to 2030 (US$ Million)
Table 138. Rest of Middle East & Africa Operating Table and Light Market, Operation Table by Product Type – Revenue and Forecast to 2030 (US$ Million)
Table 139. Rest of Middle East & Africa Operating Table and Light Market, Light by Product Type – Revenue and Forecast to 2030 (US$ Million)
Table 140. Rest of Middle East & Africa Operating Table and Light Market, by Operation Table Technology for Product Type – Revenue and Forecast to 2030 (US$ Million)
Table 141. Rest of Middle East & Africa Operating Table and Light Market, by Application – Revenue and Forecast to 2030 (US$ Million)
Table 142. Rest of Middle East & Africa Operating Table and Light Market, by End User – Revenue and Forecast to 2030 (US$ Million)
Table 143. South & Central America Operating Table and Light Market, by Product Type – Revenue and Forecast to 2030 (US$ Million)
Table 144. South & Central America Operating Table and Light Market, Operation Table by Product Type – Revenue and Forecast to 2030 (US$ Million)
Table 145. South & Central America Operating Table and Light Market, Light by Product Type – Revenue and Forecast to 2030 (US$ Million)
Table 146. South & Central America Operating Table and Light Market, by Operation Table Technology for Product Type – Revenue and Forecast to 2030 (US$ Million)
Table 147. South & Central America Operating Table and Light Market, by Application – Revenue and Forecast to 2030 (US$ Million)
Table 148. South & Central America Operating Table and Light Market, by End User – Revenue and Forecast to 2030 (US$ Million)
Table 149. Brazil Operating Table and Light Market, by Product Type – Revenue and Forecast to 2030 (US$ Million)
Table 150. Brazil Operating Table and Light Market, Operation Table by Product Type – Revenue and Forecast to 2030 (US$ Million)
Table 151. Brazil Operating Table and Light Market, Light by Product Type – Revenue and Forecast to 2030 (US$ Million)
Table 152. Brazil Operating Table and Light Market, by Operation Table Technology for Product Type – Revenue and Forecast to 2030 (US$ Million)
Table 153. Brazil Operating Table and Light Market, by Application – Revenue and Forecast to 2030 (US$ Million)
Table 154. Brazil Operating Table and Light Market, by End User – Revenue and Forecast to 2030 (US$ Million)
Table 155. Mexico Operating Table and Light Market, by Product Type – Revenue and Forecast to 2030 (US$ Million)
Table 156. Mexico Operating Table and Light Market, Operation Table by Product Type – Revenue and Forecast to 2030 (US$ Million)
Table 157. Mexico Operating Table and Light Market, Light by Product Type – Revenue and Forecast to 2030 (US$ Million)
Table 158. Mexico Operating Table and Light Market, by Operation Table Technology for Product Type – Revenue and Forecast to 2030 (US$ Million)
Table 159. Mexico Operating Table and Light Market, by Application – Revenue and Forecast to 2030 (US$ Million)
Table 160. Mexico Operating Table and Light Market, by End User – Revenue and Forecast to 2030 (US$ Million)
Table 161. Argentina Operating Table and Light Market, by Product Type – Revenue and Forecast to 2030 (US$ Million)
Table 162. Argentina Operating Table and Light Market, Operation Table by Product Type – Revenue and Forecast to 2030 (US$ Million)
Table 163. Argentina Operating Table and Light Market, Light by Product Type – Revenue and Forecast to 2030 (US$ Million)
Table 164. Argentina Operating Table and Light Market, by Operation Table Technology for Product Type – Revenue and Forecast to 2030 (US$ Million)
Table 165. Argentina Operating Table and Light Market, by Application – Revenue and Forecast to 2030 (US$ Million)
Table 166. Argentina Operating Table and Light Market, by End User – Revenue and Forecast to 2030 (US$ Million)
Table 167. Chile Operating Table and Light Market, by Product Type – Revenue and Forecast to 2030 (US$ Million)
Table 168. Chile Operating Table and Light Market, Operation Table by Product Type – Revenue and Forecast to 2030 (US$ Million)
Table 169. Chile Operating Table and Light Market, Light by Product Type – Revenue and Forecast to 2030 (US$ Million)
Table 170. Chile Operating Table and Light Market, by Operation Table Technology for Product Type – Revenue and Forecast to 2030 (US$ Million)
Table 171. Chile Operating Table and Light Market, by Application – Revenue and Forecast to 2030 (US$ Million)
Table 172. Chile Operating Table and Light Market, by End User – Revenue and Forecast to 2030 (US$ Million)
Table 173. Peru Operating Table and Light Market, by Product Type – Revenue and Forecast to 2030 (US$ Million)
Table 174. Peru Operating Table and Light Market, Operation Table by Product Type – Revenue and Forecast to 2030 (US$ Million)
Table 175. Peru Operating Table and Light Market, Light by Product Type – Revenue and Forecast to 2030 (US$ Million)
Table 176. Peru Operating Table and Light Market, by Operation Table Technology for Product Type – Revenue and Forecast to 2030 (US$ Million)
Table 177. Peru Operating Table and Light Market, by Application – Revenue and Forecast to 2030 (US$ Million)
Table 178. Peru Operating Table and Light Market, by End User – Revenue and Forecast to 2030 (US$ Million)
Table 179. Colombia Operating Table and Light Market, by Product Type – Revenue and Forecast to 2030 (US$ Million)
Table 180. Colombia Operating Table and Light Market, Operation Table by Product Type – Revenue and Forecast to 2030 (US$ Million)
Table 181. Colombia Operating Table and Light Market, Light by Product Type – Revenue and Forecast to 2030 (US$ Million)
Table 182. Colombia Operating Table and Light Market, by Operation Table Technology for Product Type – Revenue and Forecast to 2030 (US$ Million)
Table 183. Colombia Operating Table and Light Market, by Application – Revenue and Forecast to 2030 (US$ Million)
Table 184. Colombia Operating Table and Light Market, by End User – Revenue and Forecast to 2030 (US$ Million)
Table 185. Costa Rica Operating Table and Light Market, by Product Type – Revenue and Forecast to 2030 (US$ Million)
Table 186. Costa Rica Operating Table and Light Market, Operation Table by Product Type – Revenue and Forecast to 2030 (US$ Million)
Table 187. Costa Rica Operating Table and Light Market, Light by Product Type – Revenue and Forecast to 2030 (US$ Million)
Table 188. Costa Rica Operating Table and Light Market, by Operation Table Technology for Product Type – Revenue and Forecast to 2030 (US$ Million)
Table 189. Costa Rica Operating Table and Light Market, by Application – Revenue and Forecast to 2030 (US$ Million)
Table 190. Costa Rica Operating Table and Light Market, by End User – Revenue and Forecast to 2030 (US$ Million)
Table 191. Ecuador Operating Table and Light Market, by Product Type – Revenue and Forecast to 2030 (US$ Million)
Table 192. Ecuador Operating Table and Light Market, Operation Table by Product Type – Revenue and Forecast to 2030 (US$ Million)
Table 193. Ecuador Operating Table and Light Market, Light by Product Type – Revenue and Forecast to 2030 (US$ Million)
Table 194. Ecuador Operating Table and Light Market, by Operation Table Technology for Product Type – Revenue and Forecast to 2030 (US$ Million)
Table 195. Ecuador Operating Table and Light Market, by Application – Revenue and Forecast to 2030 (US$ Million)
Table 196. Ecuador Operating Table and Light Market, by End User – Revenue and Forecast to 2030 (US$ Million)
Table 197. Venezuela Operating Table and Light Market, by Product Type – Revenue and Forecast to 2030 (US$ Million)
Table 198. Venezuela Operating Table and Light Market, Operation Table by Product Type – Revenue and Forecast to 2030 (US$ Million)
Table 199. Venezuela Operating Table and Light Market, Light by Product Type – Revenue and Forecast to 2030 (US$ Million)
Table 200. Venezuela Operating Table and Light Market, by Operation Table Technology for Product Type – Revenue and Forecast to 2030 (US$ Million)
Table 201. Venezuela Operating Table and Light Market, by Application – Revenue and Forecast to 2030 (US$ Million)
Table 202. Venezuela Operating Table and Light Market, by End User – Revenue and Forecast to 2030 (US$ Million)
Table 203. Rest of South & Central America Operating Table and Light Market, by Product Type – Revenue and Forecast to 2030 (US$ Million)
Table 204. Rest of South & Central America Operating Table and Light Market, Operation Table by Product Type – Revenue and Forecast to 2030 (US$ Million)
Table 205. Rest of South & Central America Operating Table and Light Market, Light by Product Type – Revenue and Forecast to 2030 (US$ Million)
Table 206. Rest of South & Central America Operating Table and Light Market, by Operation Table Technology for Product Type – Revenue and Forecast to 2030 (US$ Million)
Table 207. Rest of South & Central America Operating Table and Light Market, by Application – Revenue and Forecast to 2030 (US$ Million)
Table 208. Rest of South & Central America Operating Table and Light Market, by End User – Revenue and Forecast to 2030 (US$ Million)
Table 209. Recent Developments in the Operating Table and Light Market
Table 210. Glossary of Terms, Operating Table and Light Market
List of Figures
Figure 1. Operating Table and Light Market Segmentation, By Geography
Figure 2. Asia Pacific, Middle East & Africa, and South & Central America - PEST Analysis
Figure 3. Operating Table and Light Market - Key Industry Dynamics
Figure 4. Impact Analysis of Drivers and Restraints
Figure 5. Operating Table and Light Market Revenue (US$ Mn), 2022 – 2030
Figure 6. Operating Table and Light Market Revenue, Geography (US$ Mn), 2022 – 2030
Figure 7. Operating Table and Light Market Revenue Share, by Product Type, 2022 & 2030 (%)
Figure 8. Operation Table: Operating Table and Light Market – Revenue and Forecast to 2030 (US$ Million)
Figure 9. Light: Operating Table and Light Market – Revenue and Forecast to 2030 (US$ Million)
Figure 10. Operating Table and Light Market Revenue Share, by Application 2022 & 2030 (%)
Figure 11. General Surgery: Operating Table and Light Market – Revenue and Forecast to 2030 (US$ Million)
Figure 12. Orthopedic: Operating Table and Light Market – Revenue and Forecast to 2030 (US$ Million)
Figure 13. Ophthalmic: Operating Table and Light Market – Revenue and Forecast to 2030 (US$ Million)
Figure 14. Neurosurgery: Operating Table and Light Market – Revenue and Forecast to 2030 (US$ Million)
Figure 15. Urology: Operating Table and Light Market – Revenue and Forecast to 2030 (US$ Million)
Figure 16. Cardiology: Operating Table and Light Market – Revenue and Forecast to 2030 (US$ Million)
Figure 17. Others: Operating Table and Light Market – Revenue and Forecast to 2030 (US$ Million)
Figure 18. Operating Table and Light Market Revenue Share, by End User, 2022 & 2030 (%)
Figure 19. Hospitals: Operating Table and Light Market – Revenue and Forecast to 2030 (US$ Million)
Figure 20. Ambulatory Surgical Centers: Operating Table and Light Market – Revenue and Forecast to 2030 (US$ Million)
Figure 21. Specialty Clinics: Operating Table and Light Market – Revenue and Forecast to 2030 (US$ Million)
Figure 22. Others: Operating Table and Light Market – Revenue and Forecast to 2030 (US$ Million)
Figure 23. Asia Pacific Operating Table and Light Market, by Key Country – Revenue (2022) (US$ Million)
Figure 24. Asia Pacific Operating Table and Light Market Revenue and Forecast to 2030 (US$ Mn)
Figure 25. Asia Pacific Operating Table and Light Market, By Key Countries, 2022 and 2030 (%)
Figure 26. China Operating Table and Light Market Revenue and Forecast to 2030 (US$ Mn)
Figure 27. India Operating Table and Light Market Revenue and Forecast to 2030 (US$ Mn)
Figure 28. Australia Operating Table and Light Market Revenue and Forecast to 2030 (US$ Mn)
Figure 29. South Korea Operating Table and Light Market Revenue and Forecast to 2030 (US$ Mn)
Figure 30. Nepal Operating Table and Light Market Revenue and Forecast to 2030 (US$ Mn)
Figure 31. Thailand Operating Table and Light Market Revenue and Forecast to 2030 (US$ Mn)
Figure 32. Vietnam Operating Table and Light Market Revenue and Forecast to 2030 (US$ Mn)
Figure 33. Malaysia Operating Table and Light Market Revenue and Forecast to 2030 (US$ Mn)
Figure 34. Indonesia Operating Table and Light Market Revenue and Forecast to 2030 (US$ Mn)
Figure 35. Philippines Operating Table and Light Market Revenue and Forecast to 2030 (US$ Mn)
Figure 36. Rest of Asia Pacific Operating Table and Light Market Revenue and Forecast to 2030 (US$ Mn)
Figure 37. Middle East & Africa Operating Table and Light Market, by Key Country – Revenue (2022) (US$ Million)
Figure 38. Middle East & Africa Operating Table and Light Market Revenue and Forecast to 2030 (US$ Mn)
Figure 39. Middle East & Africa Operating Table and Light Market, By Key Countries, 2022 and 2030 (%)
Figure 40. UAE Operating Table and Light Market Revenue and Forecast to 2030 (US$ Mn)
Figure 41. Saudi Arabia Operating Table and Light Market Revenue and Forecast to 2030 (US$ Mn)
Figure 42. South Africa Operating Table and Light Market Revenue and Forecast to 2030 (US$ Mn)
Figure 43. Turkey Operating Table and Light Market Revenue and Forecast to 2030 (US$ Mn)
Figure 44. Egypt Operating Table and Light Market Revenue and Forecast to 2030 (US$ Mn)
Figure 45. Africa Operating Table and Light Market Revenue and Forecast to 2030 (US$ Mn)
Figure 46. Kuwait Operating Table and Light Market Revenue and Forecast to 2030 (US$ Mn)
Figure 47. Iraq Operating Table and Light Market Revenue and Forecast to 2030 (US$ Mn)
Figure 48. Syria Operating Table and Light Market Revenue and Forecast to 2030 (US$ Mn)
Figure 49. Rest of Middle East & Africa Operating Table and Light Market Revenue and Forecast to 2030 (US$ Mn)
Figure 50. South & Central America Operating Table and Light Market, by Key Country – Revenue (2022) (US$ Million)
Figure 51. South & Central America Operating Table and Light Market Revenue and Forecast to 2030 (US$ Mn)
Figure 52. South & Central America Operating Table and Light Market, By Key Countries, 2022 and 2030 (%)
Figure 53. Brazil Operating Table and Light Market Revenue and Forecast to 2030 (US$ Mn)
Figure 54. Mexico Operating Table and Light Market Revenue and Forecast to 2030 (US$ Mn)
Figure 55. Argentina Operating Table and Light Market Revenue and Forecast to 2030 (US$ Mn)
Figure 56. Chile Operating Table and Light Market Revenue and Forecast to 2030 (US$ Mn)
Figure 57. Peru Operating Table and Light Market Revenue and Forecast to 2030 (US$ Mn)
Figure 58. Colombia Operating Table and Light Market Revenue and Forecast to 2030 (US$ Mn)
Figure 59. Argentina Operating Table and Light Market Revenue and Forecast to 2030 (US$ Mn)
Figure 60. Ecuador Operating Table and Light Market Revenue and Forecast to 2030 (US$ Mn)
Figure 61. Venezuela Operating Table and Light Market Revenue and Forecast to 2030 (US$ Mn)
Figure 62. Rest of South & Central America Operating Table and Light Market Revenue and Forecast to 2030 (US$ Mn)
The List of Companies - Operating Table and Light Market
- SKYTRON LLC
- Steris Plc
- ALVO Medical Sp zoo
- Denyers Pty Ltd
- Sciton Inc
- Getinge AB
- Mizuho Medical Co Ltd
- Merivaara Corp
- Stryker Corp
- Hill-Rom Holdings Inc
- Mediland Enterprise Corp
- Infinium Medical
- Schaerer Medical AG
- Takara Belmont Corp.
The Insight Partners performs research in 4 major stages: Data Collection & Secondary Research, Primary Research, Data Analysis and Data Triangulation & Final Review.
- Data Collection and Secondary Research:
As a market research and consulting firm operating from a decade, we have published many reports and advised several clients across the globe. First step for any study will start with an assessment of currently available data and insights from existing reports. Further, historical and current market information is collected from Investor Presentations, Annual Reports, SEC Filings, etc., and other information related to company’s performance and market positioning are gathered from Paid Databases (Factiva, Hoovers, and Reuters) and various other publications available in public domain.
Several associations trade associates, technical forums, institutes, societies and organizations are accessed to gain technical as well as market related insights through their publications such as research papers, blogs and press releases related to the studies are referred to get cues about the market. Further, white papers, journals, magazines, and other news articles published in the last 3 years are scrutinized and analyzed to understand the current market trends.
- Primary Research:
The primarily interview analysis comprise of data obtained from industry participants interview and answers to survey questions gathered by in-house primary team.
For primary research, interviews are conducted with industry experts/CEOs/Marketing Managers/Sales Managers/VPs/Subject Matter Experts from both demand and supply side to get a 360-degree view of the market. The primary team conducts several interviews based on the complexity of the markets to understand the various market trends and dynamics which makes research more credible and precise.
A typical research interview fulfils the following functions:
- Provides first-hand information on the market size, market trends, growth trends, competitive landscape, and outlook
- Validates and strengthens in-house secondary research findings
- Develops the analysis team’s expertise and market understanding
Primary research involves email interactions and telephone interviews for each market, category, segment, and sub-segment across geographies. The participants who typically take part in such a process include, but are not limited to:
- Industry participants: VPs, business development managers, market intelligence managers and national sales managers
- Outside experts: Valuation experts, research analysts and key opinion leaders specializing in the electronics and semiconductor industry.
Below is the breakup of our primary respondents by company, designation, and region:

Once we receive the confirmation from primary research sources or primary respondents, we finalize the base year market estimation and forecast the data as per the macroeconomic and microeconomic factors assessed during data collection.
- Data Analysis:
Once data is validated through both secondary as well as primary respondents, we finalize the market estimations by hypothesis formulation and factor analysis at regional and country level.
- 3.1 Macro-Economic Factor Analysis:
We analyse macroeconomic indicators such the gross domestic product (GDP), increase in the demand for goods and services across industries, technological advancement, regional economic growth, governmental policies, the influence of COVID-19, PEST analysis, and other aspects. This analysis aids in setting benchmarks for various nations/regions and approximating market splits. Additionally, the general trend of the aforementioned components aid in determining the market's development possibilities.
- 3.2 Country Level Data:
Various factors that are especially aligned to the country are taken into account to determine the market size for a certain area and country, including the presence of vendors, such as headquarters and offices, the country's GDP, demand patterns, and industry growth. To comprehend the market dynamics for the nation, a number of growth variables, inhibitors, application areas, and current market trends are researched. The aforementioned elements aid in determining the country's overall market's growth potential.
- 3.3 Company Profile:
The “Table of Contents” is formulated by listing and analyzing more than 25 - 30 companies operating in the market ecosystem across geographies. However, we profile only 10 companies as a standard practice in our syndicate reports. These 10 companies comprise leading, emerging, and regional players. Nonetheless, our analysis is not restricted to the 10 listed companies, we also analyze other companies present in the market to develop a holistic view and understand the prevailing trends. The “Company Profiles” section in the report covers key facts, business description, products & services, financial information, SWOT analysis, and key developments. The financial information presented is extracted from the annual reports and official documents of the publicly listed companies. Upon collecting the information for the sections of respective companies, we verify them via various primary sources and then compile the data in respective company profiles. The company level information helps us in deriving the base number as well as in forecasting the market size.
- 3.4 Developing Base Number:
Aggregation of sales statistics (2020-2022) and macro-economic factor, and other secondary and primary research insights are utilized to arrive at base number and related market shares for 2022. The data gaps are identified in this step and relevant market data is analyzed, collected from paid primary interviews or databases. On finalizing the base year market size, forecasts are developed on the basis of macro-economic, industry and market growth factors and company level analysis.
- Data Triangulation and Final Review:
The market findings and base year market size calculations are validated from supply as well as demand side. Demand side validations are based on macro-economic factor analysis and benchmarks for respective regions and countries. In case of supply side validations, revenues of major companies are estimated (in case not available) based on industry benchmark, approximate number of employees, product portfolio, and primary interviews revenues are gathered. Further revenue from target product/service segment is assessed to avoid overshooting of market statistics. In case of heavy deviations between supply and demand side values, all thes steps are repeated to achieve synchronization.
We follow an iterative model, wherein we share our research findings with Subject Matter Experts (SME’s) and Key Opinion Leaders (KOLs) until consensus view of the market is not formulated – this model negates any drastic deviation in the opinions of experts. Only validated and universally acceptable research findings are quoted in our reports.
We have important check points that we use to validate our research findings – which we call – data triangulation, where we validate the information, we generate from secondary sources with primary interviews and then we re-validate with our internal data bases and Subject matter experts. This comprehensive model enables us to deliver high quality, reliable data in shortest possible time.
 Get Free Sample For