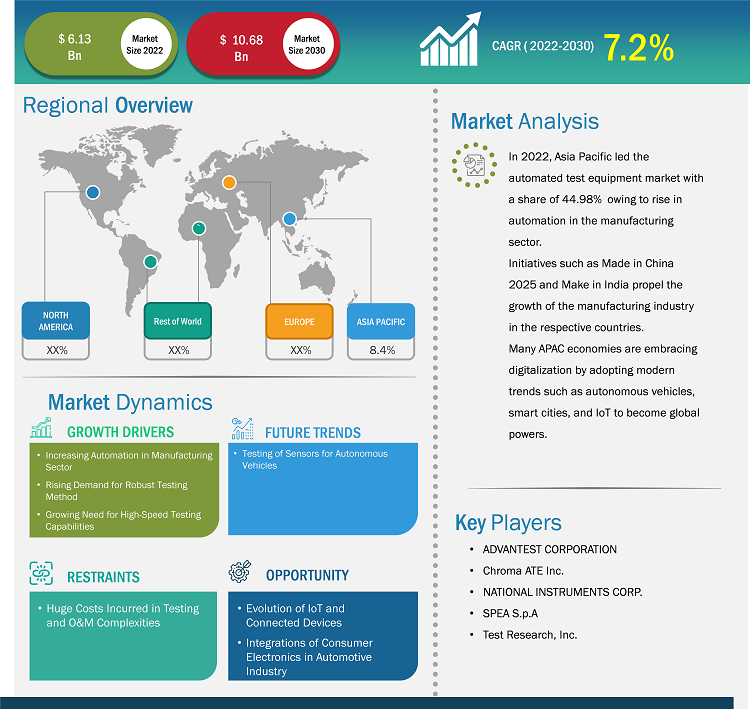
The automated test equipment market size is projected to reach US$ 10.6 billion by 2030 from US$ 6.1 billion in 2022. The market is expected to register a CAGR of 7.2% during 2022–2030. Increasing focus on cost-effective testing solutions is likely to remain a key trend in the market.
Automated Test Equipment Market Analysis
The expansion of the semiconductor industry is driving the automated test equipment market. The global semiconductor market is expected to upsurge at a yearly growth rate of 11.8% in 2024, reaching US$ 515 billion, according to the latest release from World Semiconductor Trade Statistics. Automotive manufacturers highly adopt semiconductors in their manufacturing and assembling processes. However, noteworthy growth has been observed in the automotive industry’s semiconductor demand due to advancements in automotive electronics, which are fueling the automated test equipment market growth. Furthermore, continuous demand for semiconductors, especially for 3D NAND flash memory and DRAM, in the IT & telecom industry encourages memory semiconductor manufacturers to invest and increase their production capacity.
Technological advancement in the consumer electronic industry, coupled with the introduction of innovative features such as face recognition in mobile phones by Apple Computer, is driving the automated test equipment market growth. The face recognition feature is integrated into many applications such as other mobile phones, access control, automotive, and unmanned vehicles, increasing the demand for various product components in the coming years. The shortage of materials may cause difficulties in fulfilling consumer demand for electronics. This further encourages manufacturers to make significant investments in expanding production, creating demand for related test instruments by propelling the automation test equipment market in the coming years. However, increasing complexity in consumer electronics design and growing automotive demand are projected to fuel the demand for semiconductor-automated test equipment worldwide.
Automated Test Equipment Market Overview
Automated test equipment (ATE), also known as automatic testing equipment, is a computerized machinery that is used to test the performance, functional, qualification, and safety requirements of electronic systems, subsystems, and devices. The ATE system allows manufacturers to validate and verify various electronics integrated into automotive products. The system helps manufacturers to reduce human intervention involved in manual testing by accelerating consistently running cycles of tests in the product development process. Protect testing reduces minimal chances of human errors by increasing the ability for troubleshooting. Organizations use automated test equipment to deliver quality products to customers.
Growing demand for semiconductors among various industries such as consumer electronics, automotive, healthcare, and IT & telecom are driving the automated test equipment market. The automated test equipment market is a highly concentrated market, with only a small chunk of leading semiconductor manufacturers, testing players, and foundries accounting for a larger share of total market revenue in the semiconductor and component testing industry. The market is likely to become even more intense in the near future due to growing merger and acquisition activities. Big players in the market are planning to acquire smaller semiconductor participants for the progression of their business.
Customize Research To Suit Your Requirement
We can optimize and tailor the analysis and scope which is unmet through our standard offerings. This flexibility will help you gain the exact information needed for your business planning and decision making.
Automated Test Equipment Market: Strategic Insights
Market Size Value in US$ 6.1 billion in 2022 Market Size Value by US$ 10.6 billion by 2030 Growth rate CAGR of 7.2% from 2022 to 2030 Forecast Period 2022-2030 Base Year 2022

Naveen
Have a question?
Naveen will walk you through a 15-minute call to present the report’s content and answer all queries if you have any.
 Speak to Analyst
Customize Research To Suit Your Requirement
We can optimize and tailor the analysis and scope which is unmet through our standard offerings. This flexibility will help you gain the exact information needed for your business planning and decision making.
Automated Test Equipment Market: Strategic Insights
| Market Size Value in | US$ 6.1 billion in 2022 |
| Market Size Value by | US$ 10.6 billion by 2030 |
| Growth rate | CAGR of 7.2% from 2022 to 2030 |
| Forecast Period | 2022-2030 |
| Base Year | 2022 |
Naveen
Have a question?
Naveen will walk you through a 15-minute call to present the report’s content and answer all queries if you have any.
Speak to Analyst
Automated Test Equipment Market Drivers and Opportunities
Rising Demand for Robust Testing Method to Favor Market
The consumer electronics industry is evolving at an exponential pace. The rising demand from consumers has encouraged suppliers to provide differentiated products and be the first movers in the market. A tough competition with peers in the consumer electronics industry has resulted in price wars, leading to decreasing profitability for the manufacturers. As a result of these factors, manufacturers strive continuously for innovations in their product offerings. More manufacturers have been curious about becoming the pioneers of new products in the market. The analog-to-digital conversion brought many new standards in audio and video, which improved the quality and affordability of the multimedia digital experience.
The rise of broadband has made accessing media easy and rewarding for consumers due to the rich quality enabled by the digital revolution. The proliferation of smart products is driving the need for engineers to improve electronic product design and focus on delivering lower cost, lower power, and higher performance through the integration of discrete functions.
Industry 4.0 and Smart Manufacturing
The ATE market is changing rapidly as a result of Industry 4.0 concepts like artificial intelligence (AI) and the Internet of Things (IoT). ATE systems are being equipped with smart manufacturing concepts, which allow predictive maintenance, real-time monitoring, and data analytics. This enables manufacturers to decrease downtime, increase efficiency, and optimize their testing procedures. ATE systems are growing increasingly intelligent and networked, offering useful information about product quality and production procedures. The market will likely see more innovation as smart ATE solutions become more in demand as the industry adopts Industry 4.0.
Automated Test Equipment Market Report Segmentation Analysis
Key segments that contributed to the derivation of the automated test equipment market analysis are type, component and end-user
- Based on the type, the automated test equipment market is divided into integrated circuits (ICs) testing, printed circuit boards (PCBs) testing, hard disk drives (HDDs) testing, and others. The integrated circuits (ICs) testing segment will hold a significant market share in 2022.
- By component, the market is segmented into industrial PCs, mass interconnect, and handler/prober. The industrial PCs segment held the largest market share in 2022.
- In terms of end user, the market is segmented into consumer electronics, automotive, medical, aerospace & defense, it & telecommunication, and other industries. The consumer electronics segment held the largest market share in 2022.
Automated Test Equipment Market Share Analysis by Geography
The geographic scope of the automated test equipment market report is mainly divided into five regions: North America, Asia Pacific, Europe, Middle East & Africa, and South & Central America.
APAC is expected to register sturdy growth in the global automated test equipment market due to the presence of large semiconductor manufacturing hub countries, including Taiwan, China, Vietnam, and South Korea. These countries are engaged in the manufacturing of large-volume semiconductors used in numerous industries, including automotive, healthcare, IT, telecom, and consumer electronics. For instance, according to the Semiconductor Industry Association (SIA), the sale of semiconductors grew by 3.4% in September 2023 compared to August 2023 in the APAC. Rising adoption of future technologies such as advanced Design-For-Test (DFT), fine-pitch probe cards, adaptive testing, faster mixed-signal testers, and design standards are expected to drive market growth. Increasing government initiatives and support by countries such as China, Thailand, Taiwan, Singapore, Malaysia, and Indonesia for developing and advancing manufacturing processes is expected to boost the automated test equipment market during the forecast period.
Governments of various countries in the Middle East & Africa, and South America are implementing various policies & regulations related to the adoption of advanced technologies, and growing manufacturing industries are driving the automated test equipment market. The market in the Middle East & Africa and South America is expected to expand during the forecast period due to the availability of inexpensive labor. The expansion of the automotive and consumer electronics industries is also creating opportunities for the automated test equipment market growth.
Automated Test Equipment Market Report Scope
Automated Test Equipment Market News and Recent Developments
The automated test equipment market is evaluated by gathering qualitative and quantitative data post primary and secondary research, which includes important corporate publications, association data, and databases. A few of the developments in the automated test equipment market are listed below:
- Astronics Corporation launched ORAN Test Platform MX772000PC and O-RAN Distributed Unit (O-DU) Emulator Platform Software MX773000PC solution for creating test sequences using an intuitive graphical user interface (GUI). (Source: Astronics Corporation, Press Release, March 2023)
- Teradyne Inc. shipped the 7,000th J750 semiconductor test system to Nations Technologies to help Nations Technologies verify test programs critical for the automotive market. (Source: Teradyne Inc, Press Release, July 2021)
Automated Test Equipment Market Report Coverage and Deliverables
The “Automated Test Equipment Market Size and Forecast (2020–2030)” report provides a detailed analysis of the market covering below areas:
- Automated test equipment market size and forecast at global, regional, and country levels for all the key market segments covered under the scope
- Automated test equipment market trends, as well as market dynamics such as drivers, restraints, and key opportunities
- Detailed PEST/Porter’s Five Forces and SWOT analysis
- Automated test equipment market analysis covering key market trends, global and regional framework, major players, regulations, and recent market developments
- Industry landscape and competition analysis covering market concentration, heat map analysis, prominent players, and recent developments for the automated test equipment market
- Detailed company profiles

Report Coverage
Revenue forecast, Company Analysis, Industry landscape, Growth factors, and Trends

Segment Covered
Type, Component, and End User

Regional Scope
North America, Europe, Asia Pacific, Middle East & Africa, South & Central America

Country Scope
This text is related
to country scope.
Frequently Asked Questions
The automated test equipment market size is projected to reach US$ 10.6 billion by 2030.
North America is expected to dominate the automated test equipment market with the highest market share in 2022.
The leading players operating in the automated test equipment market are ADVANTEST CORPORATION, Anritsu, Astronics Corporation, Averna, Chroma ATE Inc., EXICON, NATIONAL INSTRUMENTS CORP., SPEA S.p.A, Teradyne Inc., and Test Research, Inc.
Increasing focus on cost-effective testing solutions is anticipated to play a significant role in the global automated test equipment market in the coming years.
The global automated test equipment market is expected to grow at a CAGR of 7.2% during the forecast period 2023 - 2030.
Rising demand for robust testing methods and increasing adoption of consumer electronics are the major factors driving the automated test equipment market.
1. Introduction
1.1 The Insight Partners Research Report Guidance
1.2 Market Segmentation
2. Executive Summary
2.1 Key Insights
2.2 Market Attractiveness
3. Research Methodology
3.1 Coverage
3.2 Secondary Research
3.3 Primary Research
4. Automated Test Equipment Market Landscape
4.1 Overview
4.2 PEST Analysis
4.3 Ecosystem Analysis
4.3.1 List of Vendors in the Value Chain:
5. Automated Test Equipment Market - Key Industry Dynamics
5.1 Drivers
5.1.1 Increasing Automation in Manufacturing Sector
5.1.2 Growing Need for High-Speed Testing Capabilities
5.2 Market Restraints
5.2.1 Huge Costs Incurred in Testing and O&M Complexities
5.3 Market Opportunities
5.3.1 Evolution of IoT and Connected Devices
5.3.2 Integrations of Consumer Electronics in Automotive Industry
5.4 Future Trends
5.4.1 Testing of Sensors for Autonomous Vehicles
5.5 Impact of Drivers and Restraints:
6. Automated Test Equipment Market - Global Market Analysis
6.1 Automated Test Equipment Market Overview
6.2 Automated Test Equipment Market Revenue (US$ Million), 2022 – 2030
6.3 Automated Test Equipment Market Forecast and Analysis
7. Automated Test Equipment Market Analysis - Type
7.1 Integrated Circuits (ICs) Testing
7.1.1 Overview
7.1.2 Integrated Circuits (ICs) Testing Market Revenue and Forecasts To 2030 (US$ Million)
7.2 Printed Circuit Boards (PCBs) Testing
7.2.1 Overview
7.2.2 Printed Circuit Boards (PCBs) Testing Market Revenue and Forecasts To 2030 (US$ Million)
7.3 Hard Disk Drives (HDDs) Testing
7.3.1 Overview
7.3.2 Hard Disk Drives (HDDs) Testing Market Revenue and Forecasts To 2030 (US$ Million)
7.4 Others
7.4.1 Overview
7.4.2 Others Market Revenue and Forecasts To 2030 (US$ Million)
8. Automated Test Equipment Market Analysis - Component
8.1 Industrial PCs
8.1.1 Overview
8.1.2 Industrial PCs Market Revenue and Forecasts To 2030 (US$ Million)
8.2 Mass Interconnect
8.2.1 Overview
8.2.2 Mass Interconnect Market Revenue and Forecasts To 2030 (US$ Million)
8.3 Handler/Prober
8.3.1 Overview
8.3.2 Handler/Prober Market Revenue and Forecasts To 2030 (US$ Million)
9. Automated Test Equipment Market Analysis – End-User
9.1 Consumer Electronics
9.1.1 Overview
9.1.2 Consumer Electronics Market Revenue and Forecasts To 2030 (US$ Million)
9.2 Automotive
9.2.1 Overview
9.2.2 Automotive Market Revenue and Forecasts To 2030 (US$ Million)
9.3 Medical
9.3.1 Overview
9.3.2 Medical Market Revenue and Forecasts To 2030 (US$ Million)
9.4 Aerospace & Defense
9.4.1 Overview
9.4.2 Aerospace & Defense Market Revenue and Forecasts To 2030 (US$ Million)
9.5 IT & Telecommunication
9.5.1 Overview
9.5.2 IT & Telecommunication Market Revenue and Forecasts To 2030 (US$ Million)
9.6 Others
9.6.1 Overview
9.6.2 Others Market Revenue and Forecasts To 2030 (US$ Million)
10. Automated Test Equipment Market - Geographical Analysis
10.1 North America
10.1.1 North America Automated Test Equipment Market Overview
10.1.2 North America Automated Test Equipment Market Revenue and Forecasts to 2030 (US$ Mn)
10.1.3 North America Automated Test Equipment Market Breakdown by Type
10.1.3.1 North America Automated Test Equipment Market Revenue and Forecasts To 2030 (US$ Mn) – By Type
10.1.4 North America Automated Test Equipment Market Breakdown by Component
10.1.4.1 North America Automated Test Equipment Market Revenue and Forecasts To 2030 (US$ Mn) – By Component
10.1.5 North America Automated Test Equipment Market Breakdown by End-User
10.1.5.1 North America Automated Test Equipment Market Revenue and Forecasts To 2030 (US$ Mn) – By End-User
10.1.6 North America Automated Test Equipment Market Revenue and Forecasts and Analysis - By Countries
10.1.6.1 US Automated Test Equipment Market Revenue and Forecasts to 2030 (US$ Mn)
10.1.6.1.1 US Automated Test Equipment Market Breakdown by Type
10.1.6.1.2 US Automated Test Equipment Market Breakdown by Component
10.1.6.1.3 US Automated Test Equipment Market Breakdown by End-User
10.1.6.2 Canada Automated Test Equipment Market Revenue and Forecasts to 2030 (US$ Mn)
10.1.6.2.1 Canada Automated Test Equipment Market Breakdown by Type
10.1.6.2.2 Canada Automated Test Equipment Market Breakdown by Component
10.1.6.2.3 Canada Automated Test Equipment Market Breakdown by End-User
10.1.6.3 Mexico Automated Test Equipment Market Revenue and Forecasts to 2030 (US$ Mn)
10.1.6.3.1 Mexico Automated Test Equipment Market Breakdown by Type
10.1.6.3.2 Mexico Automated Test Equipment Market Breakdown by Component
10.1.6.3.3 Mexico Automated Test Equipment Market Breakdown by End-User
10.2 Europe
10.2.1 Europe Automated Test Equipment Market Overview
10.2.2 Europe Automated Test Equipment Market Revenue and Forecasts to 2030 (US$ Mn)
10.2.3 Europe Automated Test Equipment Market Breakdown by Type
10.2.3.1 Europe Automated Test Equipment Market Revenue and Forecasts and Analysis - By Type
10.2.4 Europe Automated Test Equipment Market Breakdown by Component
10.2.4.1 Europe Automated Test Equipment Market Revenue and Forecasts and Analysis - By Component
10.2.5 Europe Automated Test Equipment Market Breakdown by End-User
10.2.5.1 Europe Automated Test Equipment Market Revenue and Forecasts and Analysis - By End-User
10.2.6 Europe Automated Test Equipment Market Revenue and Forecasts and Analysis - By Countries
10.2.6.1 Germany Automated Test Equipment Market Revenue and Forecasts to 2030 (US$ Mn)
10.2.6.1.1 Germany Automated Test Equipment Market Breakdown by Type
10.2.6.1.2 Germany Automated Test Equipment Market Breakdown by Component
10.2.6.1.3 Germany Automated Test Equipment Market Breakdown by End-User
10.2.6.2 France Automated Test Equipment Market Revenue and Forecasts to 2030 (US$ Mn)
10.2.6.2.1 France Automated Test Equipment Market Breakdown by Type
10.2.6.2.2 France Automated Test Equipment Market Breakdown by Component
10.2.6.2.3 France Automated Test Equipment Market Breakdown by End-User
10.2.6.3 UK Automated Test Equipment Market Revenue and Forecasts to 2030 (US$ Mn)
10.2.6.3.1 UK Automated Test Equipment Market Breakdown by Type
10.2.6.3.2 UK Automated Test Equipment Market Breakdown by Component
10.2.6.3.3 UK Automated Test Equipment Market Breakdown by End-User
10.2.6.4 Italy Automated Test Equipment Market Revenue and Forecasts to 2030 (US$ Mn)
10.2.6.4.1 Italy Automated Test Equipment Market Breakdown by Type
10.2.6.4.2 Italy Automated Test Equipment Market Breakdown by Component
10.2.6.4.3 Italy Automated Test Equipment Market Breakdown by End-User
10.2.6.5 Netherlands Automated Test Equipment Market Revenue and Forecasts to 2030 (US$ Mn)
10.2.6.5.1 Netherlands Automated Test Equipment Market Breakdown by Type
10.2.6.5.2 Netherlands Automated Test Equipment Market Breakdown by Component
10.2.6.5.3 Netherlands Automated Test Equipment Market Breakdown by End-User
10.2.6.6 Rest of Europe Automated Test Equipment Market Revenue and Forecasts to 2030 (US$ Mn)
10.2.6.6.1 Rest of Europe Automated Test Equipment Market Breakdown by Type
10.2.6.6.2 Rest of Europe Automated Test Equipment Market Breakdown by Component
10.2.6.6.3 Rest of Europe Automated Test Equipment Market Breakdown by End-User
10.3 Asia Pacific Automated Test Equipment Market
10.3.1 Overview
10.3.2 Asia Pacific Automated Test Equipment Market Revenue and Forecasts To 2030 (US$ Million)
10.3.3 Asia Pacific Automated Test Equipment Market Breakdown by Type
10.3.3.1 Asia Pacific Automated Test Equipment Market Revenue and Forecasts and Analysis - By Type
10.3.4 Asia Pacific Automated Test Equipment Market Breakdown by Component
10.3.4.1 Asia Pacific Automated Test Equipment Market Revenue and Forecasts and Analysis - By Component
10.3.5 Asia Pacific Automated Test Equipment Market Breakdown by End-User
10.3.5.1 Asia Pacific Automated Test Equipment Market Revenue and Forecasts and Analysis - By End-User
10.3.6 Automated test equipment market Breakdown by Countries
10.3.6.1 China Automated Test Equipment Market Revenue and Forecasts to 2030 (US$ Mn)
10.3.6.1.1 China Automated Test Equipment Market Breakdown by Type
10.3.6.1.2 China Automated Test Equipment Market Breakdown by Component
10.3.6.1.3 China Automated Test Equipment Market Breakdown by End-User
10.3.6.2 Japan Automated Test Equipment Market Revenue and Forecasts to 2030 (US$ Mn)
10.3.6.2.1 Japan Automated Test Equipment Market Breakdown by Type
10.3.6.2.2 Japan Automated Test Equipment Market Breakdown by Component
10.3.6.2.3 Japan Automated Test Equipment Market Breakdown by End-User
10.3.6.3 South Korea Automated Test Equipment Market Revenue and Forecasts to 2030 (US$ Mn)
10.3.6.3.1 South Korea Automated Test Equipment Market Breakdown by Type
10.3.6.3.2 South Korea Automated Test Equipment Market Breakdown by Component
10.3.6.3.3 South Korea Automated Test Equipment Market Breakdown by End-User
10.3.6.4 Taiwan Automated Test Equipment Market Revenue and Forecasts to 2030 (US$ Mn)
10.3.6.4.1 Taiwan Automated Test Equipment Market Breakdown by Type
10.3.6.4.2 Taiwan Automated Test Equipment Market Breakdown by Component
10.3.6.4.3 Taiwan Automated Test Equipment Market Breakdown by End-User
10.3.6.5 India Automated Test Equipment Market Revenue and Forecasts to 2030 (US$ Mn)
10.3.6.5.1 India Automated Test Equipment Market Breakdown by Type
10.3.6.5.2 India Automated Test Equipment Market Breakdown by Component
10.3.6.5.3 India Automated Test Equipment Market Breakdown by End-User
10.3.6.6 Rest of Asia Pacific Automated Test Equipment Market Revenue and Forecasts to 2030 (US$ Mn)
10.3.6.6.1 Rest of Asia Pacific Automated Test Equipment Market Breakdown by Type
10.3.6.6.2 Rest of Asia Pacific Automated Test Equipment Market Breakdown by Component
10.3.6.6.3 Rest of Asia Pacific Automated Test Equipment Market Breakdown by End-User
10.4 Rest of World
10.4.1 Rest of World Automated Test Equipment Market Overview
10.4.2 Rest of World Automated Test Equipment Market Revenue and Forecasts to 2030 (US$ Million)
10.4.3 Rest of World Automated Test Equipment Market Breakdown by Type
10.4.3.1 Rest of World Automated Test Equipment Market and Forecasts and Analysis - By Type
10.4.4 Rest of World Automated Test Equipment Market Breakdown by Component
10.4.4.1 Rest of World Automated Test Equipment Market and Forecasts and Analysis - By Component
10.4.5 Rest of World Automated Test Equipment Market Breakdown by End-User
10.4.5.1 Rest of World Automated Test Equipment Market and Forecasts and Analysis - By End-User
10.4.6 Rest of World Automated Test Equipment Market Revenue and Forecasts and Analysis - By Countries
10.4.6.1 MEA Automated Test Equipment Market Revenue and Forecasts to 2030 (US$ Mn)
10.4.6.1.1 MEA Automated Test Equipment Market Breakdown by Type
10.4.6.1.2 MEA Automated Test Equipment Market Breakdown by Component
10.4.6.1.3 MEA Automated Test Equipment Market Breakdown by End-User
10.4.6.2 SAM Automated Test Equipment Market Revenue and Forecasts to 2030 (US$ Mn)
10.4.6.2.1 SAM Automated Test Equipment Market Breakdown by Type
10.4.6.2.2 SAM Automated Test Equipment Market Breakdown by Component
10.4.6.2.3 SAM Automated Test Equipment Market Breakdown by End-User
11. Automated Test Equipment Market – Impact of COVID-19 Pandemic
11.1 Pre & Post Covid-19 Impact
12. Competitive Landscape
12.1 Heat Map Analysis By Key Players
12.2 Company Positioning & Concentration
13. Industry Landscape
13.1 Overview
13.2 Market Initiative
13.3 Product Development
13.4 Mergers & Acquisitions
14. Company Profiles
14.1 Anritsu Corp
14.1.1 Key Facts
14.1.2 Business Description
14.1.3 Products and Services
14.1.4 Financial Overview
14.1.5 SWOT Analysis
14.1.6 Key Developments
14.2 Advantest Corp
14.2.1 Key Facts
14.2.2 Business Description
14.2.3 Products and Services
14.2.4 Financial Overview
14.2.5 SWOT Analysis
14.2.6 Key Developments
14.3 Astronics Corporation
14.3.1 Key Facts
14.3.2 Business Description
14.3.3 Products and Services
14.3.4 Financial Overview
14.3.5 SWOT Analysis
14.3.6 Key Developments
14.4 Averna Technologies Inc
14.4.1 Key Facts
14.4.2 Business Description
14.4.3 Products and Services
14.4.4 Financial Overview
14.4.5 SWOT Analysis
14.4.6 Key Developments
14.5 Chroma ATE Inc.
14.5.1 Key Facts
14.5.2 Business Description
14.5.3 Products and Services
14.5.4 Financial Overview
14.5.5 SWOT Analysis
14.5.6 Key Developments
14.6 Exicon Co., Ltd
14.6.1 Key Facts
14.6.2 Business Description
14.6.3 Products and Services
14.6.4 Financial Overview
14.6.5 SWOT Analysis
14.6.6 Key Developments
14.7 National Instruments Corp
14.7.1 Key Facts
14.7.2 Business Description
14.7.3 Products and Services
14.7.4 Financial Overview
14.7.5 SWOT Analysis
14.7.6 Key Developments
14.8 SPEA S.p.A.
14.8.1 Key Facts
14.8.2 Business Description
14.8.3 Products and Services
14.8.4 Financial Overview
14.8.5 SWOT Analysis
14.8.6 Key Developments
14.9 Teradyne Inc
14.9.1 Key Facts
14.9.2 Business Description
14.9.3 Products and Services
14.9.4 Financial Overview
14.9.5 SWOT Analysis
14.9.6 Key Developments
14.10 Test Research, Inc.
14.10.1 Key Facts
14.10.2 Business Description
14.10.3 Products and Services
14.10.4 Financial Overview
14.10.5 SWOT Analysis
14.10.6 Key Developments
15. Appendix
15.1 Word Index
List of Tables
Table 1. Automated Test Equipment Market Segmentation
Table 2. Automated Test Equipment Market Revenue and Forecasts To 2030 (US$ Million)
Table 3. Automated Test Equipment Market Revenue and Forecasts To 2030 (US$ Million) – Type
Table 4. Automated Test Equipment Market Revenue and Forecasts To 2030 (US$ Million) – Component
Table 5. Automated Test Equipment Market Revenue and Forecasts To 2030 (US$ Million) – End-User
Table 6. North America Automated Test Equipment Market Revenue and Forecasts To 2030 (US$ Mn) – By Type
Table 7. North America Automated Test Equipment Market Revenue and Forecasts To 2030 (US$ Mn) – By Component
Table 8. North America Automated Test Equipment Market Revenue and Forecasts To 2030 (US$ Mn) – By End-User
Table 9. North America Automated Test Equipment Market, by Country – Revenue and Forecast to 2030 (USD Million)
Table 10. US Automated Test Equipment Market Revenue and Forecasts To 2030 (US$ Mn) – By Type
Table 11. US Automated Test Equipment Market Revenue and Forecasts To 2030 (US$ Mn) – By Component
Table 12. US Automated Test Equipment Market Revenue and Forecasts To 2030 (US$ Mn) – By End-User
Table 13. Canada Automated Test Equipment Market Revenue and Forecasts To 2030 (US$ Mn) – By Type
Table 14. Canada Automated Test Equipment Market Revenue and Forecasts To 2030 (US$ Mn) – By Component
Table 15. Canada Automated Test Equipment Market Revenue and Forecasts To 2030 (US$ Mn) – By End-User
Table 16. Mexico Automated Test Equipment Market Revenue and Forecasts To 2030 (US$ Mn) – By Type
Table 17. Mexico Automated Test Equipment Market Revenue and Forecasts To 2030 (US$ Mn) – By Component
Table 18. Mexico Automated Test Equipment Market Revenue and Forecasts To 2030 (US$ Mn) – By End-User
Table 19. Europe Automated Test Equipment Market Revenue and Forecasts To 2030 (US$ Mn) – By Type
Table 20. Europe Automated Test Equipment Market Revenue and Forecasts To 2030 (US$ Mn) – By Component
Table 21. Europe Automated Test Equipment Market Revenue and Forecasts To 2030 (US$ Mn) – By End-User
Table 22. Europe Automated Test Equipment Market, by Country – Revenue and Forecast to 2030 (USD Million)
Table 23. Germany Automated Test Equipment Market Revenue and Forecasts To 2030 (US$ Mn) – By Type
Table 24. Germany Automated Test Equipment Market Revenue and Forecasts To 2030 (US$ Mn) – By Component
Table 25. Germany Automated Test Equipment Market Revenue and Forecasts To 2030 (US$ Mn) – By End-User
Table 26. France Automated Test Equipment Market Revenue and Forecasts To 2030 (US$ Mn) – By Type
Table 27. France Automated Test Equipment Market Revenue and Forecasts To 2030 (US$ Mn) – By Component
Table 28. France Automated Test Equipment Market Revenue and Forecasts To 2030 (US$ Mn) – By End-User
Table 29. UK Automated Test Equipment Market Revenue and Forecasts To 2030 (US$ Mn) – By Type
Table 30. UK Automated Test Equipment Market Revenue and Forecasts To 2030 (US$ Mn) – By Component
Table 31. UK Automated Test Equipment Market Revenue and Forecasts To 2030 (US$ Mn) – By End-User
Table 32. Italy Automated Test Equipment Market Revenue and Forecasts To 2030 (US$ Mn) – By Type
Table 33. Italy Automated Test Equipment Market Revenue and Forecasts To 2030 (US$ Mn) – By Component
Table 34. Italy Automated Test Equipment Market Revenue and Forecasts To 2030 (US$ Mn) – By End-User
Table 35. Netherlands Automated Test Equipment Market Revenue and Forecasts To 2030 (US$ Mn) – By Type
Table 36. Netherlands Automated Test Equipment Market Revenue and Forecasts To 2030 (US$ Mn) – By Component
Table 37. Netherlands Automated Test Equipment Market Revenue and Forecasts To 2030 (US$ Mn) – By End-User
Table 38. Rest of Europe Automated Test Equipment Market Revenue and Forecasts To 2030 (US$ Mn) – By Type
Table 39. Rest of Europe Automated Test Equipment Market Revenue and Forecasts To 2030 (US$ Mn) – By Component
Table 40. Rest of Europe Automated Test Equipment Market Revenue and Forecasts To 2030 (US$ Mn) – By End-User
Table 41. Asia Pacific Automated Test Equipment Market Revenue And Forecasts To 2030 (US$ Million) – Type
Table 42. Asia Pacific Automated Test Equipment Market Revenue And Forecasts To 2030 (US$ Million) – Component
Table 43. Asia Pacific Automated Test Equipment Market Revenue And Forecasts To 2030 (US$ Million) – End-User
Table 44. Asia Pacific Automated Test Equipment Market, by Country – Revenue and Forecast to 2030 (USD Million)
Table 45. China Automated Test Equipment Market Revenue and Forecasts To 2030 (US$ Mn) – By Type
Table 46. China Automated Test Equipment Market Revenue and Forecasts To 2030 (US$ Mn) – By Component
Table 47. China Automated Test Equipment Market Revenue and Forecasts To 2030 (US$ Mn) – By End-User
Table 48. Japan Automated Test Equipment Market Revenue and Forecasts To 2030 (US$ Mn) – By Type
Table 49. Japan Automated Test Equipment Market Revenue and Forecasts To 2030 (US$ Mn) – By Component
Table 50. Japan Automated Test Equipment Market Revenue and Forecasts To 2030 (US$ Mn) – By End-User
Table 51. South Korea Automated Test Equipment Market Revenue and Forecasts To 2030 (US$ Mn) – By Type
Table 52. South Korea Automated Test Equipment Market Revenue and Forecasts To 2030 (US$ Mn) – By Component
Table 53. South Korea Automated Test Equipment Market Revenue and Forecasts To 2030 (US$ Mn) – By End-User
Table 54. Taiwan Automated Test Equipment Market Revenue and Forecasts To 2030 (US$ Mn) – By Type
Table 55. Taiwan Automated Test Equipment Market Revenue and Forecasts To 2030 (US$ Mn) – By Component
Table 56. Taiwan Automated Test Equipment Market Revenue and Forecasts To 2030 (US$ Mn) – By End-User
Table 57. India Automated Test Equipment Market Revenue and Forecasts To 2030 (US$ Mn) – By Type
Table 58. India Automated Test Equipment Market Revenue and Forecasts To 2030 (US$ Mn) – By Component
Table 59. India Automated Test Equipment Market Revenue and Forecasts To 2030 (US$ Mn) – By End-User
Table 60. Rest of Asia Pacific Automated Test Equipment Market Revenue and Forecasts To 2030 (US$ Mn) – By Type
Table 61. Rest of Asia Pacific Automated Test Equipment Market Revenue and Forecasts To 2030 (US$ Mn) – By Component
Table 62. Rest of Asia Pacific Automated Test Equipment Market Revenue and Forecasts To 2030 (US$ Mn) – By End-User
Table 63. Rest of World Automated Test Equipment Market Revenue and Forecasts To 2030 (US$ Million) – By Type
Table 64. Rest of World Automated Test Equipment Market Revenue and Forecasts To 2030 (US$ Million) – By Component
Table 65. Rest of World Automated Test Equipment Market Revenue and Forecasts To 2030 (US$ Million) – By End-User
Table 66. Rest of World Automated Test Equipment Market, by Country – Revenue and Forecast to 2030 (USD Million)
Table 67. MEA Automated Test Equipment Market Revenue and Forecasts To 2030 (US$ Mn) – By Type
Table 68. MEA Automated Test Equipment Market Revenue and Forecasts To 2030 (US$ Mn) – By Component
Table 69. MEA Automated Test Equipment Market Revenue and Forecasts To 2030 (US$ Mn) – By End-User
Table 70. SAM Automated Test Equipment Market Revenue and Forecasts To 2030 (US$ Mn) – By Type
Table 71. SAM Automated Test Equipment Market Revenue and Forecasts To 2030 (US$ Mn) – By Component
Table 72. SAM Automated Test Equipment Market Revenue and Forecasts To 2030 (US$ Mn) – By End-User
Table 73. Company Positioning & Concentration
Table 74. List of Abbreviation
List of Figures
Figure 1. Automated Test Equipment Market Segmentation, By Geography
Figure 2. Global– PEST Analysis
Figure 3. Ecosystem: Automated Test Equipment Market
Figure 4. Automated Test Equipment Market - Key Industry Dynamics
Figure 5. Impact Analysis of Drivers and Restraints
Figure 6. Automated Test Equipment Market Breakdown by Geography, 2022 and 2030 (%)
Figure 7. Automated Test Equipment Market Revenue (US$ Million), 2022 & 2030
Figure 8. Automated Test Equipment Market Share (%) – Type, 2022 and 2030
Figure 9. Integrated Circuits (ICs) Testing Market Revenue and Forecasts To 2030 (US$ Million)
Figure 10. Printed Circuit Boards (PCBs) Testing Market Revenue and Forecasts To 2030 (US$ Million)
Figure 11. Hard Disk Drives (HDDs) Testing Market Revenue and Forecasts To 2030 (US$ Million)
Figure 12. Others Market Revenue and Forecasts To 2030 (US$ Million)
Figure 13. Automated Test Equipment Market Share (%) – Component, 2022 and 2030
Figure 14. Industrial PCs Market Revenue and Forecasts To 2030 (US$ Million)
Figure 15. Mass Interconnect Market Revenue and Forecasts To 2030 (US$ Million)
Figure 16. Handler/Prober Market Revenue and Forecasts To 2030 (US$ Million)
Figure 17. Automated Test Equipment Market Share (%) – End-User, 2022 and 2030
Figure 18. Consumer Electronics Market Revenue and Forecasts To 2030 (US$ Million)
Figure 19. Automotive Market Revenue and Forecasts To 2030 (US$ Million)
Figure 20. Medical Market Revenue and Forecasts To 2030 (US$ Million)
Figure 21. Aerospace & Defense Market Revenue and Forecasts To 2030 (US$ Million)
Figure 22. IT & Telecommunication Market Revenue and Forecasts To 2030 (US$ Million)
Figure 23. Others Market Revenue and Forecasts To 2030 (US$ Million)
Figure 24. Automated Test Equipment Market Revenue Share, By Region (2022 & 2030)
Figure 25. Automated Test Equipment Market Revenue and Forecasts To 2030 (US$ Mn)
Figure 26. Automated Test Equipment Market Breakdown by Type (2022 and 2030)
Figure 27. Automated test equipment market Breakdown by Component, 2022 and 2030 (%)
Figure 28. Automated test equipment market Breakdown by End-User, 2022 and 2030 (%)
Figure 29. Automated test equipment market Breakdown by Key Countries, 2022 and 2030 (%)
Figure 30. US Automated Test Equipment Market Revenue and Forecasts To 2030 (US$ Mn)
Figure 31. Canada Automated Test Equipment Market Revenue and Forecasts To 2030 (US$ Mn)
Figure 32. Mexico Automated Test Equipment Market Revenue and Forecasts To 2030 (US$ Mn)
Figure 33. Automated Test Equipment Market Revenue and Forecasts To 2030 (US$ Mn)
Figure 34. Automated Test Equipment Market Breakdown by Type (2022 and 2030)
Figure 35. Automated Test Equipment Market Breakdown by Component (2022 and 2030)
Figure 36. Automated Test Equipment Market Breakdown by End-User (2022 and 2030)
Figure 37. Automated test equipment market Breakdown by Key Countries, 2022 and 2030 (%)
Figure 38. Germany Automated Test Equipment Market Revenue and Forecasts To 2030 (US$ Mn)
Figure 39. France Automated Test Equipment Market Revenue and Forecasts To 2030 (US$ Mn)
Figure 40. UK Automated Test Equipment Market Revenue and Forecasts To 2030 (US$ Mn)
Figure 41. Italy Automated Test Equipment Market Revenue and Forecasts To 2030 (US$ Mn)
Figure 42. Netherlands Automated Test Equipment Market Revenue and Forecasts To 2030 (US$ Mn)
Figure 43. Rest of Europe Automated Test Equipment Market Revenue and Forecasts To 2030 (US$ Mn)
Figure 44. Asia Pacific Automated Test Equipment Market Revenue And Forecasts To 2030 (US$ Million)
Figure 45. Asia Pacific Automated Test Equipment Market Breakdown by Type (2022 and 2023)
Figure 46. Asia Pacific Automated Test Equipment Market Breakdown by Component (2022 and 2023)
Figure 47. Asia Pacific Automated Test Equipment Market Breakdown by End-User (2022 and 2023)
Figure 48. Asia Pacific Automated Test Equipment Market Breakdown By Key Countries, 2022 And 2030 (%)
Figure 49. China Automated Test Equipment Market Revenue and Forecasts To 2030 (US$ Mn)
Figure 50. Japan Automated Test Equipment Market Revenue and Forecasts To 2030 (US$ Mn)
Figure 51. South Korea Automated Test Equipment Market Revenue and Forecasts To 2030 (US$ Mn)
Figure 52. Taiwan Automated Test Equipment Market Revenue and Forecasts To 2030 (US$ Mn)
Figure 53. India Automated Test Equipment Market Revenue and Forecasts To 2030 (US$ Mn)
Figure 54. Rest of Asia Pacific Automated Test Equipment Market Revenue and Forecasts To 2030 (US$ Mn)
Figure 55. Automated Test Equipment Market Revenue and Forecasts To 2030 (US$ Million)
Figure 56. Rest of World Automated Test Equipment Market Breakdown by Type (2022 and 2023)
Figure 57. Rest of World Automated Test Equipment Market Breakdown by Component (2022 and 2023)
Figure 58. Rest of World Automated Test Equipment Market Breakdown by End-User (2022 and 2023)
Figure 59. Automated Test Equipment Market Breakdown by Key Countries, 2022 and 2030 (%)
Figure 60. MEA Automated Test Equipment Market Revenue and Forecasts To 2030 (US$ Mn)
Figure 61. SAM Automated Test Equipment Market Revenue and Forecasts To 2030 (US$ Mn)
Figure 62. Heat Map Analysis By Key Players
The List of Companies - Automated Test Equipment Market
- Anritsu Corp
- Advantest Corp
- Astronics Corporation
- Averna Technologies Inc
- Chroma ATE Inc.
- Exicon Co., Ltd
- National Instruments Corp
- SPEA S.p.A.
- Teradyne Inc
- Test Research, Inc.
The Insight Partners performs research in 4 major stages: Data Collection & Secondary Research, Primary Research, Data Analysis and Data Triangulation & Final Review.
- Data Collection and Secondary Research:
As a market research and consulting firm operating from a decade, we have published many reports and advised several clients across the globe. First step for any study will start with an assessment of currently available data and insights from existing reports. Further, historical and current market information is collected from Investor Presentations, Annual Reports, SEC Filings, etc., and other information related to company’s performance and market positioning are gathered from Paid Databases (Factiva, Hoovers, and Reuters) and various other publications available in public domain.
Several associations trade associates, technical forums, institutes, societies and organizations are accessed to gain technical as well as market related insights through their publications such as research papers, blogs and press releases related to the studies are referred to get cues about the market. Further, white papers, journals, magazines, and other news articles published in the last 3 years are scrutinized and analyzed to understand the current market trends.
- Primary Research:
The primarily interview analysis comprise of data obtained from industry participants interview and answers to survey questions gathered by in-house primary team.
For primary research, interviews are conducted with industry experts/CEOs/Marketing Managers/Sales Managers/VPs/Subject Matter Experts from both demand and supply side to get a 360-degree view of the market. The primary team conducts several interviews based on the complexity of the markets to understand the various market trends and dynamics which makes research more credible and precise.
A typical research interview fulfils the following functions:
- Provides first-hand information on the market size, market trends, growth trends, competitive landscape, and outlook
- Validates and strengthens in-house secondary research findings
- Develops the analysis team’s expertise and market understanding
Primary research involves email interactions and telephone interviews for each market, category, segment, and sub-segment across geographies. The participants who typically take part in such a process include, but are not limited to:
- Industry participants: VPs, business development managers, market intelligence managers and national sales managers
- Outside experts: Valuation experts, research analysts and key opinion leaders specializing in the electronics and semiconductor industry.
Below is the breakup of our primary respondents by company, designation, and region:

Once we receive the confirmation from primary research sources or primary respondents, we finalize the base year market estimation and forecast the data as per the macroeconomic and microeconomic factors assessed during data collection.
- Data Analysis:
Once data is validated through both secondary as well as primary respondents, we finalize the market estimations by hypothesis formulation and factor analysis at regional and country level.
- 3.1 Macro-Economic Factor Analysis:
We analyse macroeconomic indicators such the gross domestic product (GDP), increase in the demand for goods and services across industries, technological advancement, regional economic growth, governmental policies, the influence of COVID-19, PEST analysis, and other aspects. This analysis aids in setting benchmarks for various nations/regions and approximating market splits. Additionally, the general trend of the aforementioned components aid in determining the market's development possibilities.
- 3.2 Country Level Data:
Various factors that are especially aligned to the country are taken into account to determine the market size for a certain area and country, including the presence of vendors, such as headquarters and offices, the country's GDP, demand patterns, and industry growth. To comprehend the market dynamics for the nation, a number of growth variables, inhibitors, application areas, and current market trends are researched. The aforementioned elements aid in determining the country's overall market's growth potential.
- 3.3 Company Profile:
The “Table of Contents” is formulated by listing and analyzing more than 25 - 30 companies operating in the market ecosystem across geographies. However, we profile only 10 companies as a standard practice in our syndicate reports. These 10 companies comprise leading, emerging, and regional players. Nonetheless, our analysis is not restricted to the 10 listed companies, we also analyze other companies present in the market to develop a holistic view and understand the prevailing trends. The “Company Profiles” section in the report covers key facts, business description, products & services, financial information, SWOT analysis, and key developments. The financial information presented is extracted from the annual reports and official documents of the publicly listed companies. Upon collecting the information for the sections of respective companies, we verify them via various primary sources and then compile the data in respective company profiles. The company level information helps us in deriving the base number as well as in forecasting the market size.
- 3.4 Developing Base Number:
Aggregation of sales statistics (2020-2022) and macro-economic factor, and other secondary and primary research insights are utilized to arrive at base number and related market shares for 2022. The data gaps are identified in this step and relevant market data is analyzed, collected from paid primary interviews or databases. On finalizing the base year market size, forecasts are developed on the basis of macro-economic, industry and market growth factors and company level analysis.
- Data Triangulation and Final Review:
The market findings and base year market size calculations are validated from supply as well as demand side. Demand side validations are based on macro-economic factor analysis and benchmarks for respective regions and countries. In case of supply side validations, revenues of major companies are estimated (in case not available) based on industry benchmark, approximate number of employees, product portfolio, and primary interviews revenues are gathered. Further revenue from target product/service segment is assessed to avoid overshooting of market statistics. In case of heavy deviations between supply and demand side values, all thes steps are repeated to achieve synchronization.
We follow an iterative model, wherein we share our research findings with Subject Matter Experts (SME’s) and Key Opinion Leaders (KOLs) until consensus view of the market is not formulated – this model negates any drastic deviation in the opinions of experts. Only validated and universally acceptable research findings are quoted in our reports.
We have important check points that we use to validate our research findings – which we call – data triangulation, where we validate the information, we generate from secondary sources with primary interviews and then we re-validate with our internal data bases and Subject matter experts. This comprehensive model enables us to deliver high quality, reliable data in shortest possible time.
 Get Free Sample For