The Bioplastic Packaging Market is expected to register a CAGR of 10% from 2025 to 2031, with a market size expanding from US$ XX million in 2024 to US$ XX Million by 2031.
The report presents analysis based on material (bio-polylactic acid, bio-polyethylene, bio-polyhydroxyalkanoates, bio-polyethylene terephthalate, and others). The report is segmented by application (bottles, films, bags, pouch and sachet, cups and trays, and others). The report presents analysis based on end use (food and beverages, cosmetics and personal care, pharmaceutical and nutraceutical, consumer goods, and others). The global analysis is further broken-down at regional level and major countries. The market size and forecast at global, regional, and country levels for all the key market segments are covered under the scope. The report offers the value in USD for the above analysis and segments. The report provides key statistics on the market status of the key market players and offers market trends and opportunities.
Purpose of the ReportThe report Bioplastic Packaging Market by The Insight Partners aims to describe the present landscape and future growth, top driving factors, challenges, and opportunities. This will provide insights to various business stakeholders, such as:
- Technology Providers/Manufacturers: To understand the evolving market dynamics and know the potential growth opportunities, enabling them to make informed strategic decisions.
- Investors: To conduct a comprehensive trend analysis regarding the market growth rate, market financial projections, and opportunities that exist across the value chain.
- Regulatory bodies: To regulate policies and police activities in the market with the aim of minimizing abuse, preserving investor trust and confidence, and upholding the integrity and stability of the market.
Bioplastic Packaging Market Segmentation
Material- Bio-Polylactic Acid
- Bio-Polyethylene
- Bio-Polyhydroxyalkanoates
- Bio-Polyethylene Terephthalate
- Bottles
- Films
- Bags
- Pouch and Sachet
- Cups and Trays
Strategic Insights
Bioplastic Packaging Market Growth Drivers- Rising Demand for Sustainable Packaging Solutions: The growing consumer demand for eco-friendly and sustainable packaging is a key driver of the bioplastic packaging market. As plastic waste and environmental concerns rise, bioplastics, made from renewable resources such as plant-based materials, offer a biodegradable alternative to conventional plastics. This demand for sustainable packaging solutions is pushing industries in food and beverage, retail, and consumer goods to adopt bioplastic packaging, driving market growth.
- Stringent Environmental Regulations on Plastics: Governments across the world are implementing stricter regulations on plastic waste, pollution, and non-biodegradable packaging, driving the demand for bioplastics. Policies such as plastic bans and extended producer responsibility (EPR) programs are encouraging manufacturers to shift towards biodegradable and compostable alternatives. Bioplastics offer a viable solution to meet regulatory requirements, fostering the growth of the bioplastic packaging market as industries seek compliance with environmental standards.
- Growing Consumer Preference for Eco-friendly Products: There is an increasing shift in consumer preferences towards products with minimal environmental impact. Consumers are becoming more aware of the ecological footprint of packaging and are actively seeking products with sustainable packaging. This growing demand for eco-conscious products is driving brands to choose bioplastic packaging as part of their sustainability efforts, contributing to the overall growth of the market.
- Advancements in Bioplastic Production Technologies: Technological advancements in bioplastic production are enhancing the feasibility and performance of bioplastic packaging. New innovations in processing technologies are improving the efficiency and cost-effectiveness of bioplastics, making them more competitive with traditional plastics. The development of new bio-based polymers, such as polylactic acid (PLA) and polyhydroxyalkanoates (PHA), with enhanced durability and functionality, is driving the growth and adoption of bioplastic packaging in various industries.
- Increasing Investment in R&D for Bioplastics: Investment in research and development (R&D) is creating new opportunities for the bioplastic packaging market. Manufacturers are focused on developing bioplastics with improved properties, such as greater strength, flexibility, and resistance to moisture and heat. Additionally, R&D efforts are targeting the use of more sustainable and locally sourced raw materials for bioplastics. These innovations are helping to increase the market's versatility and expand its applications in packaging.
- Expansion in Emerging Markets: Emerging economies in regions like Asia-Pacific, Latin America, and Africa are witnessing rapid growth in the adoption of bioplastic packaging. Rising awareness of plastic pollution, coupled with regulatory pressures and government incentives for sustainable packaging, is encouraging businesses in these regions to switch to bioplastics. The increasing demand for eco-friendly packaging solutions in developing regions is creating significant growth opportunities for bioplastic packaging manufacturers.
- Opportunities in Food and Beverage Industry: The food and beverage industry presents significant opportunities for the bioplastic packaging market due to its high demand for packaging solutions. Bioplastics offer a sustainable option for packaging food products, providing benefits such as biodegradability and compostability. As consumer preferences shift towards more sustainable packaging options, bioplastics are becoming increasingly popular in food packaging, creating growth opportunities for manufacturers targeting this industry.
- Opportunities in E-commerce and Retail Packaging: With the rise of e-commerce, there is growing demand for sustainable packaging solutions in online retail. Bioplastics are emerging as a viable option for e-commerce packaging due to their eco-friendly characteristics. The increased focus on reducing plastic waste in shipping and packaging processes is encouraging retailers to adopt bioplastic alternatives, creating a lucrative opportunity for the market to expand in the e-commerce sector.
- Opportunities in Biodegradable Plastics for Single-Use Products: The market for single-use plastic alternatives presents significant opportunities for bioplastics. Items such as cutlery, straws, and packaging materials are among the most common single-use plastics, contributing to plastic waste. As governments and consumers demand alternatives, bioplastics offer a biodegradable solution for these products. This shift to sustainable packaging and products is driving the growth of bioplastics in the single-use plastics market.
Market Report Scope
Key Selling Points
- Comprehensive Coverage: The report comprehensively covers the analysis of products, services, types, and end users of the Bioplastic Packaging Market, providing a holistic landscape.
- Expert Analysis: The report is compiled based on the in-depth understanding of industry experts and analysts.
- Up-to-date Information: The report assures business relevance due to its coverage of recent information and data trends.
- Customization Options: This report can be customized to cater to specific client requirements and suit the business strategies aptly.
The research report on the Bioplastic Packaging Market can, therefore, help spearhead the trail of decoding and understanding the industry scenario and growth prospects. Although there can be a few valid concerns, the overall benefits of this report tend to outweigh the disadvantages.
- Sample PDF showcases the content structure and the nature of the information with qualitative and quantitative analysis.
- Request discounts available for Start-Ups & Universities

Have a question?

Shejal
Shejal will walk you through a 15-minute call to present the report’s content and answer all queries if you have any.
 Speak to Analyst
- Sample PDF showcases the content structure and the nature of the information with qualitative and quantitative analysis.
- Request discounts available for Start-Ups & Universities


- Sample PDF showcases the content structure and the nature of the information with qualitative and quantitative analysis.
- Request discounts available for Start-Ups & Universities

Report Coverage
Revenue forecast, Company Analysis, Industry landscape, Growth factors, and Trends

Segment Covered
Product, Type, and Application

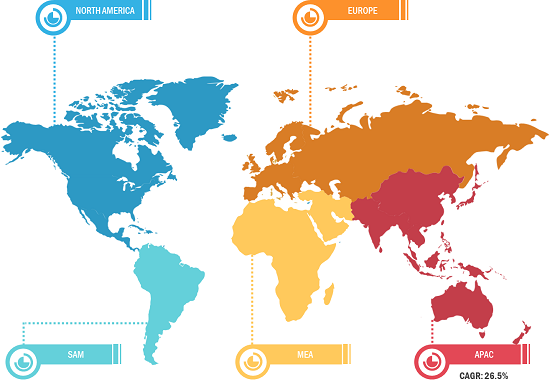
Regional Scope
North America, Europe, Asia Pacific, Middle East & Africa, South & Central America

Country Scope
This text is related
to country scope.
Frequently Asked Questions
Based on geography, Europe held the largest share of the bioplastic packaging market due to strong regulatory support for sustainable practices, a well-established infrastructure for bioplastics, and increasing consumer demand for eco-friendly packaging solutions.
Based on material, the bio-polylactic acid segment is expected to witness the fastest growth during the forecast period
The Bioplastic Packaging Market is estimated to witness a CAGR of 10% from 2023 to 2031
Stringent regulations on single-use plastics is driving the market growth.
Arkema SA; Avantium NV; BASF SE; Braskem SA; Eastman Chemical Company; Futamura Group; NatureWorks LLC; Neovia SAS; Novamont SpA; and Plantic Technologies Limited are some of the key players operating in the bioplastic packaging market
The increasing use of agricultural waste and by-products as raw materials is expected to be the key market trends.
TABLE OF CONTENTS
1. INTRODUCTION 18
1.1 SCOPE OF THE STUDY 18
1.2 THE INSIGHT PARTNERS RESEARCH REPORT GUIDANCE 18
2. KEY TAKEAWAYS 19
3. BIOPLASTIC PACKAGING MARKET LANDSCAPE 21
3.1 MARKET OVERVIEW 21
3.2 MARKET SEGMENTATION 22
3.2.1 Global Bioplastic Packaging Market – By Product 23
3.2.2 Global Bioplastic Packaging Market – By Type 23
3.2.3 Global Bioplastic Packaging Market – By Application 24
3.2.4 Global Bioplastic Packaging Market – By Geography 24
3.3 PEST ANALYSIS 25
3.3.1 North America PEST Analysis 25
3.3.2 Europe PEST Analysis 27
3.3.3 APAC PEST Analysis 29
3.3.4 MEA PEST Analysis 31
3.3.5 SAM PEST Analysis 33
4. BIOPLASTIC PACKAGING MARKET – KEY INDUSTRY DYNAMICS 35
4.1 KEY MARKET DRIVERS 35
4.1.1 Increasing awareness among customers about the adverse impact of conventional plastics 35
4.1.2 Surge in need for sustainable packaging solution 35
4.1.3 Rising government support for the incorporation of bioplastic in packaging 36
4.2 KEY MARKET RESTRAINTS 36
4.2.1 High cost of bio-based packaging than conventional plastic packaging 36
4.3 KEY MARKET OPPORTUNITIES 36
4.3.1 Development of new technology and processes 36
4.4 FUTURE TRENDS 37
4.4.1 Emergence of novel bioplastic materials 37
4.5 IMPACT ANALYSIS OF DRIVERS AND RESTRAINTS 38
5. BIOPLASTIC PACKAGING MARKET – GLOBAL MARKET ANALYSIS 39
5.1 GLOBAL BIOPLASTIC PACKAGING MARKET OVERVIEW 39
5.2 GLOBAL BIOPLASTIC PACKAGING MARKET FORECAST AND ANALYSIS 40
6. BIOPLASTIC PACKAGING MARKET REVENUE AND FORECAST TO 2025 – PRODUCT 42
6.1 OVERVIEW 42
6.2 GLOBAL BIOPLASTIC PACKAGING MARKET BREAKDOWN, BY PRODUCT, 2017 & 2025 42
6.3 STARCH BLENDS MARKET 44
6.3.1 Overview 44
6.3.2 Starch Blends Market Forecast and Analysis 44
6.4 POLYLACTIC ACID MARKET 45
6.4.1 Overview 45
6.4.2 Polylactic Acid Market Forecast and Analysis 45
6.5 POLYETHYLENE TEREPHTHALATE MARKET 47
6.5.1 Overview 47
6.5.2 Polyethylene Terephthalate Market Forecast and Analysis 47
6.6 POLYHYDROXYALKANOATES MARKET 48
6.6.1 Overview 48
6.6.2 Polyhydroxyalkanoates Market Forecast and Analysis 48
6.7 POLYETHYLENE MARKET 50
6.7.1 Overview 50
6.7.2 Polyethylene Market Forecast and Analysis 50
6.8 OTHERS MARKET 51
6.8.1 Overview 51
6.8.2 Others Market Forecast and Analysis 51
7. BIOPLASTIC PACKAGING MARKET REVENUE AND FORECAST TO 2025 – TYPE 53
7.1 OVERVIEW 53
7.2 GLOBAL BIOPLASTIC PACKAGING MARKET BREAKDOWN, BY TYPE, 2017 & 2025 53
7.3 RIGID PACKAGING MARKET 55
7.3.1 Overview 55
7.3.2 Rigid Packaging Market Forecast and Analysis 55
7.4 FLEXIBLE PACKAGING MARKET 56
7.4.1 Overview 56
7.4.2 Flexible Packaging Market Forecast and Analysis 57
8. BIOPLASTIC PACKAGING MARKET REVENUE AND FORECAST TO 2025 – APPLICATION 58
8.1 OVERVIEW 58
8.2 GLOBAL BIOPLASTIC PACKAGING MARKET BREAKDOWN, BY APPLICATION, 2017 & 2025 58
8.3 FOOD & BEVERAGES MARKET 60
8.3.1 Overview 60
8.3.2 Food & Beverages Market Forecast and Analysis 60
8.4 CONSUMER GOODS MARKET 61
8.4.1 Overview 61
8.4.2 Consumer Goods Market Forecast and Analysis 61
8.5 COSMETIC & PERSONAL CARE MARKET 63
8.5.1 Overview 63
8.5.2 Cosmetic & Personal Care Market Forecast and Analysis 63
8.6 PHARMACEUTICALS MARKET 64
8.6.1 Overview 64
8.6.2 Pharmaceuticals Market Forecast and Analysis 64
8.7 OTHERS MARKET 66
8.7.1 Overview 66
8.7.2 Others Market Forecast and Analysis 66
9. BIOPLASTIC PACKAGING MARKET – GEOGRAPHICAL ANALYSIS 68
9.1 OVERVIEW 68
9.2 NORTH AMERICA BIOPLASTIC PACKAGING MARKET REVENUE AND FORECAST TO 2025 70
9.2.1 Overview 70
9.2.2 North America Bioplastic packaging Market Breakdown by Key Countries 71
9.2.2.1 U.S. Bioplastic packaging Market Revenue & Volume and Forecast to 2025 (US$ Mn, ‘000 Tons) 73
9.2.2.2 Canada Bioplastic packaging Market Revenue & Volume and Forecast to 2025 (US$ Mn, ‘000 Tons) 74
9.2.2.3 Mexico Bioplastic packaging Market Revenue & Volume and Forecast to 2025 (US$ Mn, ‘000 Tons) 75
9.2.3 North America Bioplastic packaging Market Breakdown by Product 77
9.2.4 North America Bioplastic packaging Market Breakdown by Type 78
9.2.5 North America Bioplastic packaging Market Breakdown by Application 79
9.3 EUROPE BIOPLASTIC PACKAGING MARKET REVENUE AND FORECAST TO 2025 80
9.3.1 Overview 80
9.3.2 Europe Bioplastic packaging Market Breakdown by Key Countries 82
9.3.2.1 France Bioplastic packaging Market Revenue & Volume and Forecast to 2025 (US$ Mn, ‘000 Tons) 83
9.3.2.2 Germany Bioplastic Packaging Market Revenue & Volume and Forecast to 2025 (US$ Mn, ‘000 Tons) 84
9.3.2.3 Italy Bioplastic packaging Market Revenue & Volume and Forecast to 2025 (US$ Mn, ‘000 Tons) 85
9.3.2.4 Italy Bioplastic packaging Market Revenue & Volume and Forecast to 2025 (US$ Mn, ‘000 Tons) 85
9.3.2.5 U.K Bioplastic packaging Market Revenue & Volume and Forecast to 2025 (US$ Mn, ‘000 Tons) 86
9.3.2.6 Spain Bioplastic packaging Market Revenue & Volume and Forecast to 2025 (US$ Mn, ‘000 Tons) 87
9.3.2.7 Rest of Europe Bioplastic packaging Market Revenue & Volume and Forecast to 2025 (US$ Mn, ‘000 Tons) 88
9.3.3 Europe Bioplastic packaging Market Breakdown by Product 90
9.3.4 Europe Bioplastic packaging Market Breakdown by Type 91
9.3.5 Europe Bioplastic packaging Market Breakdown by Application 92
9.4 APAC BIOPLASTIC PACKAGING MARKET REVENUE AND FORECAST TO 2025 93
9.4.1 Overview 93
9.4.2 APAC Bioplastic packaging Market Breakdown by Key Countries 95
9.4.2.1 Australia Bioplastic packaging Market Revenue & Volume and Forecast to 2025 (US$ Mn, ‘000 Tons) 96
9.4.2.2 China Bioplastic packaging Market Revenue & Volume and Forecast to 2025 (US$ Mn, ‘000 Tons) 97
9.4.2.3 Japan Bioplastic packaging Market Revenue & Volume and Forecast to 2025 (US$ Mn, ‘000 Tons) 99
9.4.2.4 Rest of APAC Bioplastic packaging Market Revenue & Volume and Forecast to 2025 (US$ Mn, ‘000 Tons) 100
9.4.3 APAC Bioplastic packaging Market Breakdown by Product 101
9.4.4 APAC Bioplastic packaging Market Breakdown by Type 102
9.4.5 APAC Bioplastic packaging Market Breakdown by Application 103
9.5 MIDDLE EAST & AFRICA (MEA) BIOPLASTIC PACKAGING MARKET REVENUE AND FORECAST TO 2025 104
9.5.1 Overview 104
9.5.2 MEA Bioplastic packaging Market Breakdown by Key Countries 106
9.5.2.1 Saudi Arabia Bioplastic packaging Market Revenue & Volume and Forecast to 2025 (US$ Mn, ‘000 Tons) 107
9.5.2.2 UAE Bioplastic packaging Market Revenue & Volume and Forecast to 2025 (US$ Mn, ‘000 Tons) 108
9.5.2.3 South Africa Bioplastic packaging Market Revenue & Volume and Forecast to 2025 (US$ Mn, ‘000 Tons) 109
9.5.2.4 Rest of MEA Bioplastic packaging Market Revenue & Volume and Forecast to 2025 (US$ Mn, ‘000 Tons) 109
9.5.3 MEA Bioplastic packaging Market Breakdown by Product 110
9.5.4 MEA Bioplastic packaging Market Breakdown by Type 112
9.5.5 MEA Bioplastic packaging Market Breakdown by Application 113
9.6 SOUTH AMERICA (SAM) BIOPLASTIC PACKAGING MARKET REVENUE AND FORECAST TO 2025 114
9.6.1 Overview 114
9.6.2 SAM Bioplastic packaging Market Breakdown by Key Countries 115
9.6.2.1 Brazil Bioplastic packaging Market Revenue & Volume and Forecast to 2025 (US$ Mn, ‘000 Tons) 117
9.6.2.2 Rest of SAM Bioplastic packaging Market Revenue & Volume and Forecast to 2025 (US$ Mn, ‘000 Tons) 118
9.6.3 SAM Bioplastic packaging Market Breakdown by Product 119
9.6.4 SAM Bioplastic packaging Market Breakdown by Type 120
9.6.5 SAM Bioplastic packaging Market Breakdown by Application 121
10. INDUSTRY LANDSCAPE 122
10.1 MARKET INITIATIVE 122
10.2 MERGER AND ACQUISITION 123
10.3 NEW DEVELOPMENT 124
11. COMPETITIVE LANDSCAPE 125
11.1 COMPETITIVE PRODUCT MAPPING 125
11.2 MARKET POSITIONING – GLOBAL TOP 5 PLAYERS RANKING 127
12. BIOPLASTIC PACKAGING MARKET, KEY COMPANY PROFILES 128
12.1 ARKEMA GROUP 128
12.1.1 Key Facts 128
12.1.2 Business Description 128
12.1.3 Financial Overview 129
12.1.4 SWOT Analysis 129
12.1.5 Key Developments 131
12.2 BASF SE 133
12.2.1 Key Facts 133
12.2.2 Business Description 133
12.2.3 Financial Overview 134
12.2.4 SWOT Analysis 134
12.2.5 Key Developments 136
12.3 BRASKEM S.A. 137
12.3.1 Key Facts 137
12.3.2 Business Description 137
12.3.3 Financial Overview 138
12.3.4 SWOT Analysis 138
12.3.5 Key Developments 139
12.4 CARDIA BIOPLASTICS 141
12.4.1 Key Facts 141
12.4.2 Business Description 141
12.4.3 Financial Overview 141
12.4.4 SWOT Analysis 142
12.4.5 Key Developments 143
12.5 CORBION N.V. 144
12.5.1 Key Facts 144
12.5.2 Business Description 144
12.5.3 Financial Overview 145
12.5.4 SWOT Analysis 145
12.5.5 Key Developments 147
12.6 EVONIK INDUSTRIES AG 148
12.6.1 Key Facts 148
12.6.2 Business Description 148
12.6.3 Financial Overview 149
12.6.4 SWOT Analysis 149
12.6.5 Key Developments 151
12.7 KONINKLIJKE DSM N.V. 152
12.7.1 Key Facts 152
12.7.2 Business Description 152
12.7.3 Financial Overview 153
12.7.4 SWOT Analysis 153
12.7.5 Key Developments 155
12.8 NATUREWORKS LLC 156
12.8.1 Key Facts 156
12.8.2 Business Description 156
12.8.3 Financial Overview 156
12.8.4 SWOT Analysis 157
12.8.5 Key Developments 158
12.9 NOVAMONT S.P.A. 159
12.9.1 Key Facts 159
12.9.2 Business Description 159
12.9.3 Financial Overview 159
12.9.4 SWOT Analysis 160
12.9.5 Key Developments 161
12.10 THE DOW CHEMICAL COMPANY 163
12.10.1 Key Facts 163
12.10.2 Business Description 163
12.10.3 Financial Overview 164
12.10.4 SWOT Analysis 164
12.10.5 Key Developments 166
13. APPENDIX 167
13.1 ABOUT THE INSIGHT PARTNERS 167
13.2 GLOSSARY OF TERMS 167
13.3 METHODOLOGY 169
13.3.1 Coverage 169
13.3.2 Secondary Research 169
13.3.3 Primary Research 170
LIST OF TABLES
TABLE 1. GLOBAL BIOPLASTIC PACKAGING MARKET REVENUE AND FORECASTS TO 2025 (US$ MN) 40
TABLE 2. GLOBAL BIOPLASTIC PACKAGING MARKET VOLUME AND FORECASTS TO 2025 (‘000 TONS) 40
TABLE 3. GLOBAL BIOPLASTIC PACKAGING MARKET REVENUE AND FORECASTS TO 2025, BY GEOGRAPHY (US$ MN) 40
TABLE 4. GLOBAL BIOPLASTIC PACKAGING MARKET VOLUME AND FORECASTS TO 2025, BY GEOGRAPHY (‘000 TONS) 41
TABLE 5. NORTH AMERICA BIOPLASTIC PACKAGING MARKET REVENUE AND FORECAST TO 2025 – BY PRODUCT (US$ MN) 77
TABLE 6. NORTH AMERICA BIOPLASTIC PACKAGING MARKET VOLUME AND FORECAST TO 2025 – BY PRODUCT (‘000 TONS) 77
TABLE 7. NORTH AMERICA BIOPLASTIC PACKAGING MARKET REVENUE AND FORECAST TO 2025 – BY TYPE (US$ MN) 78
TABLE 8. NORTH AMERICA BIOPLASTIC PACKAGING MARKET VOLUME AND FORECAST TO 2025 – BY TYPE (‘000 TONS) 78
TABLE 9. NORTH AMERICA BIOPLASTIC PACKAGING MARKET REVENUE AND FORECAST TO 2025 – BY APPLICATION (US$ MN) 79
TABLE 10. NORTH AMERICA BIOPLASTIC PACKAGING MARKET VOLUME AND FORECAST TO 2025 – BY APPLICATION (‘000 TONS) 79
TABLE 11. EUROPE BIOPLASTIC PACKAGING MARKET REVENUE AND FORECAST TO 2025 – BY PRODUCT (US$ MN) 90
TABLE 12. EUROPE BIOPLASTIC PACKAGING MARKET VOLUME AND FORECAST TO 2025 – BY PRODUCT (‘000 TONS) 90
TABLE 13. EUROPE BIOPLASTIC PACKAGING MARKET REVENUE AND FORECAST TO 2025 – BY TYPE (US$ MN) 91
TABLE 14. EUROPE BIOPLASTIC PACKAGING MARKET VOLUME AND FORECAST TO 2025 – BY TYPE (‘000 TONS) 91
TABLE 15. EUROPE BIOPLASTIC PACKAGING MARKET REVENUE AND FORECAST TO 2025 – BY APPLICATION (US$ MN) 92
TABLE 16. EUROPE BIOPLASTIC PACKAGING MARKET VOLUME AND FORECAST TO 2025 – BY APPLICATION (‘000 TONS) 92
TABLE 17. APAC BIOPLASTIC PACKAGING MARKET REVENUE AND FORECAST TO 2025 – BY PRODUCT (US$ MN) 101
TABLE 18. APAC BIOPLASTIC PACKAGING MARKET VOLUME AND FORECAST TO 2025 – BY PRODUCT (‘000 TONS) 101
TABLE 19. APAC BIOPLASTIC PACKAGING MARKET REVENUE AND FORECAST TO 2025 – BY TYPE (US$ MN) 102
TABLE 20. APAC BIOPLASTIC PACKAGING MARKET VOLUME AND FORECAST TO 2025 – BY TYPE (‘000 TONS) 102
TABLE 21. APAC BIOPLASTIC PACKAGING MARKET REVENUE AND FORECAST TO 2025 – BY APPLICATION (US$ MN) 103
TABLE 22. APAC BIOPLASTIC PACKAGING MARKET VOLUME AND FORECAST TO 2025 – BY APPLICATION (‘000 TONS) 103
TABLE 23. MEA BIOPLASTIC PACKAGING MARKET REVENUE AND FORECAST TO 2025 – BY PRODUCT (US$ MN) 111
TABLE 24. MEA BIOPLASTIC PACKAGING MARKET VOLUME AND FORECAST TO 2025 – BY PRODUCT (‘000 TONS) 111
TABLE 25. MEA BIOPLASTIC PACKAGING MARKET REVENUE AND FORECAST TO 2025 – BY TYPE (US$ MN) 112
TABLE 26. MEA BIOPLASTIC PACKAGING MARKET VOLUME AND FORECAST TO 2025 – BY TYPE (‘000 TONS) 112
TABLE 27. MEA BIOPLASTIC PACKAGING MARKET REVENUE AND FORECAST TO 2025 – BY APPLICATION (US$ MN) 113
TABLE 28. MEA BIOPLASTIC PACKAGING MARKET VOLUME AND FORECAST TO 2025 – BY APPLICATION (‘000 TONS) 113
TABLE 29. SAM BIOPLASTIC PACKAGING MARKET REVENUE AND FORECAST TO 2025 – BY PRODUCT (US$ MN) 119
TABLE 30. SAM BIOPLASTIC PACKAGING MARKET VOLUME AND FORECAST TO 2025 – BY PRODUCT (‘000 TONS) 119
TABLE 31. SAM BIOPLASTIC PACKAGING MARKET REVENUE AND FORECAST TO 2025 – BY TYPE (US$ MN) 120
TABLE 32. SAM BIOPLASTIC PACKAGING MARKET VOLUME AND FORECAST TO 2025 – BY TYPE (‘000 TONS) 120
TABLE 33. SAM BIOPLASTIC PACKAGING MARKET REVENUE AND FORECAST TO 2025 – BY APPLICATION (US$ MN) 121
TABLE 34. SAM BIOPLASTIC PACKAGING MARKET VOLUME AND FORECAST TO 2025 – BY APPLICATION (‘000 TONS) 121
TABLE 35. GLOSSARY OF TERM: BIOPLASTIC PACKAGING MARKET 167
LIST OF FIGURES
FIGURE 1. EUROPE MARKET, TOTAL REVENUE (US$ MN), 2017 & 2025 19
FIGURE 2. STARCH BLENDS, GLOBAL REVENUE (US$ MN), 2017 & 2025 20
FIGURE 3. BIOPLASTIC PACKAGING MARKET SEGMENTATION 22
FIGURE 4. BIOPLASTIC PACKAGING MARKET SEGMENTATION - GEOGRAPHY 23
FIGURE 5. NORTH AMERICA – PEST ANALYSIS 25
FIGURE 6. EUROPE – PEST ANALYSIS 27
FIGURE 7. ASIA PACIFIC – PEST ANALYSIS 29
FIGURE 8. MIDDLE EAST AND AFRICA – PEST ANALYSIS 31
FIGURE 9. SOUTH AMERICA – PEST ANALYSIS 33
FIGURE 10. BIOPLASTIC PACKAGING MARKET IMPACT ANALYSIS OF DRIVER AND RESTRAINTS 38
FIGURE 11. GLOBAL BIOPLASTIC PACKAGING MARKET, REVENUE (US$ MN) 39
FIGURE 12. GLOBAL BIOPLASTIC PACKAGING MARKET FORECAST AND ANALYSIS 41
FIGURE 13. GLOBAL BIOPLASTIC PACKAGING MARKET BREAKDOWN, BY PRODUCT, REVENUE 2017 & 2025 (%) 42
FIGURE 14. GLOBAL BIOPLASTIC PACKAGING MARKET BREAKDOWN, BY PRODUCT, VOLUME 2017 & 2025 (%) 43
FIGURE 15. GLOBAL STARCH BLENDS MARKET REVENUE AND FORECAST TO 2025 (US$ MN) 44
FIGURE 16. GLOBAL STARCH BLENDS MARKET VOLUME AND FORECAST TO 2025 (‘000 TONS) 45
FIGURE 17. GLOBAL POLYLACTIC ACID MARKET REVENUE AND FORECAST TO 2025 (US$ MN) 46
FIGURE 18. GLOBAL POLYLACTIC ACID MARKET VOLUME AND FORECAST TO 2025 (‘000 TONS) 46
FIGURE 19. GLOBAL POLYETHYLENE TEREPHTHALATE MARKET REVENUE AND FORECAST TO 2025 (US$ MN) 47
FIGURE 20. GLOBAL POLYETHYLENE TEREPHTHALATE MARKET VOLUME AND FORECAST TO 2025 (‘000 TONS) 48
FIGURE 21. GLOBAL POLYHYDROXYALKANOATES MARKET REVENUE AND FORECAST TO 2025 (US$ MN) 49
FIGURE 22. GLOBAL POLYHYDROXYALKANOATES MARKET VOLUME AND FORECAST TO 2025 (‘000 TONS) 49
FIGURE 23. GLOBAL POLYETHYLENE MARKET REVENUE AND FORECAST TO 2025 (US$ MN) 50
FIGURE 24. GLOBAL POLYETHYLENE MARKET VOLUME AND FORECAST TO 2025 (‘000 TONS) 51
FIGURE 25. GLOBAL OTHERS MARKET REVENUE AND FORECAST TO 2025 (US$ MN) 52
FIGURE 26. GLOBAL OTHERS MARKET VOLUME AND FORECAST TO 2025 (‘000 TONS) 52
FIGURE 27. GLOBAL BIOPLASTIC PACKAGING MARKET BREAKDOWN, BY TYPE, REVENUE 2017 & 2025 (%) 53
FIGURE 28. GLOBAL BIOPLASTIC PACKAGING MARKET BREAKDOWN, BY TYPE, VOLUME 2017 & 2025 (%) 54
FIGURE 29. GLOBAL RIGID PACKAGING MARKET REVENUE AND FORECAST TO 2025 (US$ MN) 55
FIGURE 30. GLOBAL RIGID PACKAGING MARKET VOLUME AND FORECAST TO 2025 (‘000 TONS) 56
FIGURE 31. GLOBAL FLEXIBLE PACKAGING MARKET REVENUE AND FORECAST TO 2025 (US$ MN) 57
FIGURE 32. GLOBAL FLEXIBLE PACKAGING MARKET VOLUME AND FORECAST TO 2025 (‘000 TONS) 57
FIGURE 33. GLOBAL BIOPLASTIC PACKAGING MARKET BREAKDOWN, BY APPLICATION, REVENUE 2017 & 2025 (%) 58
FIGURE 34. GLOBAL BIOPLASTIC PACKAGING MARKET BREAKDOWN, BY APPLICATION, VOLUME 2017 & 2025 (%) 59
FIGURE 35. GLOBAL FOOD & BEVERAGES MARKET REVENUE AND FORECAST TO 2025 (US$ MN) 60
FIGURE 36. GLOBAL FOOD & BEVERAGES MARKET VOLUME AND FORECAST TO 2025 (‘000 TONS) 61
FIGURE 37. GLOBAL CONSUMER GOODS MARKET REVENUE AND FORECAST TO 2025 (US$ MN) 62
FIGURE 38. GLOBAL CONSUMER GOODS MARKET VOLUME AND FORECAST TO 2025 (‘000 TONS) 62
FIGURE 39. GLOBAL COSMETIC & PERSONAL CARE MARKET REVENUE AND FORECAST TO 2025 (US$ MN) 63
FIGURE 40. GLOBAL COSMETIC & PERSONAL CARE MARKET VOLUME AND FORECAST TO 2025 (‘000 TONS) 64
FIGURE 41. GLOBAL PHARMACEUTICALS MARKET REVENUE AND FORECAST TO 2025 (US$ MN) 65
FIGURE 42. GLOBAL PHARMACEUTICALS MARKET VOLUME AND FORECAST TO 2025 (‘000 TONS) 65
FIGURE 43. GLOBAL OTHERS MARKET REVENUE AND FORECAST TO 2025 (US$ MN) 66
FIGURE 44. GLOBAL OTHERS MARKET VOLUME AND FORECAST TO 2025 (‘000 TONS) 67
FIGURE 45. BIOPLASTIC PACKAGING MARKET, GLOBAL BREAKDOWN BY REGIONS, REVENUE 2017 & 2025 (%) 68
FIGURE 46. BIOPLASTIC PACKAGING MARKET, GLOBAL BREAKDOWN BY REGIONS, VOLUME 2017 & 2025 (%) 69
FIGURE 47. NORTH AMERICA BIOPLASTIC PACKAGING MARKET REVENUE AND FORECAST TO 2025 (US$ MN) 70
FIGURE 48. NORTH AMERICA BIOPLASTIC PACKAGING MARKET VOLUME AND FORECAST TO 2025 (‘000 TONS) 71
FIGURE 49. NORTH AMERICA BIOPLASTIC PACKAGING MARKET REVENUE BREAKDOWN BY KEY COUNTRIES, 2017 & 2025(%) 71
FIGURE 50. NORTH AMERICA BIOPLASTIC PACKAGING MARKET VOLUME BREAKDOWN BY KEY COUNTRIES, 2017 & 2025(%) 72
FIGURE 51. U.S. BIOPLASTIC PACKAGING MARKET REVENUE AND FORECAST TO 2025 (US$ MN) 73
FIGURE 52. U.S. BIOPLASTIC PACKAGING MARKET VOLUME AND FORECAST TO 2025 (‘000 MN) 73
FIGURE 53. CANADA BIOPLASTIC PACKAGING MARKET REVENUE AND FORECAST TO 2025 (US$ MN) 74
FIGURE 54. CANADA BIOPLASTIC PACKAGING MARKET VOLUME AND FORECAST TO 2025 (‘000 TONS) 74
FIGURE 55. MEXICO BIOPLASTIC PACKAGING MARKET REVENUE AND FORECAST TO 2025 (US$ MN) 75
FIGURE 56. MEXICO BIOPLASTIC PACKAGING MARKET VOLUME AND FORECAST TO 2025 (‘000 TONS) 76
FIGURE 57. EUROPE BIOPLASTIC PACKAGING MARKET REVENUE AND FORECAST TO 2025 (US$ MN) 80
FIGURE 58. EUROPE BIOPLASTIC PACKAGING MARKET VOLUME AND FORECAST TO 2025 (‘000 TONS) 81
FIGURE 59. EUROPE BIOPLASTIC PACKAGING MARKET BREAKDOWN BY KEY COUNTRIES, REVENUE 2017 & 2025(%) 82
FIGURE 60. EUROPE BIOPLASTIC PACKAGING MARKET BREAKDOWN BY KEY COUNTRIES, VOLUME 2017 & 2025(%) 82
FIGURE 61. FRANCE BIOPLASTIC PACKAGING MARKET REVENUE AND FORECAST TO 2025 (US$ MN) 83
FIGURE 62. FRANCE BIOPLASTIC PACKAGING MARKET VOLUME AND FORECAST TO 2025 (‘000 TONS) 83
FIGURE 63. GERMANY BIOPLASTIC PACKAGING MARKET REVENUE AND FORECAST TO 2025 (US$ MN) 84
FIGURE 64. GERMANY BIOPLASTIC PACKAGING MARKET VOLUME AND FORECAST TO 2025 (‘000 TONS) 84
FIGURE 65. ITALY BIOPLASTIC PACKAGING MARKET REVENUE AND FORECAST TO 2025 (US$ MN) 85
FIGURE 66. ITALY BIOPLASTIC PACKAGING MARKET VOLUME AND FORECAST TO 2025 (‘000 TONS) 85
FIGURE 67. U.K BIOPLASTIC PACKAGING MARKET REVENUE AND FORECAST TO 2025 (US$ MN) 86
FIGURE 68. U.K BIOPLASTIC PACKAGING MARKET VOLUME AND FORECAST TO 2025 (‘000 TONS) 86
FIGURE 69. SPAIN BIOPLASTIC PACKAGING MARKET REVENUE AND FORECAST TO 2025 (US$ MN) 87
FIGURE 70. SPAIN BIOPLASTIC PACKAGING MARKET VOLUME AND FORECAST TO 2025 (‘000 TONS) 87
FIGURE 71. REST OF EUROPE BIOPLASTIC PACKAGING MARKET REVENUE AND FORECAST TO 2025 (US$ MN) 88
FIGURE 72. REST OF EUROPE BIOPLASTIC PACKAGING MARKET VOLUME AND FORECAST TO 2025 (‘000 TONS) 89
FIGURE 73. APAC BIOPLASTIC PACKAGING MARKET REVENUE AND FORECAST TO 2025 (US$ MN) 94
FIGURE 74. APAC BIOPLASTIC PACKAGING MARKET VOLUME AND FORECAST TO 2025 (‘000 TONS) 94
FIGURE 75. APAC BIOPLASTIC PACKAGING MARKET BREAKDOWN BY KEY COUNTRIES, REVENUE 2017 & 2025(%) 95
FIGURE 76. APAC BIOPLASTIC PACKAGING MARKET BREAKDOWN BY KEY COUNTRIES, VOLUME 2017 & 2025(%) 95
FIGURE 77. AUSTRALIA BIOPLASTIC PACKAGING MARKET REVENUE AND FORECAST TO 2025 (US$ MN) 96
FIGURE 78. AUSTRALIA BIOPLASTIC PACKAGING MARKET VOLUME AND FORECAST TO 2025 (‘000 TONS) 96
FIGURE 79. CHINA BIOPLASTIC PACKAGING MARKET REVENUE AND FORECAST TO 2025 (US$ MN) 97
FIGURE 80. CHINA BIOPLASTIC PACKAGING MARKET VOLUME AND FORECAST TO 2025 (‘000 TONS) 97
FIGURE 81. INDIA BIOPLASTIC PACKAGING MARKET REVENUE AND FORECAST TO 2025 (US$ MN) 98
FIGURE 82. INDIA BIOPLASTIC PACKAGING MARKET VOLUME AND FORECAST TO 2025 (‘000 TONS) 98
FIGURE 83. JAPAN BIOPLASTIC PACKAGING MARKET REVENUE AND FORECAST TO 2025 (US$ MN) 99
FIGURE 84. JAPAN BIOPLASTIC PACKAGING MARKET VOLUME AND FORECAST TO 2025 (‘000 TONS) 99
FIGURE 85. REST OF APAC BIOPLASTIC PACKAGING MARKET REVENUE AND FORECAST TO 2025 (US$ MN) 100
FIGURE 86. REST OF APAC BIOPLASTIC PACKAGING MARKET VOLUME AND FORECAST TO 2025 (‘000 TONS) 100
FIGURE 87. MEA BIOPLASTIC PACKAGING MARKET REVENUE AND FORECAST TO 2025 (US$ MN) 104
FIGURE 88. MEA BIOPLASTIC PACKAGING MARKET VOLUME AND FORECAST TO 2025 (‘000 TONS) 105
FIGURE 89. MEA BIOPLASTIC PACKAGING MARKET BREAKDOWN BY KEY COUNTRIES, REVENUE 2017 & 2025(%) 106
FIGURE 90. MEA BIOPLASTIC PACKAGING MARKET BREAKDOWN BY KEY COUNTRIES, VOLUME 2017 & 2025(%) 106
FIGURE 91. SAUDI ARABIA BIOPLASTIC PACKAGING MARKET REVENUE AND FORECAST TO 2025 (US$ MN) 107
FIGURE 92. SAUDI ARABIA BIOPLASTIC PACKAGING MARKET VOLUME AND FORECAST TO 2025 (‘000 TONS) 107
FIGURE 93. UAE BIOPLASTIC PACKAGING MARKET REVENUE AND FORECAST TO 2025 (US$ MN) 108
FIGURE 94. UAE BIOPLASTIC PACKAGING MARKET VOLUME AND FORECAST TO 2025 (‘000 TONS) 108
FIGURE 95. SOUTH AFRICA BIOPLASTIC PACKAGING MARKET REVENUE AND FORECAST TO 2025 (US$ MN) 109
FIGURE 96. SOUTH AFRICA BIOPLASTIC PACKAGING MARKET VOLUME AND FORECAST TO 2025 (‘000 TONS) 109
FIGURE 97. REST OF MEA BIOPLASTIC PACKAGING MARKET REVENUE AND FORECAST TO 2025 (US$ MN) 110
FIGURE 98. REST OF MEA BIOPLASTIC PACKAGING MARKET VOLUME AND FORECAST TO 2025 (‘000 TONS) 110
FIGURE 99. SAM BIOPLASTIC PACKAGING MARKET REVENUE AND FORECAST TO 2025 (US$ MN) 114
FIGURE 100. SAM BIOPLASTIC PACKAGING MARKET VOLUME AND FORECAST TO 2025 (‘000 TONS) 115
FIGURE 101. SAM BIOPLASTIC PACKAGING MARKET BREAKDOWN BY KEY COUNTRIES, REVENUE 2017 & 2025(%) 115
FIGURE 102. SAM BIOPLASTIC PACKAGING MARKET BREAKDOWN BY KEY COUNTRIES, VOLUME 2017 & 2025(%) 116
FIGURE 103. BRAZIL BIOPLASTIC PACKAGING MARKET REVENUE AND FORECAST TO 2025 (US$ MN) 117
FIGURE 104. BRAZIL BIOPLASTIC PACKAGING MARKET VOLUME AND FORECAST TO 2025 (‘000 TONS) 117
FIGURE 105. REST OF SAM BIOPLASTIC PACKAGING MARKET REVENUE AND FORECAST TO 2025 (US$ MN) 118
FIGURE 106. REST OF SAM BIOPLASTIC PACKAGING MARKET VOLUME AND FORECAST TO 2025 (‘000 TONS) 118
The List of Companies
- NatureWorks LLC
- Arkema
- Novamont S.p.A.
- BASF SE
- Braskem
- Corbion N.V.
- Cardia Bioplastic Packaging
- Evonik Industries AG
- Koninklijke DSM N.V.
- Dow Chemical Company
The Insight Partners performs research in 4 major stages: Data Collection & Secondary Research, Primary Research, Data Analysis and Data Triangulation & Final Review.
- Data Collection and Secondary Research:
As a market research and consulting firm operating from a decade, we have published many reports and advised several clients across the globe. First step for any study will start with an assessment of currently available data and insights from existing reports. Further, historical and current market information is collected from Investor Presentations, Annual Reports, SEC Filings, etc., and other information related to company’s performance and market positioning are gathered from Paid Databases (Factiva, Hoovers, and Reuters) and various other publications available in public domain.
Several associations trade associates, technical forums, institutes, societies and organizations are accessed to gain technical as well as market related insights through their publications such as research papers, blogs and press releases related to the studies are referred to get cues about the market. Further, white papers, journals, magazines, and other news articles published in the last 3 years are scrutinized and analyzed to understand the current market trends.
- Primary Research:
The primarily interview analysis comprise of data obtained from industry participants interview and answers to survey questions gathered by in-house primary team.
For primary research, interviews are conducted with industry experts/CEOs/Marketing Managers/Sales Managers/VPs/Subject Matter Experts from both demand and supply side to get a 360-degree view of the market. The primary team conducts several interviews based on the complexity of the markets to understand the various market trends and dynamics which makes research more credible and precise.
A typical research interview fulfils the following functions:
- Provides first-hand information on the market size, market trends, growth trends, competitive landscape, and outlook
- Validates and strengthens in-house secondary research findings
- Develops the analysis team’s expertise and market understanding
Primary research involves email interactions and telephone interviews for each market, category, segment, and sub-segment across geographies. The participants who typically take part in such a process include, but are not limited to:
- Industry participants: VPs, business development managers, market intelligence managers and national sales managers
- Outside experts: Valuation experts, research analysts and key opinion leaders specializing in the electronics and semiconductor industry.
Below is the breakup of our primary respondents by company, designation, and region:

Once we receive the confirmation from primary research sources or primary respondents, we finalize the base year market estimation and forecast the data as per the macroeconomic and microeconomic factors assessed during data collection.
- Data Analysis:
Once data is validated through both secondary as well as primary respondents, we finalize the market estimations by hypothesis formulation and factor analysis at regional and country level.
- 3.1 Macro-Economic Factor Analysis:
We analyse macroeconomic indicators such the gross domestic product (GDP), increase in the demand for goods and services across industries, technological advancement, regional economic growth, governmental policies, the influence of COVID-19, PEST analysis, and other aspects. This analysis aids in setting benchmarks for various nations/regions and approximating market splits. Additionally, the general trend of the aforementioned components aid in determining the market's development possibilities.
- 3.2 Country Level Data:
Various factors that are especially aligned to the country are taken into account to determine the market size for a certain area and country, including the presence of vendors, such as headquarters and offices, the country's GDP, demand patterns, and industry growth. To comprehend the market dynamics for the nation, a number of growth variables, inhibitors, application areas, and current market trends are researched. The aforementioned elements aid in determining the country's overall market's growth potential.
- 3.3 Company Profile:
The “Table of Contents” is formulated by listing and analyzing more than 25 - 30 companies operating in the market ecosystem across geographies. However, we profile only 10 companies as a standard practice in our syndicate reports. These 10 companies comprise leading, emerging, and regional players. Nonetheless, our analysis is not restricted to the 10 listed companies, we also analyze other companies present in the market to develop a holistic view and understand the prevailing trends. The “Company Profiles” section in the report covers key facts, business description, products & services, financial information, SWOT analysis, and key developments. The financial information presented is extracted from the annual reports and official documents of the publicly listed companies. Upon collecting the information for the sections of respective companies, we verify them via various primary sources and then compile the data in respective company profiles. The company level information helps us in deriving the base number as well as in forecasting the market size.
- 3.4 Developing Base Number:
Aggregation of sales statistics (2020-2022) and macro-economic factor, and other secondary and primary research insights are utilized to arrive at base number and related market shares for 2022. The data gaps are identified in this step and relevant market data is analyzed, collected from paid primary interviews or databases. On finalizing the base year market size, forecasts are developed on the basis of macro-economic, industry and market growth factors and company level analysis.
- Data Triangulation and Final Review:
The market findings and base year market size calculations are validated from supply as well as demand side. Demand side validations are based on macro-economic factor analysis and benchmarks for respective regions and countries. In case of supply side validations, revenues of major companies are estimated (in case not available) based on industry benchmark, approximate number of employees, product portfolio, and primary interviews revenues are gathered. Further revenue from target product/service segment is assessed to avoid overshooting of market statistics. In case of heavy deviations between supply and demand side values, all thes steps are repeated to achieve synchronization.
We follow an iterative model, wherein we share our research findings with Subject Matter Experts (SME’s) and Key Opinion Leaders (KOLs) until consensus view of the market is not formulated – this model negates any drastic deviation in the opinions of experts. Only validated and universally acceptable research findings are quoted in our reports.
We have important check points that we use to validate our research findings – which we call – data triangulation, where we validate the information, we generate from secondary sources with primary interviews and then we re-validate with our internal data bases and Subject matter experts. This comprehensive model enables us to deliver high quality, reliable data in shortest possible time.
 Get Free Sample For