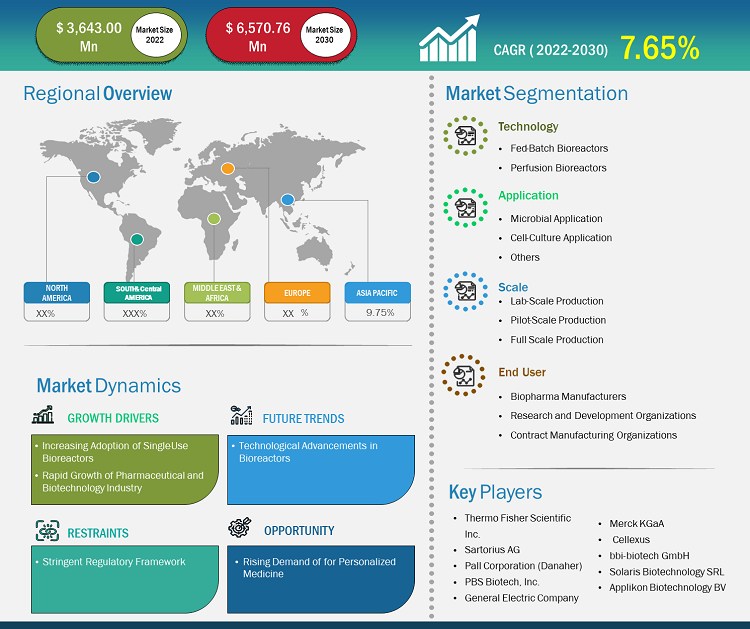
The bioreactors market size is projected to reach US$ 6,570.76 million by 2030 from US$ 3,643.00 million in 2022. The market is expected to register a CAGR of 7.65% during 2022–2031. Technological advancements in bioreactors are likely to remain a key trend in the market.
Bioreactors Market Analysis
Numerous cell types, such as mammalian cell lines, stem cells, and insect cells, can be grown on a large scale in bioreactors. Numerous uses for cell culture in bioreactors exist, such as the development of gene and cell therapies as well as the manufacture of vaccines, viral vectors, and antibodies. When establishing these bioprocesses, there are numerous things to take into account, such as optimizing crucial process variables, selecting the best feeding plan, and guaranteeing bioprocess scalability. The increasing adoption of single-use bioreactors and the rapid growth of the pharmaceutical and biotechnology industry are the key driving factors behind the market development.
Bioreactors Market Overview
The pharmaceutical sector has expanded at a rate never seen before in recent years. Large pharmaceutical corporations and contract research organizations, or CROs, are developing novel therapeutics and medications to address a broad spectrum of conditions. The market for biopharmaceuticals is expanding. The high demand for biologics and biosimilars has fueled the industry's rapid expansion. One of the biggest drivers of the economy is the biopharmaceutical sector. The United States leads the world in biopharmaceutical R&D and is the largest market for these products. The US holds the most significant number of patents for novel medications and conducts more than half of global pharmaceutical R&D (worth US$ 75 billion), according to the Pharmaceutical Research and Manufacturers Association (PhRMA). In addition to expanding economies, rising economies like Brazil, China, and India are experiencing fast expansion in their research environments. The sector is expanding due to factors like growing approvals for biologics, a growing pipeline for biosimilars, and more investment in research and development.
Customize Research To Suit Your Requirement
We can optimize and tailor the analysis and scope which is unmet through our standard offerings. This flexibility will help you gain the exact information needed for your business planning and decision making.
Bioreactors Market: Strategic Insights
Market Size Value in US$ 3,643.00 million in 2022 Market Size Value by US$ 6,570.76 million by 2030 Growth rate CAGR of 7.65% from 2022 to 2030 Forecast Period 2022-2030 Base Year 2022

Mrinal
Have a question?
Mrinal will walk you through a 15-minute call to present the report’s content and answer all queries if you have any.
 Speak to Analyst
Customize Research To Suit Your Requirement
We can optimize and tailor the analysis and scope which is unmet through our standard offerings. This flexibility will help you gain the exact information needed for your business planning and decision making.
Bioreactors Market: Strategic Insights
| Market Size Value in | US$ 3,643.00 million in 2022 |
| Market Size Value by | US$ 6,570.76 million by 2030 |
| Growth rate | CAGR of 7.65% from 2022 to 2030 |
| Forecast Period | 2022-2030 |
| Base Year | 2022 |
Mrinal
Have a question?
Mrinal will walk you through a 15-minute call to present the report’s content and answer all queries if you have any.
Speak to Analyst
Bioreactors Market Drivers and Opportunities
Emerging Use of Single-use Bioreactors Favors the Market Growth
Single-use bioreactors shorten production turnaround times and lower the chance of contamination. Single-use bioreactors have become more common in contemporary biopharmaceutical processes in recent years due to their exceptional capacity to improve flexibility, lower investment, and control operating costs. Additionally, a lot of businesses have created single-use bioreactors that can produce a variety of medicines. Thermo Fischer Scientific, for example, introduced the 3,000 L and 5,000 L HvPerforma DvnaDrive single-use bioreactors in March 2021. One significant advantage of single-use bioreactors has been the reduction of validation time. The market is expanding due to the increasing use of single-use bioreactors for upstream bioprocessing. Sartorius AG provides a variety of single-use bioreactors, for example. The business offers Biostat STR for 50-2000L and Ambr 15 for micro bioreactors with a capacity of 10-15 mL. The growing acceptability of single-use bioreactors for the manufacturing of medicines is driving the market for bioreactors.
Rising Demand for Personalized Medicine
With precision medicine, a patient's genetic information is used to provide customized care for a specific condition. The need for biologics, medications for orphan diseases, and customized treatments has surged due to the growing incidence of several chronic illnesses. For example, the National Human Genome Research Institute (NHGRI) announced in February 2020 that it was going to launch a new program focused on genomics and precision medicine. The innovative use of genomics and informatics tools for improved disease diagnosis and treatment is the main focus of this program. It is projected that during the forecast period, the players in the bioreactors market will have substantial growth opportunities due to the increasing demand for personalized medicine.
Bioreactors Market Report Segmentation Analysis
Key segments that contributed to the derivation of the bioreactors market analysis are scale, application, technology, and end user.
- Based on scale, the bioreactors market is divided into lab-scale production, pilot-scale production, and full-scale production. The lab-scale production segment held the most significant market share in 2022.
- By application, the market is categorized into microbial application, cell culture application, and others. The cell culture application segment held the largest share of the market in 2022.
- Based on technology, the bioreactors market is divided into fed-batch bioreactors and perfusion bioreactors. The fed-batch bioreactors segment held the most significant market share in 2022.
- By end user, the market is segmented into biopharma manufacturers, research and development organizations, and contract manufacturing organizations. The research and development organizations segment held the largest share of the market in 2022.
Bioreactors Market Share Analysis by Geography
The geographic scope of the bioreactors market report is mainly divided into five regions: North America, Asia Pacific, Europe, Middle East & Africa, and South & Central America.
The US, Canada, and Mexico make up the three segments of the North American bioreactor market. The biopharmaceutical and biotechnology industries' growing need for bioreactor systems, the existence of market participants, and the expansion of R&D by numerous academic and research institutions are all factors contributing to the growth of the bioreactor systems market in North America. Furthermore, the bioreactors market in North America is anticipated to grow as a result of increased research being conducted by pharmaceutical and biotechnology companies. The Canadian market is strengthened by the abundance of pharmaceutical companies that sell their goods internationally. For example, businesses in British Columbia, Saskatchewan, Alberta, Manitoba, Ontario, and Quebec include Amgen, Xenon Pharmaceuticals, Zymeworks, Gilead Sciences, Abbott, Alphora Research, Amgen, Apotex, Astellas, Merck, AbbVie, Bristol-Myers Squibb, Caprion Biosciences, Charles River Laboratories, GlaxoSmithKline, Pharma, AstraZeneca, Baxter, Bayer, and Cipher Pharmaceuticals. The market has grown as a result of Canada's biopharmaceutical industry's notable expansion. Furthermore, large-scale research and development (R&D) endeavors by pharmaceutical companies via collaborations lead to supplementary investments in venture funds and small and medium-sized businesses (SMEs). The scope of the pharmaceutical sector market in Canada is further expanded by the increasing number of contract research organizations and contract manufacturing organizations (CROs and CMOs) that serve both domestic and foreign clients.
Bioreactors Market Report Scope
Bioreactors Market News and Recent Developments
The bioreactors market is evaluated by gathering qualitative and quantitative data post primary and secondary research, which includes important corporate publications, association data, and databases. A few of the developments in the bioreactors market are listed below:
- Getinge is extending its bioreactor offering by introducing the Single-Use Production Reactor (SUPR) system, which initially is available in 50-liter and 250-liter sizes. Based on the same proven platform as Getinge’s smaller bioreactors, the SUPR system helps operators to bring life-saving medicines faster to market, aiming to improve people’s quality of life. (Source: Getinge, Press Release, 2024)
- Global technology and software leader Emerson has collaborated with Sartorius, a leading international biopharmaceutical company, to natively integrate Sartorius’s Biostat STR Generation 3 family of bioreactors with Emerson’s DeltaV distributed control system (DCS). The Biostat STR Generation 3 for Emerson’s DeltaV, a variant of the Biostat STR Generation 3 family, is a pre-engineered solution that delivers intuitive connectivity for accelerating and simplifying the process of bringing therapies that improve patient quality-of-life to market. (Source: Emerson Electric Co., Press Release, 2023)
Bioreactors Market Report Coverage and Deliverables
The “Bioreactors Market Size and Forecast (2020–2030)” report provides a detailed analysis of the market covering below areas:
- Bioreactors market size and forecast at global, regional, and country levels for all the key market segments covered under the scope
- Bioreactors market trends as well as market dynamics such as drivers, restraints, and key opportunities
- Detailed PEST/Porter’s Five Forces and SWOT analysis
- Bioreactors market analysis covering key market trends, global and regional framework, major players, regulations, and recent market developments.
- Industry landscape and competition analysis covering market concentration, heat map analysis, prominent players, and recent developments for the bioreactors market
- Detailed company profiles

Report Coverage
Revenue forecast, Company Analysis, Industry landscape, Growth factors, and Trends

Segment Covered
Scale, Application, Technology, End User, and Geography

Regional Scope
North America, Europe, Asia Pacific, Middle East & Africa, South & Central America

Country Scope
This text is related
to country scope.
Frequently Asked Questions
Technological advancements in bioreactors are likely to remain a key trend in the market.
North America dominated the bioreactors market in 2022
Sartorius AG, PBS Biotech, Merck KGaA, Cellexus International Ltd, General Electric Co, Thermo Fisher Scientific Inc, bbi-biotech GmbH, Pall Corp, Applikon Biotechnology BV, and Solaris Biotechnology SRL
Key factors driving the market are the emerging use of single-use bioreactors and the rapid growth of the pharmaceutical and biotechnology industry.
The market is expected to register a CAGR of 7.65% during 2022–2030.
1. Introduction
1.1 The Insight Partners Research Report Guidance
1.2 Market Segmentation
2. Executive Summary
2.1 Key Insights
2.2 Bioreactors Market, by Geography (US$ Million)
3. Research Methodology
3.1 Coverage
3.2 Secondary Research
3.3 Primary Research
4. Bioreactors Market Landscape
4.1 Overview
4.2 PEST Analysis
4.2.1 Global PEST Analysis
5. Bioreactors Market - Key Industry Dynamics
5.1 Bioreactors Market - Key Industry Dynamics
5.2 Market Drivers
5.2.1 Increasing Adoption of Single-Use Bioreactors
5.2.2 Rapid Growth of Pharmaceutical and Biotechnology Industry
5.3 Market Restraints
5.3.1 Stringent Regulatory Framework
5.4 Market Opportunities
5.4.1 Rising Demand for Personalized Medicine
5.5 Future Trends
5.5.1 Technological Advancements in Bioreactors
5.6 Impact of Drivers and Restraints:
6. Bioreactors Market - Global Market Analysis
6.1 Bioreactors Market Revenue (US$ Million), 2022 – 2030
7. Bioreactors Market Analysis - Scale
7.1 Overview
7.2 Bioreactors Market Revenue Share, by Scale 2022 & 2030 (%)
7.3 Lab-Scale Production
7.3.1 Overview
7.3.2 Lab-Scale Production Market, Revenue and Forecast to 2030 (US$ Million)
7.4 Pilot-Scale Production
7.4.1 Overview
7.4.2 Pilot-Scale Production Market, Revenue and Forecast to 2030 (US$ Million)
7.5 Full-Scale Production
7.5.1 Overview
7.5.2 Full-Scale Production Market, Revenue and Forecast to 2030 (US$ Million)
8. Bioreactors Market Analysis - Application
8.1 Overview
8.2 Bioreactors Market Revenue Share, by Application 2022 & 2030 (%)
8.3 Microbial Application
8.3.1 Overview
8.3.2 Microbial Application Market, Revenue and Forecast to 2030 (US$ Million)
8.4 Cell Culture Application
8.4.1 Overview
8.4.2 Cell Culture Application Market, Revenue and Forecast to 2030 (US$ Million)
8.5 Others
8.5.1 Overview
8.5.2 Others Market, Revenue and Forecast to 2030 (US$ Million)
9. Bioreactors Market Analysis - Technology
9.1 Overview
9.2 Bioreactors Market Revenue Share, by Technology 2022 & 2030 (%)
9.3 Fed-Batch Bioreactors
9.3.1 Overview
9.3.2 Fed-Batch Bioreactors Market, Revenue and Forecast to 2030 (US$ Million)
9.4 Perfusion Bioreactors
9.4.1 Overview
9.4.2 Perfusion Bioreactors Market, Revenue and Forecast to 2030 (US$ Million)
10. Bioreactors Market Analysis - End User
10.1 Overview
10.2 Bioreactors Market Revenue Share, by End User 2022 & 2030 (%)
10.3 Biopharma Manufacturers
10.3.1 Overview
10.3.2 Biopharma Manufacturers Market, Revenue and Forecast to 2030 (US$ Million)
10.4 Research and Development Organizations
10.4.1 Overview
10.4.2 Research and Development Organizations Market, Revenue and Forecast to 2030 (US$ Million)
10.5 Contract Manufacturing Organization
10.5.1 Overview
10.5.2 Contract Manufacturing Organization Market, Revenue and Forecast to 2030 (US$ Million)
11. Bioreactors Market - Geographical Analysis
11.1 North America: Bioreactors Market
11.1.1 Overview
11.1.2 North America Bioreactors Market Revenue and Forecasts to 2030 (US$ Mn)
11.1.2.1 North America Bioreactors Market Revenue and Forecasts and Analysis - By Scale
11.1.2.2 North America Bioreactors Market Revenue and Forecasts and Analysis - By Application
11.1.2.3 North America Bioreactors Market Revenue and Forecasts and Analysis - By Technology
11.1.2.4 North America Bioreactors Market Revenue and Forecasts and Analysis - By End User
11.1.3 North America Bioreactors Market Revenue and Forecasts and Analysis - By Country
11.1.3.1 US: Bioreactors Market – Revenue and Forecast to 2030 (USD Million)
11.1.3.2 US: Bioreactors Market – Revenue and Forecast to 2030 (US$ Million)
11.1.3.2.1 United States Bioreactors Market Breakdown by Scale
11.1.3.2.2 United States Bioreactors Market Breakdown by Application
11.1.3.2.3 United States Bioreactors Market Breakdown by Technology
11.1.3.2.4 United States Bioreactors Market Breakdown by End User
11.1.3.3 Canada: Bioreactors Market – Revenue and Forecast to 2030 (USD Million)
11.1.3.4 Canada: Bioreactors Market – Revenue and Forecast to 2030 (US$ Million)
11.1.3.4.1 Canada Bioreactors Market Breakdown by Scale
11.1.3.4.2 Canada Bioreactors Market Breakdown by Application
11.1.3.4.3 Canada Bioreactors Market Breakdown by Technology
11.1.3.4.4 Canada Bioreactors Market Breakdown by End User
11.1.3.5 Mexico: Bioreactors Market – Revenue and Forecast to 2030 (USD Million)
11.1.3.6 Mexico: Bioreactors Market – Revenue and Forecast to 2030 (US$ Million)
11.1.3.6.1 Mexico Bioreactors Market Breakdown by Scale
11.1.3.6.2 Mexico Bioreactors Market Breakdown by Application
11.1.3.6.3 Mexico Bioreactors Market Breakdown by Technology
11.1.3.6.4 Mexico Bioreactors Market Breakdown by End User
11.2 Europe: Bioreactors Market
11.2.1 Overview
11.2.2 Europe Bioreactors Market Revenue and Forecasts to 2030 (US$ Mn)
11.2.2.1 Europe Bioreactors Market Revenue and Forecasts and Analysis - By Scale
11.2.2.2 Europe Bioreactors Market Revenue and Forecasts and Analysis - By Application
11.2.2.3 Europe Bioreactors Market Revenue and Forecasts and Analysis - By Technology
11.2.2.4 Europe Bioreactors Market Revenue and Forecasts and Analysis - By End User
11.2.3 Europe Bioreactors Market Revenue and Forecasts and Analysis - By Country
11.2.3.1 Germany: Bioreactors Market – Revenue and Forecast to 2030 (USD Million)
11.2.3.2 Germany: Bioreactors Market – Revenue and Forecast to 2030 (US$ Million)
11.2.3.2.1 Germany Bioreactors Market Breakdown by Scale
11.2.3.2.2 Germany Bioreactors Market Breakdown by Application
11.2.3.2.3 Germany Bioreactors Market Breakdown by Technology
11.2.3.2.4 Germany Bioreactors Market Breakdown by End User
11.2.3.3 France: Bioreactors Market – Revenue and Forecast to 2030 (USD Million)
11.2.3.4 France: Bioreactors Market – Revenue and Forecast to 2030 (US$ Million)
11.2.3.4.1 France Bioreactors Market Breakdown by Scale
11.2.3.4.2 France Bioreactors Market Breakdown by Application
11.2.3.4.3 France Bioreactors Market Breakdown by Technology
11.2.3.4.4 France Bioreactors Market Breakdown by End User
11.2.3.5 UK: Bioreactors Market – Revenue and Forecast to 2030 (USD Million)
11.2.3.6 UK: Bioreactors Market – Revenue and Forecast to 2030 (US$ Million)
11.2.3.6.1 UK Bioreactors Market Breakdown by Scale
11.2.3.6.2 UK Bioreactors Market Breakdown by Application
11.2.3.6.3 UK Bioreactors Market Breakdown by Technology
11.2.3.6.4 UK Bioreactors Market Breakdown by End User
11.2.3.7 Italy: Bioreactors Market – Revenue and Forecast to 2030 (USD Million)
11.2.3.8 Italy: Bioreactors Market – Revenue and Forecast to 2030 (US$ Million)
11.2.3.8.1 Italy Bioreactors Market Breakdown by Scale
11.2.3.8.2 Italy Bioreactors Market Breakdown by Application
11.2.3.8.3 Italy Bioreactors Market Breakdown by Technology
11.2.3.8.4 Italy Bioreactors Market Breakdown by End User
11.2.3.9 Spain: Bioreactors Market – Revenue and Forecast to 2030 (USD Million)
11.2.3.10 Spain: Bioreactors Market – Revenue and Forecast to 2030 (US$ Million)
11.2.3.10.1 Spain Bioreactors Market Breakdown by Scale
11.2.3.10.2 Spain Bioreactors Market Breakdown by Application
11.2.3.10.3 Spain Bioreactors Market Breakdown by Technology
11.2.3.10.4 Spain Bioreactors Market Breakdown by End User
11.2.3.11 Rest of Europe: Bioreactors Market – Revenue and Forecast to 2030 (USD Million)
11.2.3.12 Rest of Europe: Bioreactors Market – Revenue and Forecast to 2030 (US$ Million)
11.2.3.12.1 Rest of Europe Bioreactors Market Breakdown by Scale
11.2.3.12.2 Rest of Europe Bioreactors Market Breakdown by Application
11.2.3.12.3 Rest of Europe Bioreactors Market Breakdown by Technology
11.2.3.12.4 Rest of Europe Bioreactors Market Breakdown by End User
11.3 Asia Pacific: Bioreactors Market
11.3.1 Overview
11.3.2 Asia Pacific Bioreactors Market Revenue and Forecasts to 2030 (US$ Mn)
11.3.2.1 Asia Pacific Bioreactors Market Revenue and Forecasts and Analysis - By Scale
11.3.2.2 Asia Pacific Bioreactors Market Revenue and Forecasts and Analysis - By Application
11.3.2.3 Asia Pacific Bioreactors Market Revenue and Forecasts and Analysis - By Technology
11.3.2.4 Asia Pacific Bioreactors Market Revenue and Forecasts and Analysis - By End User
11.3.3 Asia Pacific Bioreactors Market Revenue and Forecasts and Analysis - By Country
11.3.3.1 China: Bioreactors Market – Revenue and Forecast to 2030 (USD Million)
11.3.3.2 China: Bioreactors Market – Revenue and Forecast to 2030 (US$ Million)
11.3.3.2.1 China Bioreactors Market Breakdown by Scale
11.3.3.2.2 China Bioreactors Market Breakdown by Application
11.3.3.2.3 China Bioreactors Market Breakdown by Technology
11.3.3.2.4 China Bioreactors Market Breakdown by End User
11.3.3.3 Japan: Bioreactors Market – Revenue and Forecast to 2030 (USD Million)
11.3.3.4 Japan: Bioreactors Market – Revenue and Forecast to 2030 (US$ Million)
11.3.3.4.1 Japan Bioreactors Market Breakdown by Scale
11.3.3.4.2 Japan Bioreactors Market Breakdown by Application
11.3.3.4.3 Japan Bioreactors Market Breakdown by Technology
11.3.3.4.4 Japan Bioreactors Market Breakdown by End User
11.3.3.5 India: Bioreactors Market – Revenue and Forecast to 2030 (USD Million)
11.3.3.6 India: Bioreactors Market – Revenue and Forecast to 2030 (US$ Million)
11.3.3.6.1 India Bioreactors Market Breakdown by Scale
11.3.3.6.2 India Bioreactors Market Breakdown by Application
11.3.3.6.3 India Bioreactors Market Breakdown by Technology
11.3.3.6.4 India Bioreactors Market Breakdown by End User
11.3.3.7 Australia: Bioreactors Market – Revenue and Forecast to 2030 (USD Million)
11.3.3.8 Australia: Bioreactors Market – Revenue and Forecast to 2030 (US$ Million)
11.3.3.8.1 Australia Bioreactors Market Breakdown by Scale
11.3.3.8.2 Australia Bioreactors Market Breakdown by Application
11.3.3.8.3 Australia Bioreactors Market Breakdown by Technology
11.3.3.8.4 Australia Bioreactors Market Breakdown by End User
11.3.3.9 South Korea: Bioreactors Market – Revenue and Forecast to 2030 (USD Million)
11.3.3.10 South Korea: Bioreactors Market – Revenue and Forecast to 2030 (US$ Million)
11.3.3.10.1 South Korea Bioreactors Market Breakdown by Scale
11.3.3.10.2 South Korea Bioreactors Market Breakdown by Application
11.3.3.10.3 South Korea Bioreactors Market Breakdown by Technology
11.3.3.10.4 South Korea Bioreactors Market Breakdown by End User
11.3.3.11 Rest of APAC: Bioreactors Market – Revenue and Forecast to 2030 (USD Million)
11.3.3.12 Rest of APAC: Bioreactors Market – Revenue and Forecast to 2030 (US$ Million)
11.3.3.12.1 Rest of APAC Bioreactors Market Breakdown by Scale
11.3.3.12.2 Rest of APAC Bioreactors Market Breakdown by Application
11.3.3.12.3 Rest of APAC Bioreactors Market Breakdown by Technology
11.3.3.12.4 Rest of APAC Bioreactors Market Breakdown by End User
11.4 Middle East & Africa Bioreactors Market
11.4.1 Overview
11.4.2 Middle East & Africa Bioreactors Market Revenue and Forecasts to 2030 (US$ Mn)
11.4.2.1 Middle East & Africa Bioreactors Market Revenue and Forecasts and Analysis - By Scale
11.4.2.2 Middle East & Africa Bioreactors Market Revenue and Forecasts and Analysis - By Application
11.4.2.3 Middle East & Africa Bioreactors Market Revenue and Forecasts and Analysis - By Technology
11.4.2.4 Middle East & Africa Bioreactors Market Revenue and Forecasts and Analysis - By End User
11.4.3 Middle East & Africa Bioreactors Market Revenue and Forecasts and Analysis - By Country
11.4.3.1 Saudi Arabia: Bioreactors Market – Revenue and Forecast to 2030 (USD Million)
11.4.3.2 Saudi Arabia: Bioreactors Market – Revenue and Forecast to 2030 (US$ Million)
11.4.3.3 Saudi Arabia Bioreactors Market Revenue and Forecasts to 2030 (US$ Mn)
11.4.3.3.1 Saudi Arabia Bioreactors Market Breakdown by Scale
11.4.3.3.2 Saudi Arabia Bioreactors Market Breakdown by Application
11.4.3.3.3 Saudi Arabia Bioreactors Market Breakdown by Technology
11.4.3.3.4 Saudi Arabia Bioreactors Market Breakdown by End User
11.4.3.4 South Africa: Bioreactors Market – Revenue and Forecast to 2030 (USD Million)
11.4.3.5 South Africa: Bioreactors Market – Revenue and Forecast to 2030 (US$ Million)
11.4.3.5.1 South Africa Bioreactors Market Breakdown by Scale
11.4.3.5.2 South Africa Bioreactors Market Breakdown by Application
11.4.3.5.3 South Africa Bioreactors Market Breakdown by Technology
11.4.3.5.4 South Africa Bioreactors Market Breakdown by End User
11.4.3.6 United Arab Emirates: Bioreactors Market – Revenue and Forecast to 2030 (USD Million)
11.4.3.7 United Arab Emirates: Bioreactors Market – Revenue and Forecast to 2030 (US$ Million)
11.4.3.7.1 United Arab Emirates Bioreactors Market Breakdown by Scale
11.4.3.7.2 United Arab Emirates Bioreactors Market Breakdown by Application
11.4.3.7.3 United Arab Emirates Bioreactors Market Breakdown by Technology
11.4.3.7.4 United Arab Emirates Bioreactors Market Breakdown by End User
11.4.3.8 Rest of Middle East & Africa: Bioreactors Market – Revenue and Forecast to 2030 (USD Million)
11.4.3.9 Rest of Middle East & Africa: Bioreactors Market – Revenue and Forecast to 2030 (US$ Million)
11.4.3.9.1 Rest of Middle East & Africa Bioreactors Market Breakdown by Scale
11.4.3.9.2 Rest of Middle East & Africa Bioreactors Market Breakdown by Application
11.4.3.9.3 Rest of Middle East & Africa Bioreactors Market Breakdown by Technology
11.4.3.9.4 Rest of Middle East & Africa Bioreactors Market Breakdown by End User
11.5 South & Central America: Bioreactors Market
11.5.1 Overview
11.5.2 South & Central America Bioreactors Market Revenue and Forecasts to 2030 (US$ Mn)
11.5.2.1 South & Central America Bioreactors Market Revenue and Forecasts and Analysis - By Scale
11.5.2.2 South & Central America Bioreactors Market Revenue and Forecasts and Analysis - By Application
11.5.2.3 South & Central America Bioreactors Market Revenue and Forecasts and Analysis - By Technology
11.5.2.4 South & Central America Bioreactors Market Revenue and Forecasts and Analysis - By End User
11.5.3 South & Central America Bioreactors Market Revenue and Forecasts and Analysis - By Country
11.5.3.1 Brazil: Bioreactors Market – Revenue and Forecast to 2030 (USD Million)
11.5.3.2 Brazil: Bioreactors Market – Revenue and Forecast to 2030 (US$ Million)
11.5.3.2.1 Brazil Bioreactors Market Breakdown by Scale
11.5.3.2.2 Brazil Bioreactors Market Breakdown by Application
11.5.3.2.3 Brazil Bioreactors Market Breakdown by Technology
11.5.3.2.4 Brazil Bioreactors Market Breakdown by End User
11.5.3.3 Argentina: Bioreactors Market – Revenue and Forecast to 2030 (USD Million)
11.5.3.4 Argentina: Bioreactors Market – Revenue and Forecast to 2030 (US$ Million)
11.5.3.4.1 Argentina Bioreactors Market Breakdown by Scale
11.5.3.4.2 Argentina Bioreactors Market Breakdown by Application
11.5.3.4.3 Argentina Bioreactors Market Breakdown by Technology
11.5.3.4.4 Argentina Bioreactors Market Breakdown by End User
11.5.3.5 Rest of South & Central America: Bioreactors Market – Revenue and Forecast to 2030 (USD Million)
11.5.3.6 Rest of South & Central America: Bioreactors Market – Revenue and Forecast to 2030 (US$ Million)
11.5.3.6.1 Rest of South & Central America Bioreactors Market Breakdown by Scale
11.5.3.6.2 Rest of South & Central America Bioreactors Market Breakdown by Application
11.5.3.6.3 Rest of South & Central America Bioreactors Market Breakdown by Technology
11.5.3.6.4 Rest of South & Central America Bioreactors Market Breakdown by End User
12. Bioreactors Market-Industry Landscape
12.1 Overview
12.2 Growth Strategies in the Bioreactors Market
12.3 Inorganic Growth Strategies
12.3.1 Overview
12.4 Organic Growth Strategies
12.4.1 Overview
13. Company Profiles
13.1 PBS Biotech Inc
13.1.1 Key Facts
13.1.2 Business Description
13.1.3 Products and Services
13.1.4 Financial Overview
13.1.5 SWOT Analysis
13.1.6 Key Developments
13.2 Cellexus International Ltd
13.2.1 Key Facts
13.2.2 Business Description
13.2.3 Products and Services
13.2.4 Financial Overview
13.2.5 SWOT Analysis
13.2.6 Key Developments
13.3 General Electric Co
13.3.1 Key Facts
13.3.2 Business Description
13.3.3 Products and Services
13.3.4 Financial Overview
13.3.5 SWOT Analysis
13.3.6 Key Developments
13.4 Merck KGaA
13.4.1 Key Facts
13.4.2 Business Description
13.4.3 Products and Services
13.4.4 Financial Overview
13.4.5 SWOT Analysis
13.4.6 Key Developments
13.5 Thermo Fisher Scientific Inc
13.5.1 Key Facts
13.5.2 Business Description
13.5.3 Products and Services
13.5.4 Financial Overview
13.5.5 SWOT Analysis
13.5.6 Key Developments
13.6 bbi-biotech GmbH
13.6.1 Key Facts
13.6.2 Business Description
13.6.3 Products and Services
13.6.4 SWOT Analysis
13.6.5 Key Developments
13.7 Sartorius AG
13.7.1 Key Facts
13.7.2 Business Description
13.7.3 Products and Services
13.7.4 Financial Overview
13.7.5 SWOT Analysis
13.7.6 Key Developments
13.8 Pall Corp
13.8.1 Key Facts
13.8.2 Business Description
13.8.3 Products and Services
13.8.4 Financial Overview
13.8.5 SWOT Analysis
13.8.6 Key Developments
13.9 Solaris Biotechnology SRL
13.9.1 Key Facts
13.9.2 Business Description
13.9.3 Products and Services
13.9.4 Financial Overview
13.9.5 SWOT Analysis
13.9.6 Key Developments
13.10 Applikon Biotechnology BV
13.10.1 Key Facts
13.10.2 Business Description
13.10.3 Products and Services
13.10.4 Financial Overview
13.10.5 SWOT Analysis
13.10.6 Key Developments
14. Appendix
14.1 About The Insight Partners
14.2 Glossary of Terms
List of Tables
Table 1. Bioreactors Market Segmentation
Table 2. North America Bioreactors Market Revenue and Forecasts To 2030 (US$ Mn) – By Scale
Table 3. North America Bioreactors Market Revenue and Forecasts To 2030 (US$ Mn) – By Application
Table 4. North America Bioreactors Market Revenue and Forecasts To 2030 (US$ Mn) – By Technology
Table 5. North America Bioreactors Market Revenue and Forecasts To 2030 (US$ Mn) – By End User
Table 6. United States Bioreactors Market Revenue and Forecasts To 2030 (US$ Mn) – By Scale
Table 7. United States Bioreactors Market Revenue and Forecasts To 2030 (US$ Mn) – By Application
Table 8. United States Bioreactors Market Revenue and Forecasts To 2030 (US$ Mn) – By Technology
Table 9. United States Bioreactors Market Revenue and Forecasts To 2030 (US$ Mn) – By End User
Table 10. Canada Bioreactors Market Revenue and Forecasts To 2030 (US$ Mn) – By Scale
Table 11. Canada Bioreactors Market Revenue and Forecasts To 2030 (US$ Mn) – By Application
Table 12. Canada Bioreactors Market Revenue and Forecasts To 2030 (US$ Mn) – By Technology
Table 13. Canada Bioreactors Market Revenue and Forecasts To 2030 (US$ Mn) – By End User
Table 14. Mexico Bioreactors Market Revenue and Forecasts To 2030 (US$ Mn) – By Scale
Table 15. Mexico Bioreactors Market Revenue and Forecasts To 2030 (US$ Mn) – By Application
Table 16. Mexico Bioreactors Market Revenue and Forecasts To 2030 (US$ Mn) – By Technology
Table 17. Mexico Bioreactors Market Revenue and Forecasts To 2030 (US$ Mn) – By End User
Table 18. Europe Bioreactors Market Revenue and Forecasts To 2030 (US$ Mn) – By Scale
Table 19. Europe Bioreactors Market Revenue and Forecasts To 2030 (US$ Mn) – By Application
Table 20. Europe Bioreactors Market Revenue and Forecasts To 2030 (US$ Mn) – By Technology
Table 21. Europe Bioreactors Market Revenue and Forecasts To 2030 (US$ Mn) – By End User
Table 22. Germany Bioreactors Market Revenue and Forecasts To 2030 (US$ Mn) – By Scale
Table 23. Germany Bioreactors Market Revenue and Forecasts To 2030 (US$ Mn) – By Application
Table 24. Germany Bioreactors Market Revenue and Forecasts To 2030 (US$ Mn) – By Technology
Table 25. Germany Bioreactors Market Revenue and Forecasts To 2030 (US$ Mn) – By End User
Table 26. France Bioreactors Market Revenue and Forecasts To 2030 (US$ Mn) – By Scale
Table 27. France Bioreactors Market Revenue and Forecasts To 2030 (US$ Mn) – By Application
Table 28. France Bioreactors Market Revenue and Forecasts To 2030 (US$ Mn) – By Technology
Table 29. France Bioreactors Market Revenue and Forecasts To 2030 (US$ Mn) – By End User
Table 30. UK Bioreactors Market Revenue and Forecasts To 2030 (US$ Mn) – By Scale
Table 31. UK Bioreactors Market Revenue and Forecasts To 2030 (US$ Mn) – By Application
Table 32. UK Bioreactors Market Revenue and Forecasts To 2030 (US$ Mn) – By Technology
Table 33. UK Bioreactors Market Revenue and Forecasts To 2030 (US$ Mn) – By End User
Table 34. Italy Bioreactors Market Revenue and Forecasts To 2030 (US$ Mn) – By Scale
Table 35. Italy Bioreactors Market Revenue and Forecasts To 2030 (US$ Mn) – By Application
Table 36. Italy Bioreactors Market Revenue and Forecasts To 2030 (US$ Mn) – By Technology
Table 37. Italy Bioreactors Market Revenue and Forecasts To 2030 (US$ Mn) – By End User
Table 38. Spain Bioreactors Market Revenue and Forecasts To 2030 (US$ Mn) – By Scale
Table 39. Spain Bioreactors Market Revenue and Forecasts To 2030 (US$ Mn) – By Application
Table 40. Spain Bioreactors Market Revenue and Forecasts To 2030 (US$ Mn) – By Technology
Table 41. Spain Bioreactors Market Revenue and Forecasts To 2030 (US$ Mn) – By End User
Table 42. Rest of Europe Bioreactors Market Revenue and Forecasts To 2030 (US$ Mn) – By Scale
Table 43. Rest of Europe Bioreactors Market Revenue and Forecasts To 2030 (US$ Mn) – By Application
Table 44. Rest of Europe Bioreactors Market Revenue and Forecasts To 2030 (US$ Mn) – By Technology
Table 45. Rest of Europe Bioreactors Market Revenue and Forecasts To 2030 (US$ Mn) – By End User
Table 46. Asia Pacific Bioreactors Market Revenue and Forecasts To 2030 (US$ Mn) – By Scale
Table 47. Asia Pacific Bioreactors Market Revenue and Forecasts To 2030 (US$ Mn) – By Application
Table 48. Asia Pacific Bioreactors Market Revenue and Forecasts To 2030 (US$ Mn) – By Technology
Table 49. Asia Pacific Bioreactors Market Revenue and Forecasts To 2030 (US$ Mn) – By End User
Table 50. China Bioreactors Market Revenue and Forecasts To 2030 (US$ Mn) – By Scale
Table 51. China Bioreactors Market Revenue and Forecasts To 2030 (US$ Mn) – By Application
Table 52. China Bioreactors Market Revenue and Forecasts To 2030 (US$ Mn) – By Technology
Table 53. China Bioreactors Market Revenue and Forecasts To 2030 (US$ Mn) – By End User
Table 54. Japan Bioreactors Market Revenue and Forecasts To 2030 (US$ Mn) – By Scale
Table 55. Japan Bioreactors Market Revenue and Forecasts To 2030 (US$ Mn) – By Application
Table 56. Japan Bioreactors Market Revenue and Forecasts To 2030 (US$ Mn) – By Technology
Table 57. Japan Bioreactors Market Revenue and Forecasts To 2030 (US$ Mn) – By End User
Table 58. India Bioreactors Market Revenue and Forecasts To 2030 (US$ Mn) – By Scale
Table 59. India Bioreactors Market Revenue and Forecasts To 2030 (US$ Mn) – By Application
Table 60. India Bioreactors Market Revenue and Forecasts To 2030 (US$ Mn) – By Technology
Table 61. India Bioreactors Market Revenue and Forecasts To 2030 (US$ Mn) – By End User
Table 62. Australia Bioreactors Market Revenue and Forecasts To 2030 (US$ Mn) – By Scale
Table 63. Australia Bioreactors Market Revenue and Forecasts To 2030 (US$ Mn) – By Application
Table 64. Australia Bioreactors Market Revenue and Forecasts To 2030 (US$ Mn) – By Technology
Table 65. Australia Bioreactors Market Revenue and Forecasts To 2030 (US$ Mn) – By End User
Table 66. South Korea Bioreactors Market Revenue and Forecasts To 2030 (US$ Mn) – By Scale
Table 67. South Korea Bioreactors Market Revenue and Forecasts To 2030 (US$ Mn) – By Application
Table 68. South Korea Bioreactors Market Revenue and Forecasts To 2030 (US$ Mn) – By Technology
Table 69. South Korea Bioreactors Market Revenue and Forecasts To 2030 (US$ Mn) – By End User
Table 70. Rest of APAC Bioreactors Market Revenue and Forecasts To 2030 (US$ Mn) – By Scale
Table 71. Rest of APAC Bioreactors Market Revenue and Forecasts To 2030 (US$ Mn) – By Application
Table 72. Rest of APAC Bioreactors Market Revenue and Forecasts To 2030 (US$ Mn) – By Technology
Table 73. Rest of APAC Bioreactors Market Revenue and Forecasts To 2030 (US$ Mn) – By End User
Table 74. Middle East & Africa Bioreactors Market Revenue and Forecasts To 2030 (US$ Mn) – By Scale
Table 75. Middle East & Africa Bioreactors Market Revenue and Forecasts To 2030 (US$ Mn) – By Application
Table 76. Middle East & Africa Bioreactors Market Revenue and Forecasts To 2030 (US$ Mn) – By Technology
Table 77. Middle East & Africa Bioreactors Market Revenue and Forecasts To 2030 (US$ Mn) – By End User
Table 78. Saudi Arabia Bioreactors Market Revenue and Forecasts To 2030 (US$ Mn) – By Scale
Table 79. Saudi Arabia Bioreactors Market Revenue and Forecasts To 2030 (US$ Mn) – By Application
Table 80. Saudi Arabia Bioreactors Market Revenue and Forecasts To 2030 (US$ Mn) – By Technology
Table 81. Saudi Arabia Bioreactors Market Revenue and Forecasts To 2030 (US$ Mn) – By End User
Table 82. South Africa Bioreactors Market Revenue and Forecasts To 2030 (US$ Mn) – By Scale
Table 83. South Africa Bioreactors Market Revenue and Forecasts To 2030 (US$ Mn) – By Application
Table 84. South Africa Bioreactors Market Revenue and Forecasts To 2030 (US$ Mn) – By Technology
Table 85. South Africa Bioreactors Market Revenue and Forecasts To 2030 (US$ Mn) – By End User
Table 86. United Arab Emirates Bioreactors Market Revenue and Forecasts To 2030 (US$ Mn) – By Scale
Table 87. United Arab Emirates Bioreactors Market Revenue and Forecasts To 2030 (US$ Mn) – By Application
Table 88. United Arab Emirates Bioreactors Market Revenue and Forecasts To 2030 (US$ Mn) – By Technology
Table 89. United Arab Emirates Bioreactors Market Revenue and Forecasts To 2030 (US$ Mn) – By End User
Table 90. Rest of Middle East & Africa Bioreactors Market Revenue and Forecasts To 2030 (US$ Mn) – By Scale
Table 91. Rest of Middle East & Africa Bioreactors Market Revenue and Forecasts To 2030 (US$ Mn) – By Application
Table 92. Rest of Middle East & Africa Bioreactors Market Revenue and Forecasts To 2030 (US$ Mn) – By Technology
Table 93. Rest of Middle East & Africa Bioreactors Market Revenue and Forecasts To 2030 (US$ Mn) – By End User
Table 94. South & Central America Bioreactors Market Revenue and Forecasts To 2030 (US$ Mn) – By Scale
Table 95. South & Central America Bioreactors Market Revenue and Forecasts To 2030 (US$ Mn) – By Application
Table 96. South & Central America Bioreactors Market Revenue and Forecasts To 2030 (US$ Mn) – By Technology
Table 97. South & Central America Bioreactors Market Revenue and Forecasts To 2030 (US$ Mn) – By End User
Table 98. Brazil Bioreactors Market Revenue and Forecasts To 2030 (US$ Mn) – By Scale
Table 99. Brazil Bioreactors Market Revenue and Forecasts To 2030 (US$ Mn) – By Application
Table 100. Brazil Bioreactors Market Revenue and Forecasts To 2030 (US$ Mn) – By Technology
Table 101. Brazil Bioreactors Market Revenue and Forecasts To 2030 (US$ Mn) – By End User
Table 102. Argentina Bioreactors Market Revenue and Forecasts To 2030 (US$ Mn) – By Scale
Table 103. Argentina Bioreactors Market Revenue and Forecasts To 2030 (US$ Mn) – By Application
Table 104. Argentina Bioreactors Market Revenue and Forecasts To 2030 (US$ Mn) – By Technology
Table 105. Argentina Bioreactors Market Revenue and Forecasts To 2030 (US$ Mn) – By End User
Table 106. Rest of South & Central America Bioreactors Market Revenue and Forecasts To 2030 (US$ Mn) – By Scale
Table 107. Rest of South & Central America Bioreactors Market Revenue and Forecasts To 2030 (US$ Mn) – By Application
Table 108. Rest of South & Central America Bioreactors Market Revenue and Forecasts To 2030 (US$ Mn) – By Technology
Table 109. Rest of South & Central America Bioreactors Market Revenue and Forecasts To 2030 (US$ Mn) – By End User
Table 110. Recent Inorganic Growth Strategies in the Bioreactors Market
Table 111. Recent Organic Growth Strategies in the Bioreactors Market
Table 112. Glossary of Terms, Bioreactors Market
List of Figures
Figure 1. Bioreactors Market Segmentation, By Geography
Figure 2. Global - PEST Analysis
Figure 3. Impact Analysis of Drivers and Restraints
Figure 4. Bioreactors Market Revenue (US$ Million), 2022 – 2030
Figure 5. Global Bioreactors Market, By Geography Forecast Analysis, 2022 & 2030
Figure 6. Bioreactors Market Revenue Share, by Scale 2022 & 2030 (%)
Figure 7. Lab-Scale Production Market Revenue and Forecasts To 2030 (US$ Million)
Figure 8. Pilot-Scale Production Market Revenue and Forecasts To 2030 (US$ Million)
Figure 9. Full-Scale Production Market Revenue and Forecasts To 2030 (US$ Million)
Figure 10. Bioreactors Market Revenue Share, by Application 2022 & 2030 (%)
Figure 11. Microbial Application Market Revenue and Forecasts To 2030 (US$ Million)
Figure 12. Cell Culture Application Market Revenue and Forecasts To 2030 (US$ Million)
Figure 13. Others Market Revenue and Forecasts To 2030 (US$ Million)
Figure 14. Bioreactors Market Revenue Share, by Technology 2022 & 2030 (%)
Figure 15. Fed-Batch Bioreactors Market Revenue and Forecasts To 2030 (US$ Million)
Figure 16. Perfusion Bioreactors Market Revenue and Forecasts To 2030 (US$ Million)
Figure 17. Bioreactors Market Revenue Share, by End User 2022 & 2030 (%)
Figure 18. Biopharma Manufacturers Market Revenue and Forecasts To 2030 (US$ Million)
Figure 19. Research and Development Organizations Market Revenue and Forecasts To 2030 (US$ Million)
Figure 20. Contract Manufacturing Organization Market Revenue and Forecasts To 2030 (US$ Million)
Figure 21. North America: Bioreactors Market, by Key Country – Revenue (2022) (US$ Million)
Figure 22. North America Bioreactors Market Revenue and Forecasts To 2030 (US$ Mn)
Figure 23. North America Bioreactors Market Breakdown by Key Countries, 2022 and 2030 (%)
Figure 24. United States Bioreactors Market Revenue and Forecasts To 2030 (US$ Mn)
Figure 25. Canada Bioreactors Market Revenue and Forecasts To 2030 (US$ Mn)
Figure 26. Mexico Bioreactors Market Revenue and Forecasts To 2030 (US$ Mn)
Figure 27. Europe: Bioreactors Market, by Key Country – Revenue (2022) (US$ Million)
Figure 28. Europe Bioreactors Market Revenue and Forecasts To 2030 (US$ Mn)
Figure 29. Europe Bioreactors Market Breakdown by Key Countries, 2022 and 2030 (%)
Figure 30. Germany Bioreactors Market Revenue and Forecasts To 2030 (US$ Mn)
Figure 31. France Bioreactors Market Revenue and Forecasts To 2030 (US$ Mn)
Figure 32. UK Bioreactors Market Revenue and Forecasts To 2030 (US$ Mn)
Figure 33. Italy Bioreactors Market Revenue and Forecasts To 2030 (US$ Mn)
Figure 34. Spain Bioreactors Market Revenue and Forecasts To 2030 (US$ Mn)
Figure 35. Rest of Europe Bioreactors Market Revenue and Forecasts To 2030 (US$ Mn)
Figure 36. Asia Pacific: Bioreactors Market, by Key Country – Revenue (2022) (US$ Million)
Figure 37. Asia Pacific Bioreactors Market Revenue and Forecasts To 2030 (US$ Mn)
Figure 38. Asia Pacific Bioreactors Market Breakdown by Key Countries, 2022 and 2030 (%)
Figure 39. China Bioreactors Market Revenue and Forecasts To 2030 (US$ Mn)
Figure 40. Japan Bioreactors Market Revenue and Forecasts To 2030 (US$ Mn)
Figure 41. India Bioreactors Market Revenue and Forecasts To 2030 (US$ Mn)
Figure 42. Australia Bioreactors Market Revenue and Forecasts To 2030 (US$ Mn)
Figure 43. South Korea Bioreactors Market Revenue and Forecasts To 2030 (US$ Mn)
Figure 44. Rest of APAC Bioreactors Market Revenue and Forecasts To 2030 (US$ Mn)
Figure 45. Middle East & Africa: Bioreactors Market, by Key Country – Revenue (2022) (US$ Million)
Figure 46. Middle East & Africa Bioreactors Market Revenue and Forecasts To 2030 (US$ Mn)
Figure 47. Middle East & Africa Bioreactors Market Breakdown by Key Countries, 2022 and 2030 (%)
Figure 48. Saudi Arabia Bioreactors Market Revenue and Forecasts To 2030 (US$ Mn)
Figure 49. South Africa Bioreactors Market Revenue and Forecasts To 2030 (US$ Mn)
Figure 50. United Arab Emirates Bioreactors Market Revenue and Forecasts To 2030 (US$ Mn)
Figure 51. Rest of Middle East & Africa Bioreactors Market Revenue and Forecasts To 2030 (US$ Mn)
Figure 52. South & Central America: Bioreactors Market, By Key Country – Revenue (2022) (US$ Million)
Figure 53. South & Central America Bioreactors Market Revenue and Forecasts To 2030 (US$ Mn)
Figure 54. South & Central America Bioreactors Market Breakdown by Key Countries, 2022 and 2030 (%)
Figure 55. Brazil Bioreactors Market Revenue and Forecasts To 2030 (US$ Mn)
Figure 56. Argentina Bioreactors Market Revenue and Forecasts To 2030 (US$ Mn)
Figure 57. Rest of South & Central America Bioreactors Market Revenue and Forecasts To 2030 (US$ Mn)
Figure 58. Growth Strategies in the Bioreactors Market
The Insight Partners performs research in 4 major stages: Data Collection & Secondary Research, Primary Research, Data Analysis and Data Triangulation & Final Review.
- Data Collection and Secondary Research:
As a market research and consulting firm operating from a decade, we have published many reports and advised several clients across the globe. First step for any study will start with an assessment of currently available data and insights from existing reports. Further, historical and current market information is collected from Investor Presentations, Annual Reports, SEC Filings, etc., and other information related to company’s performance and market positioning are gathered from Paid Databases (Factiva, Hoovers, and Reuters) and various other publications available in public domain.
Several associations trade associates, technical forums, institutes, societies and organizations are accessed to gain technical as well as market related insights through their publications such as research papers, blogs and press releases related to the studies are referred to get cues about the market. Further, white papers, journals, magazines, and other news articles published in the last 3 years are scrutinized and analyzed to understand the current market trends.
- Primary Research:
The primarily interview analysis comprise of data obtained from industry participants interview and answers to survey questions gathered by in-house primary team.
For primary research, interviews are conducted with industry experts/CEOs/Marketing Managers/Sales Managers/VPs/Subject Matter Experts from both demand and supply side to get a 360-degree view of the market. The primary team conducts several interviews based on the complexity of the markets to understand the various market trends and dynamics which makes research more credible and precise.
A typical research interview fulfils the following functions:
- Provides first-hand information on the market size, market trends, growth trends, competitive landscape, and outlook
- Validates and strengthens in-house secondary research findings
- Develops the analysis team’s expertise and market understanding
Primary research involves email interactions and telephone interviews for each market, category, segment, and sub-segment across geographies. The participants who typically take part in such a process include, but are not limited to:
- Industry participants: VPs, business development managers, market intelligence managers and national sales managers
- Outside experts: Valuation experts, research analysts and key opinion leaders specializing in the electronics and semiconductor industry.
Below is the breakup of our primary respondents by company, designation, and region:

Once we receive the confirmation from primary research sources or primary respondents, we finalize the base year market estimation and forecast the data as per the macroeconomic and microeconomic factors assessed during data collection.
- Data Analysis:
Once data is validated through both secondary as well as primary respondents, we finalize the market estimations by hypothesis formulation and factor analysis at regional and country level.
- 3.1 Macro-Economic Factor Analysis:
We analyse macroeconomic indicators such the gross domestic product (GDP), increase in the demand for goods and services across industries, technological advancement, regional economic growth, governmental policies, the influence of COVID-19, PEST analysis, and other aspects. This analysis aids in setting benchmarks for various nations/regions and approximating market splits. Additionally, the general trend of the aforementioned components aid in determining the market's development possibilities.
- 3.2 Country Level Data:
Various factors that are especially aligned to the country are taken into account to determine the market size for a certain area and country, including the presence of vendors, such as headquarters and offices, the country's GDP, demand patterns, and industry growth. To comprehend the market dynamics for the nation, a number of growth variables, inhibitors, application areas, and current market trends are researched. The aforementioned elements aid in determining the country's overall market's growth potential.
- 3.3 Company Profile:
The “Table of Contents” is formulated by listing and analyzing more than 25 - 30 companies operating in the market ecosystem across geographies. However, we profile only 10 companies as a standard practice in our syndicate reports. These 10 companies comprise leading, emerging, and regional players. Nonetheless, our analysis is not restricted to the 10 listed companies, we also analyze other companies present in the market to develop a holistic view and understand the prevailing trends. The “Company Profiles” section in the report covers key facts, business description, products & services, financial information, SWOT analysis, and key developments. The financial information presented is extracted from the annual reports and official documents of the publicly listed companies. Upon collecting the information for the sections of respective companies, we verify them via various primary sources and then compile the data in respective company profiles. The company level information helps us in deriving the base number as well as in forecasting the market size.
- 3.4 Developing Base Number:
Aggregation of sales statistics (2020-2022) and macro-economic factor, and other secondary and primary research insights are utilized to arrive at base number and related market shares for 2022. The data gaps are identified in this step and relevant market data is analyzed, collected from paid primary interviews or databases. On finalizing the base year market size, forecasts are developed on the basis of macro-economic, industry and market growth factors and company level analysis.
- Data Triangulation and Final Review:
The market findings and base year market size calculations are validated from supply as well as demand side. Demand side validations are based on macro-economic factor analysis and benchmarks for respective regions and countries. In case of supply side validations, revenues of major companies are estimated (in case not available) based on industry benchmark, approximate number of employees, product portfolio, and primary interviews revenues are gathered. Further revenue from target product/service segment is assessed to avoid overshooting of market statistics. In case of heavy deviations between supply and demand side values, all thes steps are repeated to achieve synchronization.
We follow an iterative model, wherein we share our research findings with Subject Matter Experts (SME’s) and Key Opinion Leaders (KOLs) until consensus view of the market is not formulated – this model negates any drastic deviation in the opinions of experts. Only validated and universally acceptable research findings are quoted in our reports.
We have important check points that we use to validate our research findings – which we call – data triangulation, where we validate the information, we generate from secondary sources with primary interviews and then we re-validate with our internal data bases and Subject matter experts. This comprehensive model enables us to deliver high quality, reliable data in shortest possible time.
 Get Free Sample For