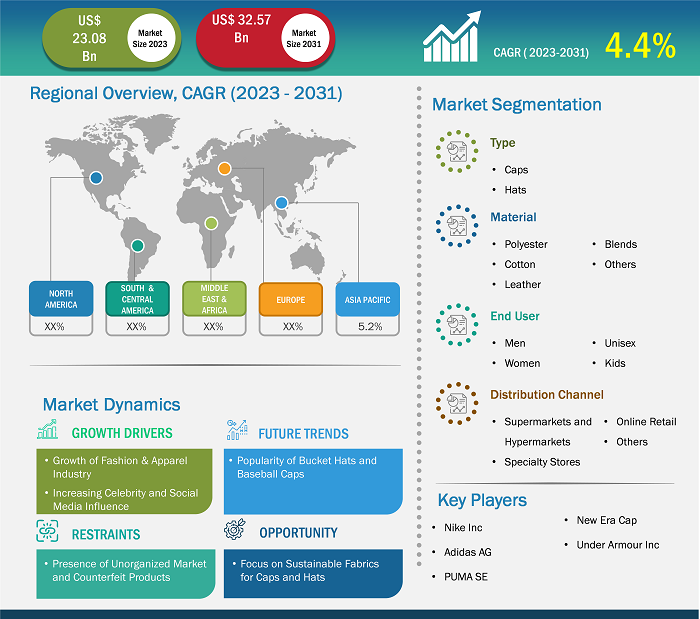
The caps and hats market was valued at US$ 23.08 billion in 2023 and is expected to reach US$ 32.57 billion by 2031; it is estimated to record a CAGR of 4.4% from 2023 to 2031.
MARKET ANALYSIS
Changing fashion trends and the increasing influence of social media have elevated these accessories beyond their functional purpose, making them integral components of personal style statements. In addition, the growing awareness of the importance of sun protection has fueled demand for caps and hats with UV protection features, particularly in regions with high sun exposure. Moreover, the expanding popularity of outdoor activities, sports, and leisure pursuits has increased the demand for caps and hats as practical and stylish accessories. Further, the rise in e-commerce and digital marketing strategies has widened the market reach, enabling brands to tap into new consumer demographics and geographic regions, thus contributing to the overall growth of the global caps and hats market
The global apparel industry is dynamic and constantly evolving with factors such as consumer demographics, economic trends, consumer buying behavior, and technological advancements. Consumers increasingly spend on apparel, footwear, and accessories to enhance their appearance with changing lifestyles. Based on the data provided by the Bureau of Labor Statistics (BLS), the annual average expenditure on apparel and services by each consumer unit in the US in 2022 was US$ 1,945. A consumer unit refers to a household consisting of two or more people who share the major expenses or are financially independent. Consumer spending on apparel and accessories also increases with a surging working population. According to the International Labor Organization (ILO), the number of employed people worldwide reached approximately 3.4 billion in 2023. With the surging number of working professionals, the emphasis on self-grooming is also increasing. The apparel & fashion industry is also significantly transforming with the changing retail landscape. The proliferating e-commerce industry, consumer preference for online shopping, and availability of various apparel and accessories of different brands at discounted prices are boosting apparel sales through online retail channels. Major manufacturers are also introducing direct-to-consumer (D2C) websites where consumers can access authentic products at affordable prices. For instance, companies such as Adidas AG, Nike Inc, and Under Armor Inc have their own direct-retailing websites where consumers can shop for authentic products, increasing customer satisfaction and brand loyalty.
Caps and hats are fashion accessories that enhance the overall look of the outfit and help individuals make a fashion statement. Caps and hats are no longer used just for protection from sun, wind, and extreme weather conditions; they are also utilized as styling elements to enhance the appearance. Various caps and hats are available for different occasions and seasons; for instance, sun hats are used explicitly in summer with beach outfits and swimsuits to elevate the overall look and provide protection against the sun. Consumers are trying different outfits and styling techniques, which drives the demand for various styling accessories, including caps and hats. Thus, the growth of the apparel & fashion industry drives the caps and hats market.
GROWTH DRIVERS AND CHALLENGES
Globalization and the penetration of the internet and smartphones have contributed to a growing awareness of the latest trends in the apparel industry. Many fashion influencers on social media platforms such as Instagram, YouTube, Facebook, and Snapchat share styling tutorials, ratings, and product links that influence the purchase decisions of consumers. Social media is strongly influencing people’s lifestyles, with many people trying to imitate celebrities and their living standards to follow the latest market trends; this majorly impacts consumer buying behavior. Also, with an increasing focus on self-appearance, people are spending on fashion accessories such as caps, hats, scarves, and trending footwear based on the latest fashion trends on social media. Several caps and hat manufacturers are investing in celebrity endorsements to enhance their brand image and boost product sales. For instance, in March 2020, PUMA SE signed a two-year agreement with Kareena Kapoor Khan, an Indian Film Industry celebrity, as its brand ambassador. Under the terms of the agreement, the actress has endorsed a new collection of PUMA, including sports shoes, gym wear, caps, and other apparel collections.
New-age celebrities and fashion icons such as Gigi Hadid, Kendall Jenner, and Rihanna pair stylish caps and hats with both casual and high-fashion outfits, demonstrating the accessory's unparalleled adaptability. Social media influencers are utilizing social media platforms such as TikTok, Instagram, and Snapchat to showcase various caps and hats, including bucket hats, trucker caps, and baseball caps in streetwear, pop-culture outfits, boho chic, casual wear, and various other aesthetic—which is inspiring the fashion sense of new generation of fans. Thus, increasing social media and celebrity influence worldwide is contributing to the growing caps and hats market size.
Customize Research To Suit Your Requirement
We can optimize and tailor the analysis and scope which is unmet through our standard offerings. This flexibility will help you gain the exact information needed for your business planning and decision making.
Caps and Hats Market: Strategic Insights

Shejal
Have a question?
Shejal will walk you through a 15-minute call to present the report’s content and answer all queries if you have any.
 Speak to Analyst
Customize Research To Suit Your Requirement
We can optimize and tailor the analysis and scope which is unmet through our standard offerings. This flexibility will help you gain the exact information needed for your business planning and decision making.
Caps and Hats Market: Strategic Insights
Shejal
Have a question?
Shejal will walk you through a 15-minute call to present the report’s content and answer all queries if you have any.
Speak to Analyst
REPORT SEGMENTATION AND SCOPE
The "Global Caps and Hats Market Analysis" has been carried out by considering segments such as type, material, end user, distribution channel, and geography. The report provides key statistics on the use of caps and hats across the world, along with their demand in major regions and countries. In addition, it provides a qualitative assessment of factors affecting the caps and hats market. It also includes a comprehensive analysis of the leading players in the market and their key strategic developments. The market analysis helps identify the caps and hats market trends, key driving factors, and lucrative opportunities that would, in turn, aid in generating higher revenues.
The ecosystem analysis and Porter’s five forces analysis provide a 360-degree view of the global caps and hats market, which helps understand the entire supply chain and various factors influencing the caps and hats market growth.
SEGMENTAL ANALYSIS
The caps and hats market is segmented on the basis of type, material, end user, distribution channel, and geography. Based on type, the market is segmented into caps and hats. The caps segment holds a larger share in the caps and hats market. The growing trend of casual and athleisure fashion has propelled the popularity of caps as versatile accessories that complement everyday outfits. In addition, increased awareness of sun protection and the desire for functional fashion items have led consumers to purchase caps that offer UV protection. The rise in the trend of social media influencers and celebrities' sporting caps has significantly influenced consumer preferences, driving product demand. The popularity of baseball caps has increased in recent years owing to the increasing influence of K-pop idols and surging demand for sports caps. These factors fuel the caps and hats market growth for the caps segment.
Caps and Hats Market Report Scope
REGIONAL ANALYSIS
The report provides a detailed overview of the global caps and hats market with respect to five major regions—North America, Europe, Asia Pacific (APAC), the Middle East & Africa (MEA), and South & Central America. Europe accounted for the largest global caps and hats market share, and the market in the region was valued at ~US$ 7,664.10 million in 2023. The market in Asia Pacific is expected to reach ~US$ 8,784.81 million by 2031. The caps and hats market in North America is expected to record a CAGR of ~4% from 2023 to 2031. The surge in demand for caps and hats in North America can be attributed to the region's prominent sports culture. According to Experian, professional sports are a huge part of American culture and society and five sports stand at the top: football, basketball, baseball, hockey, and soccer. Millions of Americans attend sports venues nationwide to support their favorite sports teams each year. In sports events such as baseball, basketball, and football, people wear caps available in the colors representing their team or to embrace the athletic aesthetic. In addition, the strong branding and team affiliation associated with caps and hats fuel their demand across North America. Whether proudly displaying team colors at a game or showcasing a favorite brand's logo, caps and hats offer consumers a way to express their allegiances and preferences, which is likely to have a significant impact on the caps and hats market forecast in the next few years. Moreover, the positive influence of fashion trends has propelled the popularity of caps and hats. Caps have gradually become fashionable statement pieces. Influencers, celebrities, and fashion-forward individuals have embraced the versatility of caps and hats, incorporating them into everyday attire to further enhance their looks. This fusion of style and functionality has contributed significantly to the surge in demand for caps and hats in North America. Also, the casualization of dress codes in both workplaces and social settings has significantly driven the demand for caps and hats. As traditional dress norms provide more relaxed and informal attire, caps have become accessories for completing laid-back yet stylish ensembles.
The widespread availability of caps and hats through online retail channels has played a crucial role in expanding their reach across the region. Online platforms offer consumers unparalleled convenience and access to various caps, hat styles, colors, and designs. This ease of shopping, coupled with the ability to compare prices and read reviews, has made online retail a preferred destination for caps and hat enthusiasts, further boosting sales and market growth across North America.
COMPETITIVE LANDSCAPE AND KEY COMPANIES
Nike Inc, Adidas AG, Under Armour Inc, H&M Hennes & Mauritz AB, New Era Cap, Puma SE, ADER, YUPOONG INC, Levi Strauss & Co, and Hooey are among the prominent players profiled in the caps and hats market report. In addition, several other players have been studied and analyzed during the study to get a holistic view of the market and its ecosystem. The caps and hats market report also includes company positioning and concentration to evaluate the performance of competitors/players in the market.

Report Coverage
Revenue forecast, Company Analysis, Industry landscape, Growth factors, and Trends

Segment Covered
This text is related
to segments covered.

Regional Scope
North America, Europe, Asia Pacific, Middle East & Africa, South & Central America

Country Scope
This text is related
to country scope.
Frequently Asked Questions
Baseball caps and bucket hats are gaining immense popularity among consumers, especially among Generation Z, athletes, and pop-culture enthusiasts, as they can be paired easily with casual outfits such as jeans, shorts, oversized t-shirts, and sportswear. Baseball caps are versatile and can be used as go-to styling accessories. According to the Trend Report by Depop, an online marketplace that sells unique and creative goods and a subsidiary of Etsy, the searches for baseball hats increased to 79% in 2023 from 2023. In addition, bucket hats have become a fashion statement, with many celebrities, athletes, and sportspeople pairing them with casual outfits.
Various celebrities including Kendall Jenner wore baseball hats as a part of their ordinary outfits, which increased the popularity of baseball caps among consumers. During the Ashes cricket tournament, Ben Stokes, the captain of the England Test cricket team, wore a bucket hat with the “Three Lions” crest embroidered on the front, which caught the attention of a majority of the fans. This bucket hat led to the rise of a popular trend on Twitter, where he was referred to as “Bucket Hat Ben.” Thus, baseball caps and bucket hats are becoming trending fashion accessories, which is projected to boost the overall caps and hats market in the coming years.
The major players operating in the global caps and hats market are Nike Inc, Adidas AG, Under Armour Inc, H&M Hennes & Mauritz AB, New Era Cap, Puma SE, ADER, YUPOONG INC, Levi Strauss & Co, and Hooey among others.
In 2023, Europe dominated the global caps and hats market share. The presence of renowned fashion capitals such as Paris, Milan, and London significantly impact consumer preferences and trends in the fashion and apparel industry. These cities are at the forefront of global fashion and highly focused on enhancing style and innovation. As a result, caps and hats have become integral accessories in the European fashion scene, with designers and influencers incorporating them into runway looks and street-style ensembles. The association with high-end fashion elevates the appeal of caps and hats, driving their demand among fashion-conscious consumers across Europe.
Globalization and the penetration of the internet and smartphones have contributed to a growing awareness of the latest trends in the apparel industry. Many fashion influencers on social media platforms such as Instagram, YouTube, Facebook, and Snapchat share styling tutorials, ratings, and product links that influence the purchase decisions of consumers. Social media is strongly influencing people’s lifestyles, with many people trying to imitate celebrities and their living standards to follow the latest market trends; this majorly impacts consumer buying behavior. Also, with an increasing focus on self-appearance, people are spending on fashion accessories such as caps, hats, scarves, and trending footwear based on the latest fashion trends on social media. Several caps and hats manufacturers are investing in celebrity endorsements to enhance their brand image and boost product sales. For instance, in March 2020, PUMA SE signed a two-year agreement with Kareena Kapoor Khan, an Indian film industry celebrity, as its brand ambassador. Under the terms of the agreement, the actress has endorsed a new collection of PUMA, including sports shoes, gym wear, caps, and other apparel collection.
Based on type, the market is segmented into caps and hats. The caps segment holds the largest market share. The growing trend of casual and athleisure fashion has propelled the popularity of caps as versatile accessories that complement everyday outfits. In addition, increased awareness of sun protection and the desire for functional fashion items have led consumers to purchase caps that offer UV protection. The rise in the trend of social media influencers and celebrities' sporting caps has significantly influenced consumer preferences, driving the product demand. For instance, in March 2020, PUMA SE signed a two-year agreement with Kareena Kapoor Khan, an Indian Film Industry celebrity, as its brand ambassador. The actress will endorse a new collection of PUMA, including sports shoes, gym wear, caps, and other apparel collection. The popularity of baseball caps has increased in recent years owing to the increasing influence of K-pop idols and surging demand for sports caps.
By end user, the caps and hats market is segmented into men, women, unisex, and kids. Men segment held a significant caps and hats market share. The evolving fashion landscape, marked by the growing popularity of streetwear and casual styles, has propelled the status of caps and hats as essential components of contemporary menswear. This shift toward comfortable and versatile fashion choices has led men to incorporate caps and hats into their daily outfits, whether for practicality or as style statements. In addition, the rise of social media and digital influencers has significantly contributed to the dissemination of fashion trends and the promotion of various hat styles, driving consumer interest globally. Moreover, the increasing influence of athletes and pop culture, especially among Generation Z, has surged the adoption of popular caps and hats. Further, the rise in e-commerce and consumer preference for online shopping has bolstered the demand for caps and hats among men.
1. Introduction
1.1 The Insight Partners Research Report Guidance
1.2 Market Segmentation
2. Executive Summary
2.1 Key Market Insights
2.2 Market Attractiveness
3. Research Methodology
3.1 Coverage
3.2 Secondary Research
3.3 Primary Research
3.4 Limitation and Assumptions
4. Caps and Hats Market Landscape
4.1 Market Overview
4.2 Porter’s Analysis
4.2.1 Bargaining Power of Suppliers
4.2.2 Bargaining Power of Buyers
4.2.3 Threat of New Entrants
4.2.4 Competitive Rivalry
4.2.5 Threat of Substitutes
4.3 Ecosystem Analysis
4.3.1 Raw Material Suppliers:
4.3.2 Manufacturers:
4.3.3 Retailers:
4.3.4 List of Vendors in the Value Chain
5. Caps and Hats Market – Key Market Dynamics
5.1 Caps and Hats Market – Key Market Dynamics
5.2 Market Drivers
5.2.1 Growth of Fashion & Apparel Industry
5.2.2 Increasing Celebrity and Social Media Influence
5.3 Market Restraints
5.3.1 Presence of Unorganized Market and Counterfeit Products
5.4 Market Opportunities
5.4.1 Focus on Sustainable Fabrics for Caps and Hats
5.5 Future Trends
5.5.1 Popularity of Bucket Hats and Baseball Caps
5.6 Impact of Drivers and Restraints:
6. Caps and Hats Market – Global Market Analysis
6.1 Caps and Hats Market Revenue (US$ Million), 2020–2031
6.2 Caps and Hats Market Forecast Analysis
7. Caps and Hats Market Analysis – by Type
7.1 Caps
7.1.1 Overview
7.1.2 Caps: Caps and Hats Market – Revenue and Forecast to 2031 (US$ Million)
7.2 Hats
7.2.1 Overview
7.2.2 Hats: Caps and Hats Market – Revenue and Forecast to 2031 (US$ Million)
8. Caps and Hats Market Analysis – by Material
8.1 Polyester
8.1.1 Overview
8.1.2 Polyester: Caps and Hats Market – Revenue and Forecast to 2031 (US$ Million)
8.2 Cotton
8.2.1 Overview
8.2.2 Cotton: Caps and Hats Market – Revenue and Forecast to 2031 (US$ Million)
8.3 Leather
8.3.1 Overview
8.3.2 Leather: Caps and Hats Market – Revenue and Forecast to 2031 (US$ Million)
8.4 Blends
8.4.1 Overview
8.4.2 Blends: Caps and Hats Market – Revenue and Forecast to 2031 (US$ Million)
8.5 Others
8.5.1 Overview
8.5.2 Others: Caps and Hats Market – Revenue and Forecast to 2031 (US$ Million)
9. Caps and Hats Market Analysis – by End User
9.1 Men
9.1.1 Overview
9.1.2 Men: Caps and Hats Market – Revenue and Forecast to 2031 (US$ Million)
9.2 Women
9.2.1 Overview
9.2.2 Women: Caps and Hats Market – Revenue and Forecast to 2031 (US$ Million)
9.3 Unisex
9.3.1 Overview
9.3.2 Unisex: Caps and Hats Market – Revenue and Forecast to 2031 (US$ Million)
9.4 Kids
9.4.1 Overview
9.4.2 Kids: Caps and Hats Market – Revenue and Forecast to 2031 (US$ Million)
10. Caps and Hats Market Analysis – by Distribution Channel
10.1 Supermarket and Hypermarket
10.1.1 Overview
10.1.2 Supermarket and Hypermarket: Caps and Hats Market – Revenue and Forecast to 2031 (US$ Million)
10.2 Specialty Stores
10.2.1 Overview
10.2.2 Specialty Stores: Caps and Hats Market – Revenue and Forecast to 2031 (US$ Million)
10.3 Online Retail
10.3.1 Overview
10.3.2 Online Retail: Caps and Hats Market – Revenue and Forecast to 2031 (US$ Million)
10.4 Others
10.4.1 Overview
10.4.2 Others: Caps and Hats Market – Revenue and Forecast to 2031 (US$ Million)
11. Caps and Hats Market – Geographical Analysis
11.1 Overview
11.2 North America
11.2.1 North America Caps and Hats Market Overview
11.2.2 North America: Caps and Hats Market – Revenue and Forecast to 2031 (US$ Million)
11.2.3 North America: Caps and Hats Market Breakdown, by Type
11.2.3.1 North America: Caps and Hats Market – Revenue and Forecast Analysis – by Type
11.2.4 North America: Caps and Hats Market Breakdown, by Material
11.2.4.1 North America: Caps and Hats Market – Revenue and Forecast Analysis – by Material
11.2.5 North America: Caps and Hats Market Breakdown, by End User
11.2.5.1 North America: Caps and Hats Market – Revenue and Forecast Analysis – by End User
11.2.6 North America: Caps and Hats Market Breakdown, by Distribution Channel
11.2.6.1 North America: Caps and Hats Market – Revenue and Forecast Analysis – by Distribution Channel
11.2.7 North America: Caps and Hats Market – Revenue and Forecast Analysis – by Country
11.2.7.1 North America: Caps and Hats Market – Revenue and Forecast Analysis – by Country
11.2.7.2 United States: Caps and Hats Market – Revenue and Forecast to 2031 (US$ Million)
11.2.7.2.1 United States: Caps and Hats Market Breakdown, by Type
11.2.7.2.2 United States: Caps and Hats Market Breakdown, by Material
11.2.7.2.3 United States: Caps and Hats Market Breakdown, by End User
11.2.7.2.4 United States: Caps and Hats Market Breakdown, by Distribution Channel
11.2.7.3 Canada: Caps and Hats Market – Revenue and Forecast to 2031 (US$ Million)
11.2.7.3.1 Canada: Caps and Hats Market Breakdown, by Type
11.2.7.3.2 Canada: Caps and Hats Market Breakdown, by Material
11.2.7.3.3 Canada: Caps and Hats Market Breakdown, by End User
11.2.7.3.4 Canada: Caps and Hats Market Breakdown, by Distribution Channel
11.2.7.4 Mexico: Caps and Hats Market – Revenue and Forecast to 2031 (US$ Million)
11.2.7.4.1 Mexico: Caps and Hats Market Breakdown, by Type
11.2.7.4.2 Mexico: Caps and Hats Market Breakdown, by Material
11.2.7.4.3 Mexico: Caps and Hats Market Breakdown, by End User
11.2.7.4.4 Mexico: Caps and Hats Market Breakdown, by Distribution Channel
11.3 Europe
11.3.1 Europe Caps and Hats Market Overview
11.3.2 Europe: Caps and Hats Market – Revenue and Forecast to 2031 (US$ Million)
11.3.3 Europe: Caps and Hats Market Breakdown, by Type
11.3.3.1 Europe: Caps and Hats Market – Revenue and Forecast Analysis – by Type
11.3.4 Europe: Caps and Hats Market Breakdown, by Material
11.3.4.1 Europe: Caps and Hats Market – Revenue and Forecast Analysis – by Material
11.3.5 Europe: Caps and Hats Market Breakdown, by End User
11.3.5.1 Europe: Caps and Hats Market – Revenue and Forecast Analysis – by End User
11.3.6 Europe: Caps and Hats Market Breakdown, by Distribution Channel
11.3.6.1 Europe: Caps and Hats Market – Revenue and Forecast Analysis – by Distribution Channel
11.3.7 Europe: Caps and Hats Market – Revenue and Forecast Analysis – by Country
11.3.7.1 Europe: Caps and Hats Market – Revenue and Forecast Analysis – by Country
11.3.7.2 Germany: Caps and Hats Market – Revenue and Forecast to 2031 (US$ Million)
11.3.7.2.1 Germany: Caps and Hats Market Breakdown, by Type
11.3.7.2.2 Germany: Caps and Hats Market Breakdown, by Material
11.3.7.2.3 Germany: Caps and Hats Market Breakdown, by End User
11.3.7.2.4 Germany: Caps and Hats Market Breakdown, by Distribution Channel
11.3.7.3 UK: Caps and Hats Market – Revenue and Forecast to 2031 (US$ Million)
11.3.7.3.1 UK: Caps and Hats Market Breakdown, by Type
11.3.7.3.2 UK: Caps and Hats Market Breakdown, by Material
11.3.7.3.3 UK: Caps and Hats Market Breakdown, by End User
11.3.7.3.4 UK: Caps and Hats Market Breakdown, by Distribution Channel
11.3.7.4 France: Caps and Hats Market – Revenue and Forecast to 2031 (US$ Million)
11.3.7.4.1 France: Caps and Hats Market Breakdown, by Type
11.3.7.4.2 France: Caps and Hats Market Breakdown, by Material
11.3.7.4.3 France: Caps and Hats Market Breakdown, by End User
11.3.7.4.4 France: Caps and Hats Market Breakdown, by Distribution Channel
11.3.7.5 Italy: Caps and Hats Market – Revenue and Forecast to 2031 (US$ Million)
11.3.7.5.1 Italy: Caps and Hats Market Breakdown, by Type
11.3.7.5.2 Italy: Caps and Hats Market Breakdown, by Material
11.3.7.5.3 Italy: Caps and Hats Market Breakdown, by End User
11.3.7.5.4 Italy: Caps and Hats Market Breakdown, by Distribution Channel
11.3.7.6 Russia: Caps and Hats Market – Revenue and Forecast to 2031 (US$ Million)
11.3.7.6.1 Russia: Caps and Hats Market Breakdown, by Type
11.3.7.6.2 Russia: Caps and Hats Market Breakdown, by Material
11.3.7.6.3 Russia: Caps and Hats Market Breakdown, by End User
11.3.7.6.4 Russia: Caps and Hats Market Breakdown, by Distribution Channel
11.3.7.7 Rest of Europe: Caps and Hats Market – Revenue and Forecast to 2031 (US$ Million)
11.3.7.7.1 Rest of Europe: Caps and Hats Market Breakdown, by Type
11.3.7.7.2 Rest of Europe: Caps and Hats Market Breakdown, by Material
11.3.7.7.3 Rest of Europe: Caps and Hats Market Breakdown, by End User
11.3.7.7.4 Rest of Europe: Caps and Hats Market Breakdown, by Distribution Channel
11.4 Asia Pacific
11.4.1 Asia Pacific Caps and Hats Market Overview
11.4.2 Asia Pacific: Caps and Hats Market – Revenue and Forecast to 2031 (US$ Million)
11.4.3 Asia Pacific: Caps and Hats Market Breakdown, by Type
11.4.3.1 Asia Pacific: Caps and Hats Market – Revenue and Forecast Analysis – by Type
11.4.4 Asia Pacific: Caps and Hats Market Breakdown, by Material
11.4.4.1 Asia Pacific: Caps and Hats Market – Revenue and Forecast Analysis – by Material
11.4.5 Asia Pacific: Caps and Hats Market Breakdown, by End User
11.4.5.1 Asia Pacific: Caps and Hats Market – Revenue and Forecast Analysis – by End User
11.4.6 Asia Pacific: Caps and Hats Market Breakdown, by Distribution Channel
11.4.6.1 Asia Pacific: Caps and Hats Market – Revenue and Forecast Analysis – by Distribution Channel
11.4.7 Asia Pacific: Caps and Hats Market – Revenue and Forecast Analysis – by Country
11.4.7.1 Asia Pacific: Caps and Hats Market – Revenue and Forecast Analysis – by Country
11.4.7.2 China: Caps and Hats Market – Revenue and Forecast to 2031 (US$ Million)
11.4.7.2.1 China: Caps and Hats Market Breakdown, by Type
11.4.7.2.2 China: Caps and Hats Market Breakdown, by Material
11.4.7.2.3 China: Caps and Hats Market Breakdown, by End User
11.4.7.2.4 China: Caps and Hats Market Breakdown, by Distribution Channel
11.4.7.3 Japan: Caps and Hats Market – Revenue and Forecast to 2031 (US$ Million)
11.4.7.3.1 Japan: Caps and Hats Market Breakdown, by Type
11.4.7.3.2 Japan: Caps and Hats Market Breakdown, by Material
11.4.7.3.3 Japan: Caps and Hats Market Breakdown, by End User
11.4.7.3.4 Japan: Caps and Hats Market Breakdown, by Distribution Channel
11.4.7.4 India: Caps and Hats Market – Revenue and Forecast to 2031 (US$ Million)
11.4.7.4.1 India: Caps and Hats Market Breakdown, by Type
11.4.7.4.2 India: Caps and Hats Market Breakdown, by Material
11.4.7.4.3 India: Caps and Hats Market Breakdown, by End User
11.4.7.4.4 India: Caps and Hats Market Breakdown, by Distribution Channel
11.4.7.5 Australia: Caps and Hats Market – Revenue and Forecast to 2031 (US$ Million)
11.4.7.5.1 Australia: Caps and Hats Market Breakdown, by Type
11.4.7.5.2 Australia: Caps and Hats Market Breakdown, by Material
11.4.7.5.3 Australia: Caps and Hats Market Breakdown, by End User
11.4.7.5.4 Australia: Caps and Hats Market Breakdown, by Distribution Channel
11.4.7.6 South Korea: Caps and Hats Market – Revenue and Forecast to 2031 (US$ Million)
11.4.7.6.1 South Korea: Caps and Hats Market Breakdown, by Type
11.4.7.6.2 South Korea: Caps and Hats Market Breakdown, by Material
11.4.7.6.3 South Korea: Caps and Hats Market Breakdown, by End User
11.4.7.6.4 South Korea: Caps and Hats Market Breakdown, by Distribution Channel
11.4.7.7 Rest of APAC: Caps and Hats Market – Revenue and Forecast to 2031 (US$ Million)
11.4.7.7.1 Rest of APAC: Caps and Hats Market Breakdown, by Type
11.4.7.7.2 Rest of APAC: Caps and Hats Market Breakdown, by Material
11.4.7.7.3 Rest of APAC: Caps and Hats Market Breakdown, by End User
11.4.7.7.4 Rest of APAC: Caps and Hats Market Breakdown, by Distribution Channel
11.5 South and Central America
11.5.1 South and Central America Caps and Hats Market Overview
11.5.2 South and Central America: Caps and Hats Market – Revenue and Forecast to 2031 (US$ Million)
11.5.3 South and Central America: Caps and Hats Market Breakdown, by Type
11.5.3.1 South and Central America: Caps and Hats Market – Revenue and Forecast Analysis – by Type
11.5.4 South and Central America: Caps and Hats Market Breakdown, by Material
11.5.4.1 South and Central America: Caps and Hats Market – Revenue and Forecast Analysis – by Material
11.5.5 South and Central America: Caps and Hats Market Breakdown, by End User
11.5.5.1 South and Central America: Caps and Hats Market – Revenue and Forecast Analysis – by End User
11.5.6 South and Central America: Caps and Hats Market Breakdown, by Distribution Channel
11.5.6.1 South and Central America: Caps and Hats Market – Revenue and Forecast Analysis – by Distribution Channel
11.5.7 South and Central America: Caps and Hats Market – Revenue and Forecast Analysis – by Country
11.5.7.1 South and Central America: Caps and Hats Market – Revenue and Forecast Analysis – by Country
11.5.7.2 Brazil: Caps and Hats Market – Revenue and Forecast to 2031 (US$ Million)
11.5.7.2.1 Brazil: Caps and Hats Market Breakdown, by Type
11.5.7.2.2 Brazil: Caps and Hats Market Breakdown, by Material
11.5.7.2.3 Brazil: Caps and Hats Market Breakdown, by End User
11.5.7.2.4 Brazil: Caps and Hats Market Breakdown, by Distribution Channel
11.5.7.3 Argentina: Caps and Hats Market – Revenue and Forecast to 2031 (US$ Million)
11.5.7.3.1 Argentina: Caps and Hats Market Breakdown, by Type
11.5.7.3.2 Argentina: Caps and Hats Market Breakdown, by Material
11.5.7.3.3 Argentina: Caps and Hats Market Breakdown, by End User
11.5.7.3.4 Argentina: Caps and Hats Market Breakdown, by Distribution Channel
11.5.7.4 Rest of South and Central America: Caps and Hats Market – Revenue and Forecast to 2031 (US$ Million)
11.5.7.4.1 Rest of South and Central America: Caps and Hats Market Breakdown, by Type
11.5.7.4.2 Rest of South and Central America: Caps and Hats Market Breakdown, by Material
11.5.7.4.3 Rest of South and Central America: Caps and Hats Market Breakdown, by End User
11.5.7.4.4 Rest of South and Central America: Caps and Hats Market Breakdown, by Distribution Channel
11.6 Middle East and Africa
11.6.1 Middle East and Africa Caps and Hats Market Overview
11.6.2 Middle East and Africa: Caps and Hats Market – Revenue and Forecast to 2031 (US$ Million)
11.6.3 Middle East and Africa: Caps and Hats Market Breakdown, by Type
11.6.3.1 Middle East and Africa: Caps and Hats Market – Revenue and Forecast Analysis – by Type
11.6.4 Middle East and Africa: Caps and Hats Market Breakdown, by Material
11.6.4.1 Middle East and Africa: Caps and Hats Market – Revenue and Forecast Analysis – by Material
11.6.5 Middle East and Africa: Caps and Hats Market Breakdown, by End User
11.6.5.1 Middle East and Africa: Caps and Hats Market – Revenue and Forecast Analysis – by End User
11.6.6 Middle East and Africa: Caps and Hats Market Breakdown, by Distribution Channel
11.6.6.1 Middle East and Africa: Caps and Hats Market – Revenue and Forecast Analysis – by Distribution Channel
11.6.7 Middle East and Africa: Caps and Hats Market – Revenue and Forecast Analysis – by Country
11.6.7.1 Middle East and Africa: Caps and Hats Market – Revenue and Forecast Analysis – by Country
11.6.7.2 Saudi Arabia: Caps and Hats Market – Revenue and Forecast to 2031 (US$ Million)
11.6.7.2.1 Saudi Arabia: Caps and Hats Market Breakdown, by Type
11.6.7.2.2 Saudi Arabia: Caps and Hats Market Breakdown, by Material
11.6.7.2.3 Saudi Arabia: Caps and Hats Market Breakdown, by End User
11.6.7.2.4 Saudi Arabia: Caps and Hats Market Breakdown, by Distribution Channel
11.6.7.3 United Arab Emirates: Caps and Hats Market – Revenue and Forecast to 2031 (US$ Million)
11.6.7.3.1 United Arab Emirates: Caps and Hats Market Breakdown, by Type
11.6.7.3.2 United Arab Emirates: Caps and Hats Market Breakdown, by Material
11.6.7.3.3 United Arab Emirates: Caps and Hats Market Breakdown, by End User
11.6.7.3.4 United Arab Emirates: Caps and Hats Market Breakdown, by Distribution Channel
11.6.7.4 South Africa: Caps and Hats Market – Revenue and Forecast to 2031 (US$ Million)
11.6.7.4.1 South Africa: Caps and Hats Market Breakdown, by Type
11.6.7.4.2 South Africa: Caps and Hats Market Breakdown, by Material
11.6.7.4.3 South Africa: Caps and Hats Market Breakdown, by End User
11.6.7.4.4 South Africa: Caps and Hats Market Breakdown, by Distribution Channel
11.6.7.5 Rest of Middle East and Africa: Caps and Hats Market – Revenue and Forecast to 2031 (US$ Million)
11.6.7.5.1 Rest of Middle East and Africa: Caps and Hats Market Breakdown, by Type
11.6.7.5.2 Rest of Middle East and Africa: Caps and Hats Market Breakdown, by Material
11.6.7.5.3 Rest of Middle East and Africa: Caps and Hats Market Breakdown, by End User
11.6.7.5.4 Rest of Middle East and Africa: Caps and Hats Market Breakdown, by Distribution Channel
12. Caps and Hats Market – Impact of COVID-19 Pandemic
12.1 Pre & Post COVID-19 Impact
13. Competitive Landscape
13.1 Heat Map Analysis
13.2 Company Positioning & Concentration
14. Company Profiles
14.1 Nike Inc
14.1.1 Key Facts
14.1.2 Business Description
14.1.3 Products and Services
14.1.4 Financial Overview
14.1.5 SWOT Analysis
14.1.6 Key Developments
14.2 Adidas AG
14.2.1 Key Facts
14.2.2 Business Description
14.2.3 Products and Services
14.2.4 Financial Overview
14.2.5 SWOT Analysis
14.2.6 Key Developments
14.3 Under Armour Inc
14.3.1 Key Facts
14.3.2 Business Description
14.3.3 Products and Services
14.3.4 Financial Overview
14.3.5 SWOT Analysis
14.3.6 Key Developments
14.4 H&M Hennes & Mauritz AB
14.4.1 Key Facts
14.4.2 Business Description
14.4.3 Products and Services
14.4.4 Financial Overview
14.4.5 SWOT Analysis
14.4.6 Key Developments
14.5 New Era Cap
14.5.1 Key Facts
14.5.2 Business Description
14.5.3 Products and Services
14.5.4 Financial Overview
14.5.5 SWOT Analysis
14.5.6 Key Developments
14.6 Puma SE
14.6.1 Key Facts
14.6.2 Business Description
14.6.3 Products and Services
14.6.4 Financial Overview
14.6.5 SWOT Analysis
14.6.6 Key Developments
14.7 ADER
14.7.1 Key Facts
14.7.2 Business Description
14.7.3 Products and Services
14.7.4 Financial Overview
14.7.5 SWOT Analysis
14.7.6 Key Developments
14.8 YUPOONG INC
14.8.1 Key Facts
14.8.2 Business Description
14.8.3 Products and Services
14.8.4 Financial Overview
14.8.5 SWOT Analysis
14.8.6 Key Developments
14.9 Levi Strauss & Co
14.9.1 Key Facts
14.9.2 Business Description
14.9.3 Products and Services
14.9.4 Financial Overview
14.9.5 SWOT Analysis
14.9.6 Key Developments
14.10 Hooey
14.10.1 Key Facts
14.10.2 Business Description
14.10.3 Products and Services
14.10.4 Financial Overview
14.10.5 SWOT Analysis
14.10.6 Key Developments
15. Appendix
15.1 About The Insight Partners
List of Tables
Table 1. Caps and Hats Market Segmentation
Table 2. List of Vendors
Table 3. Caps and Hats Market – Revenue and Forecast to 2031 (US$ Million)
Table 4. Caps and Hats Market – Revenue and Forecast to 2031 (US$ Million) – by Type
Table 5. Caps and Hats Market – Revenue and Forecast to 2031 (US$ Million) – by Material
Table 6. Caps and Hats Market – Revenue and Forecast to 2031 (US$ Million) – by End User
Table 7. Caps and Hats Market – Revenue and Forecast to 2031 (US$ Million) – by Distribution Channel
Table 8. North America: Caps and Hats Market – Revenue and Forecast to 2031(US$ Million) – by Type
Table 9. North America: Caps and Hats Market – Revenue and Forecast to 2031(US$ Million) – by Material
Table 10. North America: Caps and Hats Market – Revenue and Forecast to 2031(US$ Million) – by End User
Table 11. North America: Caps and Hats Market – Revenue and Forecast to 2031(US$ Million) – by Distribution Channel
Table 12. North America: Caps and Hats Market – Revenue and Forecast to 2031(US$ Million) – by Country
Table 13. United States: Caps and Hats Market – Revenue and Forecast to 2031(US$ Million) – by Type
Table 14. United States: Caps and Hats Market – Revenue and Forecast to 2031(US$ Million) – by Material
Table 15. United States: Caps and Hats Market – Revenue and Forecast to 2031(US$ Million) – by End User
Table 16. United States: Caps and Hats Market – Revenue and Forecast to 2031(US$ Million) – by Distribution Channel
Table 17. Canada: Caps and Hats Market – Revenue and Forecast to 2031(US$ Million) – by Type
Table 18. Canada: Caps and Hats Market – Revenue and Forecast to 2031(US$ Million) – by Material
Table 19. Canada: Caps and Hats Market – Revenue and Forecast to 2031(US$ Million) – by End User
Table 20. Canada: Caps and Hats Market – Revenue and Forecast to 2031(US$ Million) – by Distribution Channel
Table 21. Mexico: Caps and Hats Market – Revenue and Forecast to 2031(US$ Million) – by Type
Table 22. Mexico: Caps and Hats Market – Revenue and Forecast to 2031(US$ Million) – by Material
Table 23. Mexico: Caps and Hats Market – Revenue and Forecast to 2031(US$ Million) – by End User
Table 24. Mexico: Caps and Hats Market – Revenue and Forecast to 2031(US$ Million) – by Distribution Channel
Table 25. Europe: Caps and Hats Market – Revenue and Forecast to 2031(US$ Million) – by Type
Table 26. Europe: Caps and Hats Market – Revenue and Forecast to 2031(US$ Million) – by Material
Table 27. Europe: Caps and Hats Market – Revenue and Forecast to 2031(US$ Million) – by End User
Table 28. Europe: Caps and Hats Market – Revenue and Forecast to 2031(US$ Million) – by Distribution Channel
Table 29. Europe: Caps and Hats Market – Revenue and Forecast to 2031(US$ Million) – by Country
Table 30. Germany: Caps and Hats Market – Revenue and Forecast to 2031(US$ Million) – by Type
Table 31. Germany: Caps and Hats Market – Revenue and Forecast to 2031(US$ Million) – by Material
Table 32. Germany: Caps and Hats Market – Revenue and Forecast to 2031(US$ Million) – by End User
Table 33. Germany: Caps and Hats Market – Revenue and Forecast to 2031(US$ Million) – by Distribution Channel
Table 34. UK: Caps and Hats Market – Revenue and Forecast to 2031(US$ Million) – by Type
Table 35. UK: Caps and Hats Market – Revenue and Forecast to 2031(US$ Million) – by Material
Table 36. UK: Caps and Hats Market – Revenue and Forecast to 2031(US$ Million) – by End User
Table 37. UK: Caps and Hats Market – Revenue and Forecast to 2031(US$ Million) – by Distribution Channel
Table 38. France: Caps and Hats Market – Revenue and Forecast to 2031(US$ Million) – by Type
Table 39. France: Caps and Hats Market – Revenue and Forecast to 2031(US$ Million) – by Material
Table 40. France: Caps and Hats Market – Revenue and Forecast to 2031(US$ Million) – by End User
Table 41. France: Caps and Hats Market – Revenue and Forecast to 2031(US$ Million) – by Distribution Channel
Table 42. Italy: Caps and Hats Market – Revenue and Forecast to 2031(US$ Million) – by Type
Table 43. Italy: Caps and Hats Market – Revenue and Forecast to 2031(US$ Million) – by Material
Table 44. Italy: Caps and Hats Market – Revenue and Forecast to 2031(US$ Million) – by End User
Table 45. Italy: Caps and Hats Market – Revenue and Forecast to 2031(US$ Million) – by Distribution Channel
Table 46. Russia: Caps and Hats Market – Revenue and Forecast to 2031(US$ Million) – by Type
Table 47. Russia: Caps and Hats Market – Revenue and Forecast to 2031(US$ Million) – by Material
Table 48. Russia: Caps and Hats Market – Revenue and Forecast to 2031(US$ Million) – by End User
Table 49. Russia: Caps and Hats Market – Revenue and Forecast to 2031(US$ Million) – by Distribution Channel
Table 50. Rest of Europe: Caps and Hats Market – Revenue and Forecast to 2031(US$ Million) – by Type
Table 51. Rest of Europe: Caps and Hats Market – Revenue and Forecast to 2031(US$ Million) – by Material
Table 52. Rest of Europe: Caps and Hats Market – Revenue and Forecast to 2031(US$ Million) – by End User
Table 53. Rest of Europe: Caps and Hats Market – Revenue and Forecast to 2031(US$ Million) – by Distribution Channel
Table 54. Asia Pacific: Caps and Hats Market – Revenue and Forecast to 2031(US$ Million) – by Type
Table 55. Asia Pacific: Caps and Hats Market – Revenue and Forecast to 2031(US$ Million) – by Material
Table 56. Asia Pacific: Caps and Hats Market – Revenue and Forecast to 2031(US$ Million) – by End User
Table 57. Asia Pacific: Caps and Hats Market – Revenue and Forecast to 2031(US$ Million) – by Distribution Channel
Table 58. Asia Pacific: Caps and Hats Market – Revenue and Forecast to 2031(US$ Million) – by Country
Table 59. China: Caps and Hats Market – Revenue and Forecast to 2031(US$ Million) – by Type
Table 60. China: Caps and Hats Market – Revenue and Forecast to 2031(US$ Million) – by Material
Table 61. China: Caps and Hats Market – Revenue and Forecast to 2031(US$ Million) – by End User
Table 62. China: Caps and Hats Market – Revenue and Forecast to 2031(US$ Million) – by Distribution Channel
Table 63. Japan: Caps and Hats Market – Revenue and Forecast to 2031(US$ Million) – by Type
Table 64. Japan: Caps and Hats Market – Revenue and Forecast to 2031(US$ Million) – by Material
Table 65. Japan: Caps and Hats Market – Revenue and Forecast to 2031(US$ Million) – by End User
Table 66. Japan: Caps and Hats Market – Revenue and Forecast to 2031(US$ Million) – by Distribution Channel
Table 67. India: Caps and Hats Market – Revenue and Forecast to 2031(US$ Million) – by Type
Table 68. India: Caps and Hats Market – Revenue and Forecast to 2031(US$ Million) – by Material
Table 69. India: Caps and Hats Market – Revenue and Forecast to 2031(US$ Million) – by End User
Table 70. India: Caps and Hats Market – Revenue and Forecast to 2031(US$ Million) – by Distribution Channel
Table 71. Australia: Caps and Hats Market – Revenue and Forecast to 2031(US$ Million) – by Type
Table 72. Australia: Caps and Hats Market – Revenue and Forecast to 2031(US$ Million) – by Material
Table 73. Australia: Caps and Hats Market – Revenue and Forecast to 2031(US$ Million) – by End User
Table 74. Australia: Caps and Hats Market – Revenue and Forecast to 2031(US$ Million) – by Distribution Channel
Table 75. South Korea: Caps and Hats Market – Revenue and Forecast to 2031(US$ Million) – by Type
Table 76. South Korea: Caps and Hats Market – Revenue and Forecast to 2031(US$ Million) – by Material
Table 77. South Korea: Caps and Hats Market – Revenue and Forecast to 2031(US$ Million) – by End User
Table 78. South Korea: Caps and Hats Market – Revenue and Forecast to 2031(US$ Million) – by Distribution Channel
Table 79. Rest of APAC: Caps and Hats Market – Revenue and Forecast to 2031(US$ Million) – by Type
Table 80. Rest of APAC: Caps and Hats Market – Revenue and Forecast to 2031(US$ Million) – by Material
Table 81. Rest of APAC: Caps and Hats Market – Revenue and Forecast to 2031(US$ Million) – by End User
Table 82. Rest of APAC: Caps and Hats Market – Revenue and Forecast to 2031(US$ Million) – by Distribution Channel
Table 83. South and Central America: Caps and Hats Market – Revenue and Forecast to 2031(US$ Million) – by Type
Table 84. South and Central America: Caps and Hats Market – Revenue and Forecast to 2031(US$ Million) – by Material
Table 85. South and Central America: Caps and Hats Market – Revenue and Forecast to 2031(US$ Million) – by End User
Table 86. South and Central America: Caps and Hats Market – Revenue and Forecast to 2031(US$ Million) – by Distribution Channel
Table 87. South and Central America: Caps and Hats Market – Revenue and Forecast to 2031(US$ Million) – by Country
Table 88. Brazil: Caps and Hats Market – Revenue and Forecast to 2031(US$ Million) – by Type
Table 89. Brazil: Caps and Hats Market – Revenue and Forecast to 2031(US$ Million) – by Material
Table 90. Brazil: Caps and Hats Market – Revenue and Forecast to 2031(US$ Million) – by End User
Table 91. Brazil: Caps and Hats Market – Revenue and Forecast to 2031(US$ Million) – by Distribution Channel
Table 92. Argentina: Caps and Hats Market – Revenue and Forecast to 2031(US$ Million) – by Type
Table 93. Argentina: Caps and Hats Market – Revenue and Forecast to 2031(US$ Million) – by Material
Table 94. Argentina: Caps and Hats Market – Revenue and Forecast to 2031(US$ Million) – by End User
Table 95. Argentina: Caps and Hats Market – Revenue and Forecast to 2031(US$ Million) – by Distribution Channel
Table 96. Rest of South and Central America: Caps and Hats Market – Revenue and Forecast to 2031(US$ Million) – by Type
Table 97. Rest of South and Central America: Caps and Hats Market – Revenue and Forecast to 2031(US$ Million) – by Material
Table 98. Rest of South and Central America: Caps and Hats Market – Revenue and Forecast to 2031(US$ Million) – by End User
Table 99. Rest of South and Central America: Caps and Hats Market – Revenue and Forecast to 2031(US$ Million) – by Distribution Channel
Table 100. Middle East and Africa: Caps and Hats Market – Revenue and Forecast to 2031(US$ Million) – by Type
Table 101. Middle East and Africa: Caps and Hats Market – Revenue and Forecast to 2031(US$ Million) – by Material
Table 102. Middle East and Africa: Caps and Hats Market – Revenue and Forecast to 2031(US$ Million) – by End User
Table 103. Middle East and Africa: Caps and Hats Market – Revenue and Forecast to 2031(US$ Million) – by Distribution Channel
Table 104. Middle East and Africa: Caps and Hats Market – Revenue and Forecast to 2031(US$ Million) – by Country
Table 105. Saudi Arabia: Caps and Hats Market – Revenue and Forecast to 2031(US$ Million) – by Type
Table 106. Saudi Arabia: Caps and Hats Market – Revenue and Forecast to 2031(US$ Million) – by Material
Table 107. Saudi Arabia: Caps and Hats Market – Revenue and Forecast to 2031(US$ Million) – by End User
Table 108. Saudi Arabia: Caps and Hats Market – Revenue and Forecast to 2031(US$ Million) – by Distribution Channel
Table 109. United Arab Emirates: Caps and Hats Market – Revenue and Forecast to 2031(US$ Million) – by Type
Table 110. United Arab Emirates: Caps and Hats Market – Revenue and Forecast to 2031(US$ Million) – by Material
Table 111. United Arab Emirates: Caps and Hats Market – Revenue and Forecast to 2031(US$ Million) – by End User
Table 112. United Arab Emirates: Caps and Hats Market – Revenue and Forecast to 2031(US$ Million) – by Distribution Channel
Table 113. South Africa: Caps and Hats Market – Revenue and Forecast to 2031(US$ Million) – by Type
Table 114. South Africa: Caps and Hats Market – Revenue and Forecast to 2031(US$ Million) – by Material
Table 115. South Africa: Caps and Hats Market – Revenue and Forecast to 2031(US$ Million) – by End User
Table 116. South Africa: Caps and Hats Market – Revenue and Forecast to 2031(US$ Million) – by Distribution Channel
Table 117. Rest of Middle East and Africa: Caps and Hats Market – Revenue and Forecast to 2031(US$ Million) – by Type
Table 118. Rest of Middle East and Africa: Caps and Hats Market – Revenue and Forecast to 2031(US$ Million) – by Material
Table 119. Rest of Middle East and Africa: Caps and Hats Market – Revenue and Forecast to 2031(US$ Million) – by End User
Table 120. Rest of Middle East and Africa: Caps and Hats Market – Revenue and Forecast to 2031(US$ Million) – by Distribution Channel
List of Figures
Figure 1. Caps and Hats Market Segmentation, by Geography
Figure 2. Porter’s Analysis
Figure 3. Ecosystem: Caps and Hats Market
Figure 4. Impact Analysis of Drivers and Restraints
Figure 5. Caps and Hats Market Revenue (US$ Million), 2020–2031
Figure 6. Caps and Hats Market Share (%) – by Type (2023 and 2031)
Figure 7. Caps: Caps and Hats Market – Revenue and Forecast to 2031 (US$ Million)
Figure 8. Hats: Caps and Hats Market – Revenue and Forecast to 2031 (US$ Million)
Figure 9. Caps and Hats Market Share (%) – by Material (2023 and 2031)
Figure 10. Polyester: Caps and Hats Market – Revenue and Forecast to 2031 (US$ Million)
Figure 11. Cotton: Caps and Hats Market – Revenue and Forecast to 2031 (US$ Million)
Figure 12. Leather: Caps and Hats Market – Revenue and Forecast to 2031 (US$ Million)
Figure 13. Blends: Caps and Hats Market – Revenue and Forecast to 2031 (US$ Million)
Figure 14. Others: Caps and Hats Market – Revenue and Forecast to 2031 (US$ Million)
Figure 15. Caps and Hats Market Share (%) – by End User (2023 and 2031)
Figure 16. Men: Caps and Hats Market – Revenue and Forecast to 2031 (US$ Million)
Figure 17. Women: Caps and Hats Market – Revenue and Forecast to 2031 (US$ Million)
Figure 18. Unisex: Caps and Hats Market – Revenue and Forecast to 2031 (US$ Million)
Figure 19. Kids: Caps and Hats Market – Revenue and Forecast to 2031 (US$ Million)
Figure 20. Caps and Hats Market Share (%) – by Distribution Channel (2023 and 2031)
Figure 21. Supermarket and Hypermarket: Caps and Hats Market – Revenue and Forecast to 2031 (US$ Million)
Figure 22. Specialty Stores: Caps and Hats Market – Revenue and Forecast to 2031 (US$ Million)
Figure 23. Online Retail: Caps and Hats Market – Revenue and Forecast to 2031 (US$ Million)
Figure 24. Others: Caps and Hats Market – Revenue and Forecast to 2031 (US$ Million)
Figure 25. Caps and Hats Market Breakdown by Region, 2023 and 2031 (%)
Figure 26. North America: Caps and Hats Market – Revenue and Forecast to 2031(US$ Million)
Figure 27. North America: Caps and Hats Market Breakdown, by Type (2023 and 2031)
Figure 28. North America: Caps and Hats Market Breakdown, by Material (2023 and 2031)
Figure 29. North America: Caps and Hats Market Breakdown, by End User (2023 and 2031)
Figure 30. North America: Caps and Hats Market Breakdown, by Distribution Channel (2023 and 2031)
Figure 31. North America: Caps and Hats Market Breakdown, by Key Countries, 2023 and 2031 (%)
Figure 32. United States: Caps and Hats Market – Revenue and Forecast to 2031(US$ Million)
Figure 33. Canada: Caps and Hats Market – Revenue and Forecast to 2031(US$ Million)
Figure 34. Mexico: Caps and Hats Market – Revenue and Forecast to 2031(US$ Million)
Figure 35. Europe: Caps and Hats Market – Revenue and Forecast to 2031(US$ Million)
Figure 36. Europe: Caps and Hats Market Breakdown, by Type (2023 and 2031)
Figure 37. Europe: Caps and Hats Market Breakdown, by Material (2023 and 2031)
Figure 38. Europe: Caps and Hats Market Breakdown, by End User (2023 and 2031)
Figure 39. Europe: Caps and Hats Market Breakdown, by Distribution Channel (2023 and 2031)
Figure 40. Europe: Caps and Hats Market Breakdown, by Key Countries, 2023 and 2031 (%)
Figure 41. Germany: Caps and Hats Market – Revenue and Forecast to 2031(US$ Million)
Figure 42. UK: Caps and Hats Market – Revenue and Forecast to 2031(US$ Million)
Figure 43. France: Caps and Hats Market – Revenue and Forecast to 2031(US$ Million)
Figure 44. Italy: Caps and Hats Market – Revenue and Forecast to 2031(US$ Million)
Figure 45. Russia: Caps and Hats Market – Revenue and Forecast to 2031(US$ Million)
Figure 46. Rest of Europe: Caps and Hats Market – Revenue and Forecast to 2031(US$ Million)
Figure 47. Asia Pacific: Caps and Hats Market – Revenue and Forecast to 2031(US$ Million)
Figure 48. Asia Pacific: Caps and Hats Market Breakdown, by Type (2023 and 2031)
Figure 49. Asia Pacific: Caps and Hats Market Breakdown, by Material (2023 and 2031)
Figure 50. Asia Pacific: Caps and Hats Market Breakdown, by End User (2023 and 2031)
Figure 51. Asia Pacific: Caps and Hats Market Breakdown, by Distribution Channel (2023 and 2031)
Figure 52. Asia Pacific: Caps and Hats Market Breakdown, by Key Countries, 2023 and 2031 (%)
Figure 53. China: Caps and Hats Market – Revenue and Forecast to 2031(US$ Million)
Figure 54. Japan: Caps and Hats Market – Revenue and Forecast to 2031(US$ Million)
Figure 55. India: Caps and Hats Market – Revenue and Forecast to 2031(US$ Million)
Figure 56. Australia: Caps and Hats Market – Revenue and Forecast to 2031(US$ Million)
Figure 57. South Korea: Caps and Hats Market – Revenue and Forecast to 2031(US$ Million)
Figure 58. Rest of APAC: Caps and Hats Market – Revenue and Forecast to 2031(US$ Million)
Figure 59. South and Central America: Caps and Hats Market – Revenue and Forecast to 2031(US$ Million)
Figure 60. South and Central America: Caps and Hats Market Breakdown, by Type (2023 and 2031)
Figure 61. South and Central America: Caps and Hats Market Breakdown, by Material (2023 and 2031)
Figure 62. South and Central America: Caps and Hats Market Breakdown, by End User (2023 and 2031)
Figure 63. South and Central America: Caps and Hats Market Breakdown, by Distribution Channel (2023 and 2031)
Figure 64. South and Central America: Caps and Hats Market Breakdown, by Key Countries, 2023 and 2031 (%)
Figure 65. Brazil: Caps and Hats Market – Revenue and Forecast to 2031(US$ Million)
Figure 66. Argentina: Caps and Hats Market – Revenue and Forecast to 2031(US$ Million)
Figure 67. Rest of South and Central America: Caps and Hats Market – Revenue and Forecast to 2031(US$ Million)
Figure 68. Middle East and Africa: Caps and Hats Market – Revenue and Forecast to 2031(US$ Million)
Figure 69. Middle East and Africa: Caps and Hats Market Breakdown, by Type (2023 and 2031)
Figure 70. Middle East and Africa: Caps and Hats Market Breakdown, by Material (2023 and 2031)
Figure 71. Middle East and Africa: Caps and Hats Market Breakdown, by End User (2023 and 2031)
Figure 72. Middle East and Africa: Caps and Hats Market Breakdown, by Distribution Channel (2023 and 2031)
Figure 73. Middle East and Africa: Caps and Hats Market Breakdown, by Key Countries, 2023 and 2031 (%)
Figure 74. Saudi Arabia: Caps and Hats Market – Revenue and Forecast to 2031(US$ Million)
Figure 75. United Arab Emirates: Caps and Hats Market – Revenue and Forecast to 2031(US$ Million)
Figure 76. South Africa: Caps and Hats Market – Revenue and Forecast to 2031(US$ Million)
Figure 77. Rest of Middle East and Africa: Caps and Hats Market – Revenue and Forecast to 2031(US$ Million)
Figure 78. Heat Map Analysis
Figure 79. Company Positioning & Concentration
The List of Companies - Caps and Hats Market
- Nike Inc
- Adidas AG
- Under Armour Inc
- H&M Hennes & Mauritz AB
- New Era Cap
- Puma SE
- ADER
- YUPOONG INC
- Levi Strauss & Co
- Hooey
The Insight Partners performs research in 4 major stages: Data Collection & Secondary Research, Primary Research, Data Analysis and Data Triangulation & Final Review.
- Data Collection and Secondary Research:
As a market research and consulting firm operating from a decade, we have published many reports and advised several clients across the globe. First step for any study will start with an assessment of currently available data and insights from existing reports. Further, historical and current market information is collected from Investor Presentations, Annual Reports, SEC Filings, etc., and other information related to company’s performance and market positioning are gathered from Paid Databases (Factiva, Hoovers, and Reuters) and various other publications available in public domain.
Several associations trade associates, technical forums, institutes, societies and organizations are accessed to gain technical as well as market related insights through their publications such as research papers, blogs and press releases related to the studies are referred to get cues about the market. Further, white papers, journals, magazines, and other news articles published in the last 3 years are scrutinized and analyzed to understand the current market trends.
- Primary Research:
The primarily interview analysis comprise of data obtained from industry participants interview and answers to survey questions gathered by in-house primary team.
For primary research, interviews are conducted with industry experts/CEOs/Marketing Managers/Sales Managers/VPs/Subject Matter Experts from both demand and supply side to get a 360-degree view of the market. The primary team conducts several interviews based on the complexity of the markets to understand the various market trends and dynamics which makes research more credible and precise.
A typical research interview fulfils the following functions:
- Provides first-hand information on the market size, market trends, growth trends, competitive landscape, and outlook
- Validates and strengthens in-house secondary research findings
- Develops the analysis team’s expertise and market understanding
Primary research involves email interactions and telephone interviews for each market, category, segment, and sub-segment across geographies. The participants who typically take part in such a process include, but are not limited to:
- Industry participants: VPs, business development managers, market intelligence managers and national sales managers
- Outside experts: Valuation experts, research analysts and key opinion leaders specializing in the electronics and semiconductor industry.
Below is the breakup of our primary respondents by company, designation, and region:

Once we receive the confirmation from primary research sources or primary respondents, we finalize the base year market estimation and forecast the data as per the macroeconomic and microeconomic factors assessed during data collection.
- Data Analysis:
Once data is validated through both secondary as well as primary respondents, we finalize the market estimations by hypothesis formulation and factor analysis at regional and country level.
- 3.1 Macro-Economic Factor Analysis:
We analyse macroeconomic indicators such the gross domestic product (GDP), increase in the demand for goods and services across industries, technological advancement, regional economic growth, governmental policies, the influence of COVID-19, PEST analysis, and other aspects. This analysis aids in setting benchmarks for various nations/regions and approximating market splits. Additionally, the general trend of the aforementioned components aid in determining the market's development possibilities.
- 3.2 Country Level Data:
Various factors that are especially aligned to the country are taken into account to determine the market size for a certain area and country, including the presence of vendors, such as headquarters and offices, the country's GDP, demand patterns, and industry growth. To comprehend the market dynamics for the nation, a number of growth variables, inhibitors, application areas, and current market trends are researched. The aforementioned elements aid in determining the country's overall market's growth potential.
- 3.3 Company Profile:
The “Table of Contents” is formulated by listing and analyzing more than 25 - 30 companies operating in the market ecosystem across geographies. However, we profile only 10 companies as a standard practice in our syndicate reports. These 10 companies comprise leading, emerging, and regional players. Nonetheless, our analysis is not restricted to the 10 listed companies, we also analyze other companies present in the market to develop a holistic view and understand the prevailing trends. The “Company Profiles” section in the report covers key facts, business description, products & services, financial information, SWOT analysis, and key developments. The financial information presented is extracted from the annual reports and official documents of the publicly listed companies. Upon collecting the information for the sections of respective companies, we verify them via various primary sources and then compile the data in respective company profiles. The company level information helps us in deriving the base number as well as in forecasting the market size.
- 3.4 Developing Base Number:
Aggregation of sales statistics (2020-2022) and macro-economic factor, and other secondary and primary research insights are utilized to arrive at base number and related market shares for 2022. The data gaps are identified in this step and relevant market data is analyzed, collected from paid primary interviews or databases. On finalizing the base year market size, forecasts are developed on the basis of macro-economic, industry and market growth factors and company level analysis.
- Data Triangulation and Final Review:
The market findings and base year market size calculations are validated from supply as well as demand side. Demand side validations are based on macro-economic factor analysis and benchmarks for respective regions and countries. In case of supply side validations, revenues of major companies are estimated (in case not available) based on industry benchmark, approximate number of employees, product portfolio, and primary interviews revenues are gathered. Further revenue from target product/service segment is assessed to avoid overshooting of market statistics. In case of heavy deviations between supply and demand side values, all thes steps are repeated to achieve synchronization.
We follow an iterative model, wherein we share our research findings with Subject Matter Experts (SME’s) and Key Opinion Leaders (KOLs) until consensus view of the market is not formulated – this model negates any drastic deviation in the opinions of experts. Only validated and universally acceptable research findings are quoted in our reports.
We have important check points that we use to validate our research findings – which we call – data triangulation, where we validate the information, we generate from secondary sources with primary interviews and then we re-validate with our internal data bases and Subject matter experts. This comprehensive model enables us to deliver high quality, reliable data in shortest possible time.
 Get Free Sample For