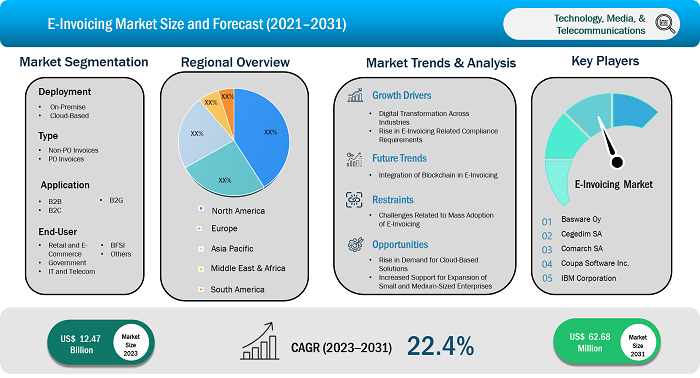
The e-invoicing market size is projected to reach US$ 62.68 billion by 2031 from US$ 12.47 billion in 2023. The market is expected to register a CAGR of 22.4% in 2023–2031.
The report includes growth prospects in light of current e-invoicing market trends and driving factors influencing the market growth.
E-Invoicing Market Analysis
The rising demand for digital solutions to combat tax evasion and financial fraud among government organizations and tax authorities is driving the growth in e-invoicing mandates in various countries. Various supportive initiatives taken by government organizations and associations, such as the European E-Invoicing Service Providers Association (EESPA), CEN, UN/CEFACT, OpenPEPPOL, and GS1, are playing a crucial role in driving the development of e-invoicing standards/frameworks/formats and adoption of e-invoicing across countries. In terms of e-invoicing adoption, Brazil, Chile, and Mexico are the market leaders, followed by countries such as Italy, which mandated e-invoicing in 2019. The successful implementation of e-invoicing in these countries and its benefits are driving other countries, such as Bolivia, France, Colombia, Guatemala, China, India, Kyrgyzstan, Uzbekistan, Vietnam, Croatia, Estonia, Serbia, and Portugal, to implement e-invoicing mandates.
E-invoicing Market Overview
E-invoicing is a growing market with rising adoption in various segments such as business-to-business (B2B), business-to-customer (B2C), and business-to-government (B2G). E-invoicing exclusively refers to the electronic invoice exchange between buyers and suppliers. Various countries define e-invoicing differently based on the regulations and nature of businesses prevalent in specific countries. For the exchange of e-invoices, various models are being used across industries, such as supplier direct model, buyer direct model, SaaS/PaaS model, network model, four corner model, multi-cloud model, and hybrid cloud model. Organizations across the world either exchange e-invoices directly with their customers or use third-party service providers. The growing trend of digitalizing various documents for efficient processing and compliance requirements is boosting the transition from manual paper-based invoices to electronic invoices on a global scale.
Customize Research To Suit Your Requirement
We can optimize and tailor the analysis and scope which is unmet through our standard offerings. This flexibility will help you gain the exact information needed for your business planning and decision making.
E-Invoicing Market: Strategic Insights
Market Size Value in US$ 4.84 Billion in 2019 Market Size Value by US$ 15.5 Billion by 2027 Growth rate CAGR of 16.2% from 2020-2027 Forecast Period 2020-2027 Base Year 2020

Naveen
Have a question?
Naveen will walk you through a 15-minute call to present the report’s content and answer all queries if you have any.
 Speak to Analyst
Customize Research To Suit Your Requirement
We can optimize and tailor the analysis and scope which is unmet through our standard offerings. This flexibility will help you gain the exact information needed for your business planning and decision making.
E-Invoicing Market: Strategic Insights
| Market Size Value in | US$ 4.84 Billion in 2019 |
| Market Size Value by | US$ 15.5 Billion by 2027 |
| Growth rate | CAGR of 16.2% from 2020-2027 |
| Forecast Period | 2020-2027 |
| Base Year | 2020 |
Naveen
Have a question?
Naveen will walk you through a 15-minute call to present the report’s content and answer all queries if you have any.
Speak to Analyst
E-Invoicing Market Drivers and Opportunities
Digital Transformation Across Industries to Favor Market
- Digital technologies are transforming industries worldwide and revolutionizing business processes for enhanced operational efficiency and reduced costs. Both large and small enterprises are investing in various digital technologies such as web apps, cloud computing, artificial intelligence, the Internet of Things, predictive analytics, and big data.
- Digital transformation and process automation have the potential to create unparalleled opportunities for businesses to create more value and increase revenue. In addition, government initiatives such as Digital India, Digital Government Strategy (US), and Digital Strategy 2025 (Germany) help bring digitalization to the country, leading to its adoption by several market players across various industries to improve operational efficiencies.
- Invoicing is a major function in all business segments, including B2B, B2C, and B2G, which requires a substantial number of resources in terms of manpower, time, and equipment. There are billions of invoices being generated across the globe on a daily basis, and only a fraction of this is in the form of electronic e-invoices. Hence, there is a huge potential for the e-invoicing market growth in the coming years. The present manual and paper-based invoice generation process results in human errors and reduces the overall productivity of a business. With the adoption of e-invoicing, businesses can save substantial costs related to generating and sending invoices to end customers.
- The automation of the invoicing process through e-invoicing will result in various strategic and operational benefits for buyers, suppliers, and managers. These benefits include reduced costs, increased accuracy, faster payments, enhanced productivity, environmental benefits, improved cash management, and improved compliance.
Rise in Demand for Cloud-Based Solutions
- Cloud computing is becoming the driving force for digital transformation across industries. The demand for cloud-based solutions across businesses is growing at an unprecedented rate owing to the advantages offered by these solutions over on-premise deployment. Major advantages of cloud-based solutions include easy deployment, interoperability, cost savings, high efficiency, and on-demand features.
- Services such as Infrastructure as a Service (IaaS) and Software as a Service (SaaS) are growing rapidly. However, the adoption of cloud-based solutions varies across geographies and businesses depending on factors such as regulatory environment and competitive scenarios.
- The demand for cloud-based solutions is high in small and medium enterprises owing to the cost benefits related to these solutions. Most large organizations are still using on-premise solutions as implementing new processes across large organizations and their networks is a complex task and requires changes in traditional work practices.
E-Invoicing Market Report Segmentation Analysis
Key segments that contributed to the derivation of the e-invoicing market analysis are deployment, end user, application, and type.
- By deployment model, the e-invoicing market is segmented into cloud and on-premise. In 2023, the cloud segment held a larger e-invoicing market share owing to advantages such as easy implementation, cost savings, and operational flexibility.
- Based on end user, the market is segmented into retail and e-commerce, government, IT and telecom, BFSI, and others. The government segment held the largest e-invoicing market share in 2023.
- Based on type, the e-invoicing market is segmented into PO invoices and non-PO invoices. In 2023, the non-PO invoices segment dominated the market with a larger market share and is expected to register a higher CAGR during the forecast period.
- Based on application, the e-invoicing market is categorized into B2B, B2C, and B2G. The B2G segment held the largest share of the global e-invoicing market, and the B2B segment is anticipated to be the fastest-growing segment over the forecast period.
E-Invoicing Market Share Analysis by Geography
- The e-invoicing market is segmented into five major regions—North America, Europe, Asia Pacific (APAC), the Middle East & Africa (MEA), and South and Central America. North America held the largest e-invoicing market share in 2023. In terms of market share, Europe, South and Central America, and APAC held second, third, and fourth place, respectively, in 2023.
- Europe is another crucial market for e-invoicing. Recently, Italy became the first country in Europe to mandate e-invoicing to combat tax fraud and tax evasion, as well as to increase the efficiency of the fiscal system. Other European countries are also expected to follow Italy and adopt e-invoicing, positively boosting the market.
E-Invoicing Market Report Scope
E-Invoicing Market News and Recent Developments
The e-invoicing market is evaluated by gathering qualitative and quantitative data post primary and secondary research, which includes important corporate publications, association data, and databases. The following is a list of developments in the market for e-invoicing:
- In 2021, Coupa Software, one of the leaders in business spend management (BSM), announced that it had become an official member of the E-Invoice Promotion Association (EIPA), an organization that develops, demonstrates, and promotes standard specifications of electronic invoices. (Source: Coupa Software, Press Release)
- In 2024, Basware, a global leader in AP automation and invoice processing, announced major global expansion plans as bookings rose by 52% and recurring revenue growth accelerated year-over-year (YoY) in 2023. (Source: Sweco AB, Press Release)
- In 2023, Toyota Boshoku Asia signed a contract with Comarch for the implementation of e-invoicing in Thailand. Comarch will support Toyota Boshoku Asia in setting up an e-invoicing solution for preparing, delivering, and storing digital documents, with digital signatures for tax invoices and receipts complying with Thailand's Revenue Department conditions and requirements. (Source: Toyota Boshoku, Press Release)
E-Invoicing Market Report Coverage and Deliverables
The "E-Invoicing Market Size and Forecast (2022–2030)" provides a detailed analysis of the market covering the areas mentioned below:
- Market size and forecast at global, regional, and country levels for all the key market segments covered under the scope
- Market dynamics such as drivers, restraints, and key opportunities
- Key future trends
- Detailed PEST/Porter's Five Forces and SWOT analysis
- Global and regional market analysis covering key market trends, major players, regulations, and recent market developments
- Industry landscape and competition analysis covering market concentration, heat map analysis, prominent players, and recent developments
- Detailed company profiles

Report Coverage
Revenue forecast, Company Analysis, Industry landscape, Growth factors, and Trends

Segment Covered
Type ; End User ; and Geography

Regional Scope
North America, Europe, Asia Pacific, Middle East & Africa, South & Central America

Country Scope
Argentina, Australia, Brazil, Canada, China, France, Germany, India, Italy, Japan, Mexico, Russian Federation, Saudi Arabia, South Africa, South Korea, United Arab Emirates, United Kingdom, United States
Frequently Asked Questions
Digital transformation across industries, rise in e-invoicing related compliance requirements, and growth of e-commerce industry are the major factors that propel the e-invoicing market.
The global e-invoicing market is expected to reach US$ 62.27 billion by 2031.
The global e-invoicing market was estimated to be US$ 12.47 billion in 2023 and is expected to grow at a CAGR of 22.4% during the forecast period 2023 - 2031.
The key players holding majority shares in the global e-invoicing market are Basware Corporation, Cegedim SA, Comarch SA, Coupa Software Inc, International Business Machines Corp, and Nipendo Ltd.
Integration of blockchain in e-invoicing is anticipated to play a significant role in the global e-invoicing market in the coming years.
The incremental growth expected to be recorded for the global e-invoicing market during the forecast period is US$ 50.20 billion.
1. Introduction
1.1 The Insight Partners Research Report Guidance
1.2 Market segmentation
2. Executive Summary
2.1 Key Insights
2.2 Market Attractiveness
3. Research Methodology
3.1 Coverage
3.2 Secondary Research
3.3 Primary Research
4. E-invoicing Market Landscape
4.1 Overview
4.2 PEST Analysis
4.3 Ecosystem Analysis
4.3.1 List of Vendors in the Value Chain
4.3.2 List of Vendors in the Value Chain:
5. E-invoicing Market – Key Market Dynamics
5.1 E-invoicing Market – Key Market Dynamics
5.1 Market Drivers
5.1.1 Digital Transformation Across Industries
5.1.2 Rise in E-Invoicing Related Compliance Requirements
5.1.3 Growth of E-Commerce Industry
5.2 Market Restraints
5.2.1 Challenges Related to Mass Adoption of E-Invoicing
5.3 Market Opportunities
5.3.1 Rise in Demand for Cloud-Based Solutions
5.3.2 Increased Support for Expansion of Small and Medium-Sized Enterprises
5.4 Future Trends
5.4.1 Integration of Blockchain in E-Invoicing
5.5 Impact of Drivers and Restraints:
6. E-invoicing Market – Global Market Analysis
6.1 E-invoicing Market Revenue (US$ million), 2023–2031
6.2 E-invoicing Market Forecast Analysis
7. E-invoicing Market Analysis – by Deployment
7.1 On-Premise
7.1.1 Overview
7.1.2 On-Premise: E-invoicing Market – Revenue and Forecast to 2031 (US$ million)
7.2 Cloud-Based
7.2.1 Overview
7.2.2 Cloud-Based: E-invoicing Market – Revenue and Forecast to 2031 (US$ million)
8. E-invoicing Market Analysis – by End-user
8.1 Retail and E-Commerce
8.1.1 Overview
8.1.2 Retail and E-Commerce: E-invoicing Market – Revenue and Forecast to 2031 (US$ million)
8.2 Government
8.2.1 Overview
8.2.2 Government: E-invoicing Market – Revenue and Forecast to 2031 (US$ million)
8.3 IT and Telecom
8.3.1 Overview
8.3.2 IT and Telecom: E-invoicing Market – Revenue and Forecast to 2031 (US$ million)
8.4 BFSI
8.4.1 Overview
8.4.2 BFSI: E-invoicing Market – Revenue and Forecast to 2031 (US$ million)
8.5 Others
8.5.1 Overview
8.5.2 Others: E-invoicing Market – Revenue and Forecast to 2031 (US$ million)
9. E-invoicing Market Analysis – by Application
9.1 B2B
9.1.1 Overview
9.1.2 B2B: E-invoicing Market – Revenue and Forecast to 2031 (US$ million)
9.2 B2C
9.2.1 Overview
9.2.2 B2C: E-invoicing Market – Revenue and Forecast to 2031 (US$ million)
9.3 B2G
9.3.1 Overview
9.3.2 B2G: E-invoicing Market – Revenue and Forecast to 2031 (US$ million)
10. E-invoicing Market Analysis – by Type
10.1 Non-PO Invoices
10.1.1 Overview
10.1.2 Non-PO Invoices: E-invoicing Market – Revenue and Forecast to 2031 (US$ million)
10.2 PO Invoices
10.2.1 Overview
10.2.2 PO Invoices: E-invoicing Market – Revenue and Forecast to 2031 (US$ million)
11. E-invoicing Market – Geographical Analysis
11.1 Overview
11.2 North America
11.2.1 North America E-invoicing Market Overview
11.2.2 North America: E-invoicing Market – Revenue and Forecast to 2031 (US$ million)
11.2.3 North America: E-invoicing Market Breakdown, by Deployment
11.2.3.1 North America: E-invoicing Market – Revenue and Forecast Analysis – by Deployment
11.2.4 North America: E-invoicing Market Breakdown, by End-user
11.2.4.1 North America: E-invoicing Market – Revenue and Forecast Analysis – by End-user
11.2.5 North America: E-invoicing Market Breakdown, by Application
11.2.5.1 North America: E-invoicing Market – Revenue and Forecast Analysis – by Application
11.2.6 North America: E-invoicing Market Breakdown, by Type
11.2.6.1 North America: E-invoicing Market – Revenue and Forecast Analysis – by Type
11.2.7 North America: E-invoicing Market – Revenue and Forecast Analysis – by Country
11.2.7.1 North America: E-invoicing Market – Revenue and Forecast Analysis – by Country
11.2.7.2 United States: E-invoicing Market – Revenue and Forecast to 2031 (US$ million)
11.2.7.2.1 United States: E-invoicing Market Breakdown, by Deployment
11.2.7.2.2 United States: E-invoicing Market Breakdown, by End-user
11.2.7.2.3 United States: E-invoicing Market Breakdown, by Application
11.2.7.2.4 United States: E-invoicing Market Breakdown, by Type
11.2.7.3 Canada: E-invoicing Market – Revenue and Forecast to 2031 (US$ million)
11.2.7.3.1 Canada: E-invoicing Market Breakdown, by Deployment
11.2.7.3.2 Canada: E-invoicing Market Breakdown, by End-user
11.2.7.3.3 Canada: E-invoicing Market Breakdown, by Application
11.2.7.3.4 Canada: E-invoicing Market Breakdown, by Type
11.2.7.4 Mexico: E-invoicing Market – Revenue and Forecast to 2031 (US$ million)
11.2.7.4.1 Mexico: E-invoicing Market Breakdown, by Deployment
11.2.7.4.2 Mexico: E-invoicing Market Breakdown, by End-user
11.2.7.4.3 Mexico: E-invoicing Market Breakdown, by Application
11.2.7.4.4 Mexico: E-invoicing Market Breakdown, by Type
11.3 Europe
11.3.1 Europe E-invoicing Market Overview
11.3.2 Europe: E-invoicing Market – Revenue and Forecast to 2031 (US$ million)
11.3.3 Europe: E-invoicing Market Breakdown, by Deployment
11.3.3.1 Europe: E-invoicing Market – Revenue and Forecast Analysis – by Deployment
11.3.4 Europe: E-invoicing Market Breakdown, by End-user
11.3.4.1 Europe: E-invoicing Market – Revenue and Forecast Analysis – by End-user
11.3.5 Europe: E-invoicing Market Breakdown, by Application
11.3.5.1 Europe: E-invoicing Market – Revenue and Forecast Analysis – by Application
11.3.6 Europe: E-invoicing Market Breakdown, by Type
11.3.6.1 Europe: E-invoicing Market – Revenue and Forecast Analysis – by Type
11.3.7 Europe: E-invoicing Market – Revenue and Forecast Analysis – by Country
11.3.7.1 Europe: E-invoicing Market – Revenue and Forecast Analysis – by Country
11.3.7.2 Germany: E-invoicing Market – Revenue and Forecast to 2031 (US$ million)
11.3.7.2.1 Germany: E-invoicing Market Breakdown, by Deployment
11.3.7.2.2 Germany: E-invoicing Market Breakdown, by End-user
11.3.7.2.3 Germany: E-invoicing Market Breakdown, by Application
11.3.7.2.4 Germany: E-invoicing Market Breakdown, by Type
11.3.7.3 United Kingdom: E-invoicing Market – Revenue and Forecast to 2031 (US$ million)
11.3.7.3.1 United Kingdom: E-invoicing Market Breakdown, by Deployment
11.3.7.3.2 United Kingdom: E-invoicing Market Breakdown, by End-user
11.3.7.3.3 United Kingdom: E-invoicing Market Breakdown, by Application
11.3.7.3.4 United Kingdom: E-invoicing Market Breakdown, by Type
11.3.7.4 France: E-invoicing Market – Revenue and Forecast to 2031 (US$ million)
11.3.7.4.1 France: E-invoicing Market Breakdown, by Deployment
11.3.7.4.2 France: E-invoicing Market Breakdown, by End-user
11.3.7.4.3 France: E-invoicing Market Breakdown, by Application
11.3.7.4.4 France: E-invoicing Market Breakdown, by Type
11.3.7.5 Italy: E-invoicing Market – Revenue and Forecast to 2031 (US$ million)
11.3.7.5.1 Italy: E-invoicing Market Breakdown, by Deployment
11.3.7.5.2 Italy: E-invoicing Market Breakdown, by End-user
11.3.7.5.3 Italy: E-invoicing Market Breakdown, by Application
11.3.7.5.4 Italy: E-invoicing Market Breakdown, by Type
11.3.7.6 Russia: E-invoicing Market – Revenue and Forecast to 2031 (US$ million)
11.3.7.6.1 Russia: E-invoicing Market Breakdown, by Deployment
11.3.7.6.2 Russia: E-invoicing Market Breakdown, by End-user
11.3.7.6.3 Russia: E-invoicing Market Breakdown, by Application
11.3.7.6.4 Russia: E-invoicing Market Breakdown, by Type
11.3.7.7 Rest of Europe: E-invoicing Market – Revenue and Forecast to 2031 (US$ million)
11.3.7.7.1 Rest of Europe: E-invoicing Market Breakdown, by Deployment
11.3.7.7.2 Rest of Europe: E-invoicing Market Breakdown, by End-user
11.3.7.7.3 Rest of Europe: E-invoicing Market Breakdown, by Application
11.3.7.7.4 Rest of Europe: E-invoicing Market Breakdown, by Type
11.4 Asia Pacific
11.4.1 Asia Pacific E-invoicing Market Overview
11.4.2 Asia Pacific: E-invoicing Market – Revenue and Forecast to 2031 (US$ million)
11.4.3 Asia Pacific: E-invoicing Market Breakdown, by Deployment
11.4.3.1 Asia Pacific: E-invoicing Market – Revenue and Forecast Analysis – by Deployment
11.4.4 Asia Pacific: E-invoicing Market Breakdown, by End-user
11.4.4.1 Asia Pacific: E-invoicing Market – Revenue and Forecast Analysis – by End-user
11.4.5 Asia Pacific: E-invoicing Market Breakdown, by Application
11.4.5.1 Asia Pacific: E-invoicing Market – Revenue and Forecast Analysis – by Application
11.4.6 Asia Pacific: E-invoicing Market Breakdown, by Type
11.4.6.1 Asia Pacific: E-invoicing Market – Revenue and Forecast Analysis – by Type
11.4.7 Asia Pacific: E-invoicing Market – Revenue and Forecast Analysis – by Country
11.4.7.1 Asia Pacific: E-invoicing Market – Revenue and Forecast Analysis – by Country
11.4.7.2 China: E-invoicing Market – Revenue and Forecast to 2031 (US$ million)
11.4.7.2.1 China: E-invoicing Market Breakdown, by Deployment
11.4.7.2.2 China: E-invoicing Market Breakdown, by End-user
11.4.7.2.3 China: E-invoicing Market Breakdown, by Application
11.4.7.2.4 China: E-invoicing Market Breakdown, by Type
11.4.7.3 Japan: E-invoicing Market – Revenue and Forecast to 2031 (US$ million)
11.4.7.3.1 Japan: E-invoicing Market Breakdown, by Deployment
11.4.7.3.2 Japan: E-invoicing Market Breakdown, by End-user
11.4.7.3.3 Japan: E-invoicing Market Breakdown, by Application
11.4.7.3.4 Japan: E-invoicing Market Breakdown, by Type
11.4.7.4 South Korea: E-invoicing Market – Revenue and Forecast to 2031 (US$ million)
11.4.7.4.1 South Korea: E-invoicing Market Breakdown, by Deployment
11.4.7.4.2 South Korea: E-invoicing Market Breakdown, by End-user
11.4.7.4.3 South Korea: E-invoicing Market Breakdown, by Application
11.4.7.4.4 South Korea: E-invoicing Market Breakdown, by Type
11.4.7.5 India: E-invoicing Market – Revenue and Forecast to 2031 (US$ million)
11.4.7.5.1 India: E-invoicing Market Breakdown, by Deployment
11.4.7.5.2 India: E-invoicing Market Breakdown, by End-user
11.4.7.5.3 India: E-invoicing Market Breakdown, by Application
11.4.7.5.4 India: E-invoicing Market Breakdown, by Type
11.4.7.6 Australia: E-invoicing Market – Revenue and Forecast to 2031 (US$ million)
11.4.7.6.1 Australia: E-invoicing Market Breakdown, by Deployment
11.4.7.6.2 Australia: E-invoicing Market Breakdown, by End-user
11.4.7.6.3 Australia: E-invoicing Market Breakdown, by Application
11.4.7.6.4 Australia: E-invoicing Market Breakdown, by Type
11.4.7.7 Rest of APAC: E-invoicing Market – Revenue and Forecast to 2031 (US$ million)
11.4.7.7.1 Rest of APAC: E-invoicing Market Breakdown, by Deployment
11.4.7.7.2 Rest of APAC: E-invoicing Market Breakdown, by End-user
11.4.7.7.3 Rest of APAC: E-invoicing Market Breakdown, by Application
11.4.7.7.4 Rest of APAC: E-invoicing Market Breakdown, by Type
11.5 Middle East and Africa
11.5.1 Middle East and Africa E-invoicing Market Overview
11.5.2 Middle East and Africa: E-invoicing Market – Revenue and Forecast to 2031 (US$ million)
11.5.3 Middle East and Africa: E-invoicing Market Breakdown, by Deployment
11.5.3.1 Middle East and Africa: E-invoicing Market – Revenue and Forecast Analysis – by Deployment
11.5.4 Middle East and Africa: E-invoicing Market Breakdown, by End-user
11.5.4.1 Middle East and Africa: E-invoicing Market – Revenue and Forecast Analysis – by End-user
11.5.5 Middle East and Africa: E-invoicing Market Breakdown, by Application
11.5.5.1 Middle East and Africa: E-invoicing Market – Revenue and Forecast Analysis – by Application
11.5.6 Middle East and Africa: E-invoicing Market Breakdown, by Type
11.5.6.1 Middle East and Africa: E-invoicing Market – Revenue and Forecast Analysis – by Type
11.5.7 Middle East and Africa: E-invoicing Market – Revenue and Forecast Analysis – by Country
11.5.7.1 Middle East and Africa: E-invoicing Market – Revenue and Forecast Analysis – by Country
11.5.7.2 South Africa: E-invoicing Market – Revenue and Forecast to 2031 (US$ million)
11.5.7.2.1 South Africa: E-invoicing Market Breakdown, by Deployment
11.5.7.2.2 South Africa: E-invoicing Market Breakdown, by End-user
11.5.7.2.3 South Africa: E-invoicing Market Breakdown, by Application
11.5.7.2.4 South Africa: E-invoicing Market Breakdown, by Type
11.5.7.3 Saudi Arabia: E-invoicing Market – Revenue and Forecast to 2031 (US$ million)
11.5.7.3.1 Saudi Arabia: E-invoicing Market Breakdown, by Deployment
11.5.7.3.2 Saudi Arabia: E-invoicing Market Breakdown, by End-user
11.5.7.3.3 Saudi Arabia: E-invoicing Market Breakdown, by Application
11.5.7.3.4 Saudi Arabia: E-invoicing Market Breakdown, by Type
11.5.7.4 United Arab Emirates: E-invoicing Market – Revenue and Forecast to 2031 (US$ million)
11.5.7.4.1 United Arab Emirates: E-invoicing Market Breakdown, by Deployment
11.5.7.4.2 United Arab Emirates: E-invoicing Market Breakdown, by End-user
11.5.7.4.3 United Arab Emirates: E-invoicing Market Breakdown, by Application
11.5.7.4.4 United Arab Emirates: E-invoicing Market Breakdown, by Type
11.5.7.5 Rest of Middle East and Africa: E-invoicing Market – Revenue and Forecast to 2031 (US$ million)
11.5.7.5.1 Rest of Middle East and Africa: E-invoicing Market Breakdown, by Deployment
11.5.7.5.2 Rest of Middle East and Africa: E-invoicing Market Breakdown, by End-user
11.5.7.5.3 Rest of Middle East and Africa: E-invoicing Market Breakdown, by Application
11.5.7.5.4 Rest of Middle East and Africa: E-invoicing Market Breakdown, by Type
11.6 South and Central America
11.6.1 South and Central America E-invoicing Market Overview
11.6.2 South and Central America: E-invoicing Market – Revenue and Forecast to 2031 (US$ million)
11.6.3 South and Central America: E-invoicing Market Breakdown, by Deployment
11.6.3.1 South and Central America: E-invoicing Market – Revenue and Forecast Analysis – by Deployment
11.6.4 South and Central America: E-invoicing Market Breakdown, by End-user
11.6.4.1 South and Central America: E-invoicing Market – Revenue and Forecast Analysis – by End-user
11.6.5 South and Central America: E-invoicing Market Breakdown, by Application
11.6.5.1 South and Central America: E-invoicing Market – Revenue and Forecast Analysis – by Application
11.6.6 South and Central America: E-invoicing Market Breakdown, by Type
11.6.6.1 South and Central America: E-invoicing Market – Revenue and Forecast Analysis – by Type
11.6.7 South and Central America: E-invoicing Market – Revenue and Forecast Analysis – by Country
11.6.7.1 South and Central America: E-invoicing Market – Revenue and Forecast Analysis – by Country
11.6.7.2 Brazil: E-invoicing Market – Revenue and Forecast to 2031 (US$ million)
11.6.7.2.1 Brazil: E-invoicing Market Breakdown, by Deployment
11.6.7.2.2 Brazil: E-invoicing Market Breakdown, by End-user
11.6.7.2.3 Brazil: E-invoicing Market Breakdown, by Application
11.6.7.2.4 Brazil: E-invoicing Market Breakdown, by Type
11.6.7.3 Argentina: E-invoicing Market – Revenue and Forecast to 2031 (US$ million)
11.6.7.3.1 Argentina: E-invoicing Market Breakdown, by Deployment
11.6.7.3.2 Argentina: E-invoicing Market Breakdown, by End-user
11.6.7.3.3 Argentina: E-invoicing Market Breakdown, by Application
11.6.7.3.4 Argentina: E-invoicing Market Breakdown, by Type
11.6.7.4 Rest of South and Central America: E-invoicing Market – Revenue and Forecast to 2031 (US$ million)
11.6.7.4.1 Rest of South and Central America: E-invoicing Market Breakdown, by Deployment
11.6.7.4.2 Rest of South and Central America: E-invoicing Market Breakdown, by End-user
11.6.7.4.3 Rest of South and Central America: E-invoicing Market Breakdown, by Application
11.6.7.4.4 Rest of South and Central America: E-invoicing Market Breakdown, by Type
12. Competitive Landscape
12.1 Heat Map Analysis By Key Players
12.2 Company Positioning & Concentration
13. Industry Landscape
13.1 Overview
13.2 Market Initiative
13.3 New Product Development
14. Company Profiles
14.1 Cegedim SA
14.1.1 Key Facts
14.1.2 Business Description
14.1.3 Products and Services
14.1.4 Financial Overview
14.1.5 SWOT Analysis
14.1.6 Key Developments
14.2 Sage Group Plc
14.2.1 Key Facts
14.2.2 Business Description
14.2.3 Products and Services
14.2.4 Financial Overview
14.2.5 SWOT Analysis
14.2.6 Key Developments
14.3 Comarch SA
14.3.1 Key Facts
14.3.2 Business Description
14.3.3 Products and Services
14.3.4 Financial Overview
14.3.5 SWOT Analysis
14.3.6 Key Developments
14.4 Nipendo Ltd
14.4.1 Key Facts
14.4.2 Business Description
14.4.3 Products and Services
14.4.4 Financial Overview
14.4.5 SWOT Analysis
14.4.6 Key Developments
14.5 Tradeshift
14.5.1 Key Facts
14.5.2 Business Description
14.5.3 Products and Services
14.5.4 Financial Overview
14.5.5 SWOT Analysis
14.5.6 Key Developments
14.6 Transcepta LLC
14.6.1 Key Facts
14.6.2 Business Description
14.6.3 Products and Services
14.6.4 Financial Overview
14.6.5 SWOT Analysis
14.6.6 Key Developments
14.7 Basware Corporation
14.7.1 Key Facts
14.7.2 Business Description
14.7.3 Products and Services
14.7.4 Financial Overview
14.7.5 SWOT Analysis
14.7.6 Key Developments
14.8 Coupa Software Inc
14.8.1 Key Facts
14.8.2 Business Description
14.8.3 Products and Services
14.8.4 Financial Overview
14.8.5 SWOT Analysis
14.8.6 Key Developments
14.9 International Business Machines Corp
14.9.1 Key Facts
14.9.2 Business Description
14.9.3 Products and Services
14.9.4 Financial Overview
14.9.5 SWOT Analysis
14.9.6 Key Developments
14.10 SAP SE
14.10.1 Key Facts
14.10.2 Business Description
14.10.3 Products and Services
14.10.4 Financial Overview
14.10.5 SWOT Analysis
14.10.6 Key Developments
15. Appendix
15.1 Glossary
15.2 About The Insight Partners
List of Tables
Table 1. E-invoicing Market segmentation
Table 2. E-invoicing Market – Revenue and Forecast to 2031 (US$ million)
Table 3. E-invoicing Market – Revenue and Forecast to 2031 (US$ million) – by Deployment
Table 4. E-invoicing Market – Revenue and Forecast to 2031 (US$ million) – by End-user
Table 5. E-invoicing Market – Revenue and Forecast to 2031 (US$ million) – by Application
Table 6. E-invoicing Market – Revenue and Forecast to 2031 (US$ million) – by Type
Table 7. North America: E-invoicing Market – Revenue and Forecast to 2031(US$ million) – by Deployment
Table 8. North America: E-invoicing Market – Revenue and Forecast to 2031(US$ million) – by End-user
Table 9. North America: E-invoicing Market – Revenue and Forecast to 2031(US$ million) – by Application
Table 10. North America: E-invoicing Market – Revenue and Forecast to 2031(US$ million) – by Type
Table 11. North America: E-invoicing Market – Revenue and Forecast to 2031(US$ million) – by Country
Table 12. United States: E-invoicing Market – Revenue and Forecast to 2031(US$ million) – by Deployment
Table 13. United States: E-invoicing Market – Revenue and Forecast to 2031(US$ million) – by End-user
Table 14. United States: E-invoicing Market – Revenue and Forecast to 2031(US$ million) – by Application
Table 15. United States: E-invoicing Market – Revenue and Forecast to 2031(US$ million) – by Type
Table 16. Canada: E-invoicing Market – Revenue and Forecast to 2031(US$ million) – by Deployment
Table 17. Canada: E-invoicing Market – Revenue and Forecast to 2031(US$ million) – by End-user
Table 18. Canada: E-invoicing Market – Revenue and Forecast to 2031(US$ million) – by Application
Table 19. Canada: E-invoicing Market – Revenue and Forecast to 2031(US$ million) – by Type
Table 20. Mexico: E-invoicing Market – Revenue and Forecast to 2031(US$ million) – by Deployment
Table 21. Mexico: E-invoicing Market – Revenue and Forecast to 2031(US$ million) – by End-user
Table 22. Mexico: E-invoicing Market – Revenue and Forecast to 2031(US$ million) – by Application
Table 23. Mexico: E-invoicing Market – Revenue and Forecast to 2031(US$ million) – by Type
Table 24. Europe: E-invoicing Market – Revenue and Forecast to 2031(US$ million) – by Deployment
Table 25. Europe: E-invoicing Market – Revenue and Forecast to 2031(US$ million) – by End-user
Table 26. Europe: E-invoicing Market – Revenue and Forecast to 2031(US$ million) – by Application
Table 27. Europe: E-invoicing Market – Revenue and Forecast to 2031(US$ million) – by Type
Table 28. Europe: E-invoicing Market – Revenue and Forecast to 2031(US$ million) – by Country
Table 29. Germany: E-invoicing Market – Revenue and Forecast to 2031(US$ million) – by Deployment
Table 30. Germany: E-invoicing Market – Revenue and Forecast to 2031(US$ million) – by End-user
Table 31. Germany: E-invoicing Market – Revenue and Forecast to 2031(US$ million) – by Application
Table 32. Germany: E-invoicing Market – Revenue and Forecast to 2031(US$ million) – by Type
Table 33. United Kingdom: E-invoicing Market – Revenue and Forecast to 2031(US$ million) – by Deployment
Table 34. United Kingdom: E-invoicing Market – Revenue and Forecast to 2031(US$ million) – by End-user
Table 35. United Kingdom: E-invoicing Market – Revenue and Forecast to 2031(US$ million) – by Application
Table 36. United Kingdom: E-invoicing Market – Revenue and Forecast to 2031(US$ million) – by Type
Table 37. France: E-invoicing Market – Revenue and Forecast to 2031(US$ million) – by Deployment
Table 38. France: E-invoicing Market – Revenue and Forecast to 2031(US$ million) – by End-user
Table 39. France: E-invoicing Market – Revenue and Forecast to 2031(US$ million) – by Application
Table 40. France: E-invoicing Market – Revenue and Forecast to 2031(US$ million) – by Type
Table 41. Italy: E-invoicing Market – Revenue and Forecast to 2031(US$ million) – by Deployment
Table 42. Italy: E-invoicing Market – Revenue and Forecast to 2031(US$ million) – by End-user
Table 43. Italy: E-invoicing Market – Revenue and Forecast to 2031(US$ million) – by Application
Table 44. Italy: E-invoicing Market – Revenue and Forecast to 2031(US$ million) – by Type
Table 45. Russia: E-invoicing Market – Revenue and Forecast to 2031(US$ million) – by Deployment
Table 46. Russia: E-invoicing Market – Revenue and Forecast to 2031(US$ million) – by End-user
Table 47. Russia: E-invoicing Market – Revenue and Forecast to 2031(US$ million) – by Application
Table 48. Russia: E-invoicing Market – Revenue and Forecast to 2031(US$ million) – by Type
Table 49. Rest of Europe: E-invoicing Market – Revenue and Forecast to 2031(US$ million) – by Deployment
Table 50. Rest of Europe: E-invoicing Market – Revenue and Forecast to 2031(US$ million) – by End-user
Table 51. Rest of Europe: E-invoicing Market – Revenue and Forecast to 2031(US$ million) – by Application
Table 52. Rest of Europe: E-invoicing Market – Revenue and Forecast to 2031(US$ million) – by Type
Table 53. Asia Pacific: E-invoicing Market – Revenue and Forecast to 2031(US$ million) – by Deployment
Table 54. Asia Pacific: E-invoicing Market – Revenue and Forecast to 2031(US$ million) – by End-user
Table 55. Asia Pacific: E-invoicing Market – Revenue and Forecast to 2031(US$ million) – by Application
Table 56. Asia Pacific: E-invoicing Market – Revenue and Forecast to 2031(US$ million) – by Type
Table 57. Asia Pacific: E-invoicing Market – Revenue and Forecast to 2031(US$ million) – by Country
Table 58. China: E-invoicing Market – Revenue and Forecast to 2031(US$ million) – by Deployment
Table 59. China: E-invoicing Market – Revenue and Forecast to 2031(US$ million) – by End-user
Table 60. China: E-invoicing Market – Revenue and Forecast to 2031(US$ million) – by Application
Table 61. China: E-invoicing Market – Revenue and Forecast to 2031(US$ million) – by Type
Table 62. Japan: E-invoicing Market – Revenue and Forecast to 2031(US$ million) – by Deployment
Table 63. Japan: E-invoicing Market – Revenue and Forecast to 2031(US$ million) – by End-user
Table 64. Japan: E-invoicing Market – Revenue and Forecast to 2031(US$ million) – by Application
Table 65. Japan: E-invoicing Market – Revenue and Forecast to 2031(US$ million) – by Type
Table 66. South Korea: E-invoicing Market – Revenue and Forecast to 2031(US$ million) – by Deployment
Table 67. South Korea: E-invoicing Market – Revenue and Forecast to 2031(US$ million) – by End-user
Table 68. South Korea: E-invoicing Market – Revenue and Forecast to 2031(US$ million) – by Application
Table 69. South Korea: E-invoicing Market – Revenue and Forecast to 2031(US$ million) – by Type
Table 70. India: E-invoicing Market – Revenue and Forecast to 2031(US$ million) – by Deployment
Table 71. India: E-invoicing Market – Revenue and Forecast to 2031(US$ million) – by End-user
Table 72. India: E-invoicing Market – Revenue and Forecast to 2031(US$ million) – by Application
Table 73. India: E-invoicing Market – Revenue and Forecast to 2031(US$ million) – by Type
Table 74. Australia: E-invoicing Market – Revenue and Forecast to 2031(US$ million) – by Deployment
Table 75. Australia: E-invoicing Market – Revenue and Forecast to 2031(US$ million) – by End-user
Table 76. Australia: E-invoicing Market – Revenue and Forecast to 2031(US$ million) – by Application
Table 77. Australia: E-invoicing Market – Revenue and Forecast to 2031(US$ million) – by Type
Table 78. Rest of APAC: E-invoicing Market – Revenue and Forecast to 2031(US$ million) – by Deployment
Table 79. Rest of APAC: E-invoicing Market – Revenue and Forecast to 2031(US$ million) – by End-user
Table 80. Rest of APAC: E-invoicing Market – Revenue and Forecast to 2031(US$ million) – by Application
Table 81. Rest of APAC: E-invoicing Market – Revenue and Forecast to 2031(US$ million) – by Type
Table 82. Middle East and Africa: E-invoicing Market – Revenue and Forecast to 2031(US$ million) – by Deployment
Table 83. Middle East and Africa: E-invoicing Market – Revenue and Forecast to 2031(US$ million) – by End-user
Table 84. Middle East and Africa: E-invoicing Market – Revenue and Forecast to 2031(US$ million) – by Application
Table 85. Middle East and Africa: E-invoicing Market – Revenue and Forecast to 2031(US$ million) – by Type
Table 86. Middle East and Africa: E-invoicing Market – Revenue and Forecast to 2031(US$ million) – by Country
Table 87. South Africa: E-invoicing Market – Revenue and Forecast to 2031(US$ million) – by Deployment
Table 88. South Africa: E-invoicing Market – Revenue and Forecast to 2031(US$ million) – by End-user
Table 89. South Africa: E-invoicing Market – Revenue and Forecast to 2031(US$ million) – by Application
Table 90. South Africa: E-invoicing Market – Revenue and Forecast to 2031(US$ million) – by Type
Table 91. Saudi Arabia: E-invoicing Market – Revenue and Forecast to 2031(US$ million) – by Deployment
Table 92. Saudi Arabia: E-invoicing Market – Revenue and Forecast to 2031(US$ million) – by End-user
Table 93. Saudi Arabia: E-invoicing Market – Revenue and Forecast to 2031(US$ million) – by Application
Table 94. Saudi Arabia: E-invoicing Market – Revenue and Forecast to 2031(US$ million) – by Type
Table 95. United Arab Emirates: E-invoicing Market – Revenue and Forecast to 2031(US$ million) – by Deployment
Table 96. United Arab Emirates: E-invoicing Market – Revenue and Forecast to 2031(US$ million) – by End-user
Table 97. United Arab Emirates: E-invoicing Market – Revenue and Forecast to 2031(US$ million) – by Application
Table 98. United Arab Emirates: E-invoicing Market – Revenue and Forecast to 2031(US$ million) – by Type
Table 99. Rest of Middle East and Africa: E-invoicing Market – Revenue and Forecast to 2031(US$ million) – by Deployment
Table 100. Rest of Middle East and Africa: E-invoicing Market – Revenue and Forecast to 2031(US$ million) – by End-user
Table 101. Rest of Middle East and Africa: E-invoicing Market – Revenue and Forecast to 2031(US$ million) – by Application
Table 102. Rest of Middle East and Africa: E-invoicing Market – Revenue and Forecast to 2031(US$ million) – by Type
Table 103. South and Central America: E-invoicing Market – Revenue and Forecast to 2031(US$ million) – by Deployment
Table 104. South and Central America: E-invoicing Market – Revenue and Forecast to 2031(US$ million) – by End-user
Table 105. South and Central America: E-invoicing Market – Revenue and Forecast to 2031(US$ million) – by Application
Table 106. South and Central America: E-invoicing Market – Revenue and Forecast to 2031(US$ million) – by Type
Table 107. South and Central America: E-invoicing Market – Revenue and Forecast to 2031(US$ million) – by Country
Table 108. Brazil: E-invoicing Market – Revenue and Forecast to 2031(US$ million) – by Deployment
Table 109. Brazil: E-invoicing Market – Revenue and Forecast to 2031(US$ million) – by End-user
Table 110. Brazil: E-invoicing Market – Revenue and Forecast to 2031(US$ million) – by Application
Table 111. Brazil: E-invoicing Market – Revenue and Forecast to 2031(US$ million) – by Type
Table 112. Argentina: E-invoicing Market – Revenue and Forecast to 2031(US$ million) – by Deployment
Table 113. Argentina: E-invoicing Market – Revenue and Forecast to 2031(US$ million) – by End-user
Table 114. Argentina: E-invoicing Market – Revenue and Forecast to 2031(US$ million) – by Application
Table 115. Argentina: E-invoicing Market – Revenue and Forecast to 2031(US$ million) – by Type
Table 116. Rest of South and Central America: E-invoicing Market – Revenue and Forecast to 2031(US$ million) – by Deployment
Table 117. Rest of South and Central America: E-invoicing Market – Revenue and Forecast to 2031(US$ million) – by End-user
Table 118. Rest of South and Central America: E-invoicing Market – Revenue and Forecast to 2031(US$ million) – by Application
Table 119. Rest of South and Central America: E-invoicing Market – Revenue and Forecast to 2031(US$ million) – by Type
Table 120. Heat Map Analysis By Key Players
List of Figures
Figure 1. E-invoicing Market segmentation, by Geography
Figure 2. PEST Analysis
Figure 3. E-Invoicing Market – Ecosystem Analysis
Figure 4. Impact Analysis of Drivers and Restraints
Figure 5. E-invoicing Market Revenue (US$ million), 2023–2031
Figure 6. E-invoicing Market Share (%) – by Deployment (2023 and 2031)
Figure 7. On-Premise: E-invoicing Market – Revenue and Forecast to 2031 (US$ million)
Figure 8. Cloud-Based: E-invoicing Market – Revenue and Forecast to 2031 (US$ million)
Figure 9. E-invoicing Market Share (%) – by End-user (2023 and 2031)
Figure 10. Retail and E-Commerce: E-invoicing Market – Revenue and Forecast to 2031 (US$ million)
Figure 11. Government: E-invoicing Market – Revenue and Forecast to 2031 (US$ million)
Figure 12. IT and Telecom: E-invoicing Market – Revenue and Forecast to 2031 (US$ million)
Figure 13. BFSI: E-invoicing Market – Revenue and Forecast to 2031 (US$ million)
Figure 14. Others: E-invoicing Market – Revenue and Forecast to 2031 (US$ million)
Figure 15. E-invoicing Market Share (%) – by Application (2023 and 2031)
Figure 16. B2B: E-invoicing Market – Revenue and Forecast to 2031 (US$ million)
Figure 17. B2C: E-invoicing Market – Revenue and Forecast to 2031 (US$ million)
Figure 18. B2G: E-invoicing Market – Revenue and Forecast to 2031 (US$ million)
Figure 19. E-invoicing Market Share (%) – by Type (2023 and 2031)
Figure 20. Non-PO Invoices: E-invoicing Market – Revenue and Forecast to 2031 (US$ million)
Figure 21. PO Invoices: E-invoicing Market – Revenue and Forecast to 2031 (US$ million)
Figure 22. E-invoicing Market Breakdown by Region, 2023 and 2031 (%)
Figure 23. North America: E-invoicing Market – Revenue and Forecast to 2031(US$ million)
Figure 24. North America: E-invoicing Market Breakdown, by Deployment (2023 and 2031)
Figure 25. North America: E-invoicing Market Breakdown, by End-user (2023 and 2031)
Figure 26. North America: E-invoicing Market Breakdown, by Application (2023 and 2031)
Figure 27. North America: E-invoicing Market Breakdown, by Type (2023 and 2031)
Figure 28. North America: E-invoicing Market Breakdown, by Key Countries, 2023 and 2031 (%)
Figure 29. United States: E-invoicing Market – Revenue and Forecast to 2031(US$ million)
Figure 30. Canada: E-invoicing Market – Revenue and Forecast to 2031(US$ million)
Figure 31. Mexico: E-invoicing Market – Revenue and Forecast to 2031(US$ million)
Figure 32. Europe: E-invoicing Market – Revenue and Forecast to 2031(US$ million)
Figure 33. Europe: E-invoicing Market Breakdown, by Deployment (2023 and 2031)
Figure 34. Europe: E-invoicing Market Breakdown, by End-user (2023 and 2031)
Figure 35. Europe: E-invoicing Market Breakdown, by Application (2023 and 2031)
Figure 36. Europe: E-invoicing Market Breakdown, by Type (2023 and 2031)
Figure 37. Europe: E-invoicing Market Breakdown, by Key Countries, 2023 and 2031 (%)
Figure 38. Germany: E-invoicing Market – Revenue and Forecast to 2031(US$ million)
Figure 39. United Kingdom: E-invoicing Market – Revenue and Forecast to 2031(US$ million)
Figure 40. France: E-invoicing Market – Revenue and Forecast to 2031(US$ million)
Figure 41. Italy: E-invoicing Market – Revenue and Forecast to 2031(US$ million)
Figure 42. Russia: E-invoicing Market – Revenue and Forecast to 2031(US$ million)
Figure 43. Rest of Europe: E-invoicing Market – Revenue and Forecast to 2031(US$ million)
Figure 44. Asia Pacific: E-invoicing Market – Revenue and Forecast to 2031(US$ million)
Figure 45. Asia Pacific: E-invoicing Market Breakdown, by Deployment (2023 and 2031)
Figure 46. Asia Pacific: E-invoicing Market Breakdown, by End-user (2023 and 2031)
Figure 47. Asia Pacific: E-invoicing Market Breakdown, by Application (2023 and 2031)
Figure 48. Asia Pacific: E-invoicing Market Breakdown, by Type (2023 and 2031)
Figure 49. Asia Pacific: E-invoicing Market Breakdown, by Key Countries, 2023 and 2031 (%)
Figure 50. China: E-invoicing Market – Revenue and Forecast to 2031(US$ million)
Figure 51. Japan: E-invoicing Market – Revenue and Forecast to 2031(US$ million)
Figure 52. South Korea: E-invoicing Market – Revenue and Forecast to 2031(US$ million)
Figure 53. India: E-invoicing Market – Revenue and Forecast to 2031(US$ million)
Figure 54. Australia: E-invoicing Market – Revenue and Forecast to 2031(US$ million)
Figure 55. Rest of APAC: E-invoicing Market – Revenue and Forecast to 2031(US$ million)
Figure 56. Middle East and Africa: E-invoicing Market – Revenue and Forecast to 2031(US$ million)
Figure 57. Middle East and Africa: E-invoicing Market Breakdown, by Deployment (2023 and 2031)
Figure 58. Middle East and Africa: E-invoicing Market Breakdown, by End-user (2023 and 2031)
Figure 59. Middle East and Africa: E-invoicing Market Breakdown, by Application (2023 and 2031)
Figure 60. Middle East and Africa: E-invoicing Market Breakdown, by Type (2023 and 2031)
Figure 61. Middle East and Africa: E-invoicing Market Breakdown, by Key Countries, 2023 and 2031 (%)
Figure 62. South Africa: E-invoicing Market – Revenue and Forecast to 2031(US$ million)
Figure 63. Saudi Arabia: E-invoicing Market – Revenue and Forecast to 2031(US$ million)
Figure 64. United Arab Emirates: E-invoicing Market – Revenue and Forecast to 2031(US$ million)
Figure 65. Rest of Middle East and Africa: E-invoicing Market – Revenue and Forecast to 2031(US$ million)
Figure 66. South and Central America: E-invoicing Market – Revenue and Forecast to 2031(US$ million)
Figure 67. South and Central America: E-invoicing Market Breakdown, by Deployment (2023 and 2031)
Figure 68. South and Central America: E-invoicing Market Breakdown, by End-user (2023 and 2031)
Figure 69. South and Central America: E-invoicing Market Breakdown, by Application (2023 and 2031)
Figure 70. South and Central America: E-invoicing Market Breakdown, by Type (2023 and 2031)
Figure 71. South and Central America: E-invoicing Market Breakdown, by Key Countries, 2023 and 2031 (%)
Figure 72. Brazil: E-invoicing Market – Revenue and Forecast to 2031(US$ million)
Figure 73. Argentina: E-invoicing Market – Revenue and Forecast to 2031(US$ million)
Figure 74. Rest of South and Central America: E-invoicing Market – Revenue and Forecast to 2031(US$ million)
Figure 75. Company Positioning & Concentration
The List of Companies - E-Invoicing Market
- Cegedim SA
- Sage Group Plc
- Comarch SA
- Nipendo Ltd
- Tradeshift
- Transcepta LLC
- Basware Corporation
- Coupa Software Inc
- International Business Machines Corp
- SAP SE
The Insight Partners performs research in 4 major stages: Data Collection & Secondary Research, Primary Research, Data Analysis and Data Triangulation & Final Review.
- Data Collection and Secondary Research:
As a market research and consulting firm operating from a decade, we have published many reports and advised several clients across the globe. First step for any study will start with an assessment of currently available data and insights from existing reports. Further, historical and current market information is collected from Investor Presentations, Annual Reports, SEC Filings, etc., and other information related to company’s performance and market positioning are gathered from Paid Databases (Factiva, Hoovers, and Reuters) and various other publications available in public domain.
Several associations trade associates, technical forums, institutes, societies and organizations are accessed to gain technical as well as market related insights through their publications such as research papers, blogs and press releases related to the studies are referred to get cues about the market. Further, white papers, journals, magazines, and other news articles published in the last 3 years are scrutinized and analyzed to understand the current market trends.
- Primary Research:
The primarily interview analysis comprise of data obtained from industry participants interview and answers to survey questions gathered by in-house primary team.
For primary research, interviews are conducted with industry experts/CEOs/Marketing Managers/Sales Managers/VPs/Subject Matter Experts from both demand and supply side to get a 360-degree view of the market. The primary team conducts several interviews based on the complexity of the markets to understand the various market trends and dynamics which makes research more credible and precise.
A typical research interview fulfils the following functions:
- Provides first-hand information on the market size, market trends, growth trends, competitive landscape, and outlook
- Validates and strengthens in-house secondary research findings
- Develops the analysis team’s expertise and market understanding
Primary research involves email interactions and telephone interviews for each market, category, segment, and sub-segment across geographies. The participants who typically take part in such a process include, but are not limited to:
- Industry participants: VPs, business development managers, market intelligence managers and national sales managers
- Outside experts: Valuation experts, research analysts and key opinion leaders specializing in the electronics and semiconductor industry.
Below is the breakup of our primary respondents by company, designation, and region:

Once we receive the confirmation from primary research sources or primary respondents, we finalize the base year market estimation and forecast the data as per the macroeconomic and microeconomic factors assessed during data collection.
- Data Analysis:
Once data is validated through both secondary as well as primary respondents, we finalize the market estimations by hypothesis formulation and factor analysis at regional and country level.
- 3.1 Macro-Economic Factor Analysis:
We analyse macroeconomic indicators such the gross domestic product (GDP), increase in the demand for goods and services across industries, technological advancement, regional economic growth, governmental policies, the influence of COVID-19, PEST analysis, and other aspects. This analysis aids in setting benchmarks for various nations/regions and approximating market splits. Additionally, the general trend of the aforementioned components aid in determining the market's development possibilities.
- 3.2 Country Level Data:
Various factors that are especially aligned to the country are taken into account to determine the market size for a certain area and country, including the presence of vendors, such as headquarters and offices, the country's GDP, demand patterns, and industry growth. To comprehend the market dynamics for the nation, a number of growth variables, inhibitors, application areas, and current market trends are researched. The aforementioned elements aid in determining the country's overall market's growth potential.
- 3.3 Company Profile:
The “Table of Contents” is formulated by listing and analyzing more than 25 - 30 companies operating in the market ecosystem across geographies. However, we profile only 10 companies as a standard practice in our syndicate reports. These 10 companies comprise leading, emerging, and regional players. Nonetheless, our analysis is not restricted to the 10 listed companies, we also analyze other companies present in the market to develop a holistic view and understand the prevailing trends. The “Company Profiles” section in the report covers key facts, business description, products & services, financial information, SWOT analysis, and key developments. The financial information presented is extracted from the annual reports and official documents of the publicly listed companies. Upon collecting the information for the sections of respective companies, we verify them via various primary sources and then compile the data in respective company profiles. The company level information helps us in deriving the base number as well as in forecasting the market size.
- 3.4 Developing Base Number:
Aggregation of sales statistics (2020-2022) and macro-economic factor, and other secondary and primary research insights are utilized to arrive at base number and related market shares for 2022. The data gaps are identified in this step and relevant market data is analyzed, collected from paid primary interviews or databases. On finalizing the base year market size, forecasts are developed on the basis of macro-economic, industry and market growth factors and company level analysis.
- Data Triangulation and Final Review:
The market findings and base year market size calculations are validated from supply as well as demand side. Demand side validations are based on macro-economic factor analysis and benchmarks for respective regions and countries. In case of supply side validations, revenues of major companies are estimated (in case not available) based on industry benchmark, approximate number of employees, product portfolio, and primary interviews revenues are gathered. Further revenue from target product/service segment is assessed to avoid overshooting of market statistics. In case of heavy deviations between supply and demand side values, all thes steps are repeated to achieve synchronization.
We follow an iterative model, wherein we share our research findings with Subject Matter Experts (SME’s) and Key Opinion Leaders (KOLs) until consensus view of the market is not formulated – this model negates any drastic deviation in the opinions of experts. Only validated and universally acceptable research findings are quoted in our reports.
We have important check points that we use to validate our research findings – which we call – data triangulation, where we validate the information, we generate from secondary sources with primary interviews and then we re-validate with our internal data bases and Subject matter experts. This comprehensive model enables us to deliver high quality, reliable data in shortest possible time.
 Get Free Sample For