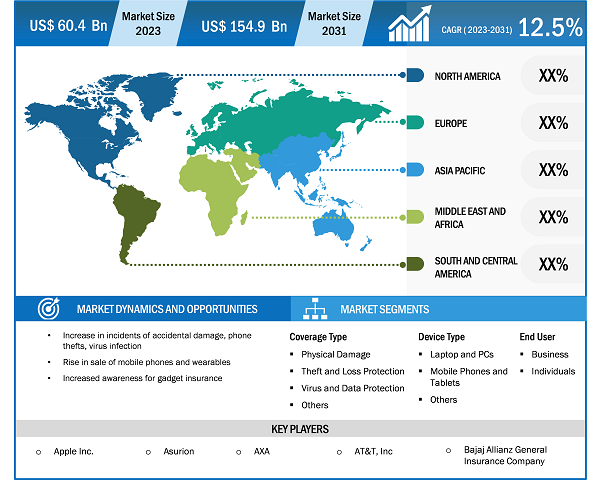
The electronic gadgets insurance market size is expected to grow from US$ 60.4 billion in 2023 to US$ 154.9 billion by 2031; it is anticipated to expand at a CAGR of 12.5% from 2023 to 2031. The market is influenced by the increase in the incidents of accidental damage and virus infection. Electronic gadget insurance offers users repair services.
Electronic Gadgets Insurance
Market Analysis
The growth of the electronic gadgets insurance market is primarily driven by factors such as an increase in incidents of accidental damage, phone thefts, virus infection, and device malfunction. Additionally, the surge in adoption of high-quality smartphones contributes to the market's expansion. The high replacement cost of various parts of gadgets also plays a significant role in driving the growth of the gadget insurance market. However, the decline in the sale of PCs due to the increased penetration of smartphones and tablets acts as a major restraint to market growth. Conversely, there is an expected surge in demand for innovative multiple gadget insurance services, which is expected to bring new electronic gadgets insurance market trends.
Electronic Gadgets Insurance
Industry Overview
- Gadget insurance is a contractual service that offers repair services for electronic gadgets sold by retailers and service providers. It typically includes additional coverage for unauthorized usage, malicious damage, e-wallet payments, and theft. Gadget insurance also provides coverage for the costs and inconveniences associated with mechanical and electrical failures. Furthermore, the rising trend among customers to "cover my gadget" has significantly contributed to the electronic gadgets insurance market growth.
- Gadget insurance can be obtained through different channels, such as retailers, service providers, or standalone insurance policies. It is worth noting that some existing insurance policies, like homeowners' or renters insurance, may already provide coverage for electronic devices under the personal property section. However, these policies may have limitations, such as not covering damages caused by accidents or only providing coverage up to a certain sublimit.
Customize Research To Suit Your Requirement
We can optimize and tailor the analysis and scope which is unmet through our standard offerings. This flexibility will help you gain the exact information needed for your business planning and decision making.
Electronic Gadgets Insurance Market: Strategic Insights
Market Size Value in US$ 60.4 billion in 2023 Market Size Value by US$ 154.9 billion by 2031 Growth rate CAGR of 12.5% from 2023 to 2031 Forecast Period 2023-2031 Base Year 2023

Naveen
Have a question?
Naveen will walk you through a 15-minute call to present the report’s content and answer all queries if you have any.
 Speak to Analyst
Customize Research To Suit Your Requirement
We can optimize and tailor the analysis and scope which is unmet through our standard offerings. This flexibility will help you gain the exact information needed for your business planning and decision making.
Electronic Gadgets Insurance Market: Strategic Insights
| Market Size Value in | US$ 60.4 billion in 2023 |
| Market Size Value by | US$ 154.9 billion by 2031 |
| Growth rate | CAGR of 12.5% from 2023 to 2031 |
| Forecast Period | 2023-2031 |
| Base Year | 2023 |
Naveen
Have a question?
Naveen will walk you through a 15-minute call to present the report’s content and answer all queries if you have any.
Speak to Analyst
Electronic Gadgets Insurance
Market Drivers and Opportunities
Increase in Incidents of Accidental Damage, Theft, and Device Malfunction to Drive the Electronic Gadgets Insurance
Market Growth
- Accidental damage is a common occurrence when it comes to electronic gadgets. With the growing use of smartphones, tablets, laptops, and other gadgets in our daily lives, the chances of accidental damage also increase. Accidents such as dropping the device, spilling liquids on it, or even a simple mishap can result in costly repairs or replacements. Therefore, individuals are more inclined to opt for gadget insurance to protect themselves from the financial burden of such incidents.
- Theft is another major concern for gadget owners. As the value and popularity of electronic devices continue to rise, they become attractive targets for thieves. The risk of having a gadget stolen is higher in public places, crowded areas, or even from homes or vehicles. Gadget insurance provides coverage against theft, ensuring that individuals are not left empty-handed if their device is stolen.
Electronic Gadgets Insurance
Market Report Segmentation Analysis
- Based on coverage type, the electronic gadgets insurance market forecast is segmented into physical damage, theft and loss protection, virus and data protection, and others.
- The physical damage segment is expected to hold a substantial electronic gadgets insurance market share in 2023 This can be attributed to several factors, including the increase in repairing and replacing costs of gadgets and the rise in awareness among the youth regarding physical damage coverage.
- The repairing and replacing costs of electronic gadgets have been on the rise. As gadgets become more advanced and sophisticated, the cost of repairing or replacing damaged components also increases. This includes expenses related to screen repairs, circuit board damages, or other physical damages. To avoid bearing these high costs themselves, individuals are opting for gadget insurance that covers physical damage. This coverage provides financial protection and peace of mind in case of accidental damage to their devices.
Electronic Gadgets Insurance
Market Share Analysis by Geography
The scope of the electronic gadgets insurance market report is primarily divided into five regions - North America, Europe, Asia Pacific, Middle East & Africa, and South America. North America is experiencing rapid growth and is anticipated to hold a significant electronic gadgets insurance market share. Firstly, there has been an increase in incidents of accidental device damage, phone thefts, virus infection, device malfunction, and other malicious activities in the region. With the growing reliance on electronic gadgets in daily life, the risk of such incidents has also increased. Additionally, North America has a significant number of smartphone users, with nearly 10% of global smartphone users residing in the region, amounting to 320 million users in 2020. The high number of smartphone users poses a greater risk of phone theft, especially in crowded areas such as public transport and festivals.
Electronic Gadgets Insurance
Market Report Scope
The "Electronic Gadgets Insurance Market Analysis" was carried out based on coverage type, device type, end users, and geography. By coverage type, it is segmented into physical damage, theft & loss protection, virus & data protection, and others. On the basis of device type, it is divided into laptop & PCs, mobile phones & tablets, and others. Based on end users, the market is segmented into business, and individuals. Based on geography, the market is segmented into North America, Europe, Asia Pacific, the Middle East & Africa, and South America.
Electronic Gadgets Insurance
Market News and Recent Developments
Companies adopt inorganic and organic strategies such as mergers and acquisitions in the market. A few recent key market developments are listed below:
- In November 2023, Chubb, the world's largest publicly traded property and casualty insurer, unveiled a new developer portal as part of its Chubb Studio global integration technology. This developer portal aims to simplify the process for its B2B2C partner companies to access and evaluate Chubb's digital insurance products and capabilities. With this initiative, Chubb aims to enhance collaboration and foster innovation within its partner ecosystem.
- In September 2022, Axa UK Retail introduced Moja, a digital-only insurance brand targeting customers who make purchases or utilize services through their smartphones or tablets. This launch aims to provide customers with the flexibility to customize their insurance coverage according to their specific requirements and financial capacities. Additionally, Moja offers various supplementary options, including coverage for personal belongings such as satnavs, audio equipment, and children's car seats, thereby enhancing its value proposition.
Electronic Gadgets Insurance
Market Report Coverage & Deliverables
The market report “Electronic Gadgets Insurance Market Size and Forecast (2021–2031)”, provides a detailed analysis of the market covering below areas-
- Market size & forecast at global, regional, and country- level for all the key market segments covered under the scope.
- Market dynamics such as drivers, restraints, and key opportunities.
- Key future trends.
- Detailed PEST & SWOT analysis
- Global and regional market analysis covering key market trends, key players, regulations, and recent market developments.
- Industry landscape and competition analysis covering market concentration, heat map analysis, key players, and recent developments.
- Detailed company profiles.

Report Coverage
Revenue forecast, Company Analysis, Industry landscape, Growth factors, and Trends

Segment Covered
Coverage Type, Device Type, End User, and Geography

Regional Scope
North America, Europe, Asia Pacific, Middle East & Africa, South & Central America

Country Scope
This text is related
to country scope.
Frequently Asked Questions
The key players holding the majority of shares in the global electronic gadgets insurance market are Apple Inc., Asurion, AXA, AT&T, Inc., and Bajaj Allianz General Insurance Company.
The global electronic gadgets insurance market is expected to reach US$ 154.9 billion by 2031.
The electronic gadgets insurance market size is expected to grow from US$ 60.4 billion in 2023 to US$ 154.9 billion by 2031; it is anticipated to expand at a CAGR of 12.5% from 2023 to 2031
Rapid technological advancements and corresponding increases in gadget prices are anticipated to play a significant role in the global electronic gadgets insurance market in the coming years.
The electronic gadgets insurance market is influenced by the increase in the incidents of accidental damage, and virus infection.
- Apple Inc.
- Asurion
- AXA
- AT&T Inc.
- Bajaj Allianz General Insurance Company
- Bolttech
- Chubb
- CloudClover Insurance
- Gadget Cover
- Samsung
The Insight Partners performs research in 4 major stages: Data Collection & Secondary Research, Primary Research, Data Analysis and Data Triangulation & Final Review.
- Data Collection and Secondary Research:
As a market research and consulting firm operating from a decade, we have published many reports and advised several clients across the globe. First step for any study will start with an assessment of currently available data and insights from existing reports. Further, historical and current market information is collected from Investor Presentations, Annual Reports, SEC Filings, etc., and other information related to company’s performance and market positioning are gathered from Paid Databases (Factiva, Hoovers, and Reuters) and various other publications available in public domain.
Several associations trade associates, technical forums, institutes, societies and organizations are accessed to gain technical as well as market related insights through their publications such as research papers, blogs and press releases related to the studies are referred to get cues about the market. Further, white papers, journals, magazines, and other news articles published in the last 3 years are scrutinized and analyzed to understand the current market trends.
- Primary Research:
The primarily interview analysis comprise of data obtained from industry participants interview and answers to survey questions gathered by in-house primary team.
For primary research, interviews are conducted with industry experts/CEOs/Marketing Managers/Sales Managers/VPs/Subject Matter Experts from both demand and supply side to get a 360-degree view of the market. The primary team conducts several interviews based on the complexity of the markets to understand the various market trends and dynamics which makes research more credible and precise.
A typical research interview fulfils the following functions:
- Provides first-hand information on the market size, market trends, growth trends, competitive landscape, and outlook
- Validates and strengthens in-house secondary research findings
- Develops the analysis team’s expertise and market understanding
Primary research involves email interactions and telephone interviews for each market, category, segment, and sub-segment across geographies. The participants who typically take part in such a process include, but are not limited to:
- Industry participants: VPs, business development managers, market intelligence managers and national sales managers
- Outside experts: Valuation experts, research analysts and key opinion leaders specializing in the electronics and semiconductor industry.
Below is the breakup of our primary respondents by company, designation, and region:

Once we receive the confirmation from primary research sources or primary respondents, we finalize the base year market estimation and forecast the data as per the macroeconomic and microeconomic factors assessed during data collection.
- Data Analysis:
Once data is validated through both secondary as well as primary respondents, we finalize the market estimations by hypothesis formulation and factor analysis at regional and country level.
- 3.1 Macro-Economic Factor Analysis:
We analyse macroeconomic indicators such the gross domestic product (GDP), increase in the demand for goods and services across industries, technological advancement, regional economic growth, governmental policies, the influence of COVID-19, PEST analysis, and other aspects. This analysis aids in setting benchmarks for various nations/regions and approximating market splits. Additionally, the general trend of the aforementioned components aid in determining the market's development possibilities.
- 3.2 Country Level Data:
Various factors that are especially aligned to the country are taken into account to determine the market size for a certain area and country, including the presence of vendors, such as headquarters and offices, the country's GDP, demand patterns, and industry growth. To comprehend the market dynamics for the nation, a number of growth variables, inhibitors, application areas, and current market trends are researched. The aforementioned elements aid in determining the country's overall market's growth potential.
- 3.3 Company Profile:
The “Table of Contents” is formulated by listing and analyzing more than 25 - 30 companies operating in the market ecosystem across geographies. However, we profile only 10 companies as a standard practice in our syndicate reports. These 10 companies comprise leading, emerging, and regional players. Nonetheless, our analysis is not restricted to the 10 listed companies, we also analyze other companies present in the market to develop a holistic view and understand the prevailing trends. The “Company Profiles” section in the report covers key facts, business description, products & services, financial information, SWOT analysis, and key developments. The financial information presented is extracted from the annual reports and official documents of the publicly listed companies. Upon collecting the information for the sections of respective companies, we verify them via various primary sources and then compile the data in respective company profiles. The company level information helps us in deriving the base number as well as in forecasting the market size.
- 3.4 Developing Base Number:
Aggregation of sales statistics (2020-2022) and macro-economic factor, and other secondary and primary research insights are utilized to arrive at base number and related market shares for 2022. The data gaps are identified in this step and relevant market data is analyzed, collected from paid primary interviews or databases. On finalizing the base year market size, forecasts are developed on the basis of macro-economic, industry and market growth factors and company level analysis.
- Data Triangulation and Final Review:
The market findings and base year market size calculations are validated from supply as well as demand side. Demand side validations are based on macro-economic factor analysis and benchmarks for respective regions and countries. In case of supply side validations, revenues of major companies are estimated (in case not available) based on industry benchmark, approximate number of employees, product portfolio, and primary interviews revenues are gathered. Further revenue from target product/service segment is assessed to avoid overshooting of market statistics. In case of heavy deviations between supply and demand side values, all thes steps are repeated to achieve synchronization.
We follow an iterative model, wherein we share our research findings with Subject Matter Experts (SME’s) and Key Opinion Leaders (KOLs) until consensus view of the market is not formulated – this model negates any drastic deviation in the opinions of experts. Only validated and universally acceptable research findings are quoted in our reports.
We have important check points that we use to validate our research findings – which we call – data triangulation, where we validate the information, we generate from secondary sources with primary interviews and then we re-validate with our internal data bases and Subject matter experts. This comprehensive model enables us to deliver high quality, reliable data in shortest possible time.
 Get Free Sample For