Europe Food Inclusions Market to Grow at a CAGR of 5.2% to reach US$ 5,364.23 Million from 2021 to 2028
The food inclusions market in Europe is expected to grow from US$ 3,760.95 million in 2021 to US$ 5,364.23 million by 2028; it is estimated to grow at a CAGR of 5.2% from 2021 to 2028.
It is crucial for the food & beverages industry players to differentiate their products from products offered by other players, along with adding value to their existing product line, to sustain market competition. Food & beverage manufacturers identify food inclusions as timesaving and economical way of bringing innovations in their existing products, as while using these ingredients they can skip the step of formulating an entirely new product recipe. Food inclusions are used as mix-ins in the existing product recipe to achieve an altered texture, color, aroma, or flavor. Food inclusions are widely being used in baked food, ice cream, yogurts, and others for attaining product differentiation. Further, various dried fruits, nuts, exotic fruits, and chocolate chips are added in the ice cream products to enhance their value and differentiate the products from their counterparts. Consumers, nowadays, prefer opting for unique, differentiating, and enhanced food products. Seasonal variants or limited-edition food products are being launched to attract a wider customer base. Food manufacturers use stand out colors, shaped inclusions, and indulgent inclusions in their products during Halloween and Easter to achieve product differentiation and stand out differently in the market. In April 2021, Marks and Spencer plc. issued a legal complaint against its supermarket rival, Aldi Stores Limited, on the grounds of copyright infringement. Marks and Spencer plc. sued Aldi Stores Limited on the claim that the latter’s Cuthbert the Caterpillar cake was similar to the former’s Colin the Caterpillar cake. Additionally, other supermarket chains such as Tesco, Sainsbury’s, ASDA, Morrison’s. Waitrose and Co-op also offer similar caterpillar cakes in terms of shape, base color, and size. However, the only factor differentiating their cakes are the food inclusions used in them. Thus, food inclusions are widely being used to add value and differentiate products from competitors, which is catalyzing the market growth.
In Europe, currently France and Russia are the hardest-hit countries by the coronavirus outbreak. It is estimated to suffer an economic hit due to a lack of revenue from various industries, Russia as the country recorded the highest number of coronavirus cases followed by the France, UK, Italy, Spain, and Germany. Other member states have implemented drastic measures and travel restrictions, including partially closing their borders. This is anticipated to impact market growth in Europe.
With the new features and technologies, vendors can attract new customers and expand their footprints in emerging markets. This factor is likely to drive the Europe food inclusions market. The Europe food inclusions market is expected to grow at a good CAGR during the forecast period.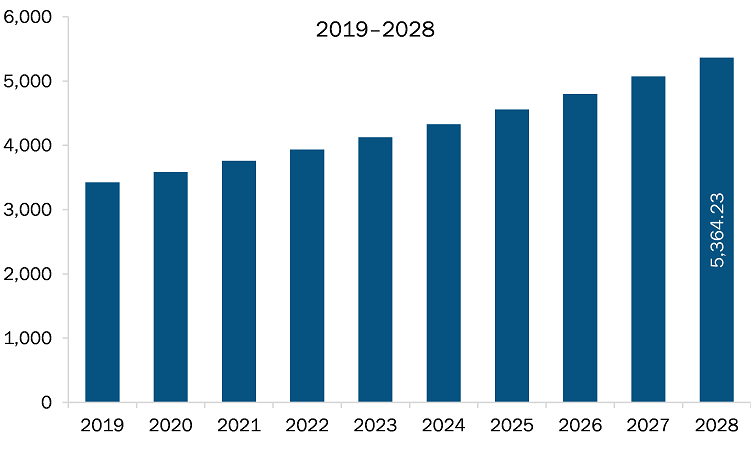
- Sample PDF showcases the content structure and the nature of the information with qualitative and quantitative analysis.
- Request discounts available for Start-Ups & Universities
Europe Food Inclusions Market Segmentation
Europe Food Inclusions Market – By Type
- Chocolates
- Fruit and Nuts
- Flavored Sugar and Caramels
- Others
Europe Food Inclusions Market – By Form
- Solid
- Semi-Solid
Europe Food Inclusions Market – By Application
- Dairy and Frozen Desserts
- Bakery Products
- Breakfast Cereals
- Chocolate and Confectionery Products
- Others
Europe Food Inclusions Market – By Country
- Germany
- France
- Italy
- U.K.
- Russia
- Rest of Europe
Europe Food Inclusions Market – Companies Mentioned
- ADM
- AGRANA Beteiligungs-AG
- Puratos
- Barry Callebaut
- Cargill, Incorporated.
- Kerry Group
- Georgia Nut Company
- Taura Natural Ingredients Ltd
- Sensient Technologies
- Meadow Foods

Report Coverage
Revenue forecast, Company Analysis, Industry landscape, Growth factors, and Trends

Segment Covered
Type, by Form, and Application

Regional Scope
North America, Europe, Asia Pacific, Middle East & Africa, South & Central America

Country Scope
UK, Germany, France, Italy, Russia
1. Introduction
1.1 Study Scope
1.2 The Insight Partners Research Report Guidance
1.3 Market Segmentation
1.3.1 Food Inclusions Market, by Type
1.3.2 Food Inclusions Market, by Form
1.3.3 Food Inclusions Market, by Application
1.3.4 Europe Food Inclusions Market, by Country
2. Key Takeaways
3. Research Methodology
3.1 Scope of the Study
3.2 Research Methodology
3.2.1 Data Collection:
3.2.2 Primary Interviews:
3.2.3 Hypothesis formulation:
3.2.4 Macro-economic factor analysis:
3.2.5 Developing base number:
3.2.6 Data Triangulation:
3.2.7 Country level data:
3.2.8 Assumptions and Limitations:
4. Europe Food Inclusions Market Landscape
4.1 Market Overview
4.2 Value Chain Analysis
4.2.1 Macadamia Nuts
4.2.2 Raw Material:
4.2.3 Manufacturing/Processing:
4.2.4 Packaging:
4.2.5 Caramel
4.3 Porter’s Five Forces Analysis
4.4 Expert Opinion
5. Europe Food Inclusions Market – Key Market Dynamics
5.1 Market Drivers
5.1.1 Wide Range of Application
5.1.2 Altering Focus Towards Value Addition to Achieve Product Differentiation
5.2 Market Restraints
5.2.1 Raising Production Costs of Food Products and Beverages
5.3 Market Opportunities
5.3.1 Growing Demand for Functional and Healthy Food Products
5.4 Future Trends
5.4.1 Ever Changing Consumer Preferences
5.5 Impact Analysis of Drivers and Restraint
6. Europe Food Inclusions – Market Analysis
6.1 Europe Food Inclusions Market Overview
6.2 Europe Food Inclusions Market –Revenue and Forecast to 2028 (US$ Million)
7. Europe Food Inclusions Market Analysis – By Type
7.1 Overview
7.2 Europe: Food Inclusions Market , by Type
7.3 Chocolates
7.3.1 Overview
7.3.2 Chocolates: Food Inclusions Market – Revenue, and Forecast to 2028 (US$ Million)
7.4 Fruit and Nuts
7.4.1 Overview
7.4.2 Fruit and Nuts: Food Inclusions Market – Revenue, and Forecast to 2028 (US$ Million)
7.5 Flavored Sugar and Caramels
7.5.1 Overview
7.5.2 Flavored Sugar and Caramels: Food Inclusions Market – Revenue, and Forecast to 2028 (US$ Million)
7.6 Others
7.6.1 Overview
7.6.2 Others: Food Inclusions Market – Revenue, and Forecast to 2028 (US$ Million)
8. Europe Food Inclusions Market Analysis – By Form
8.1 Overview
8.2 Europe: Food Inclusions Market, by Form
8.3 Solid
8.3.1 Overview
8.3.2 Solid: Food Inclusions Market – Revenue, and Forecast to 2028 (US$ Million)
8.4 Semi- Solid
8.4.1 Overview
8.4.2 Semi- Solid: Food Inclusions Market – Revenue, and Forecast to 2028 (US$ Million)
9. Europe Food Inclusions Market Analysis – By Application
9.1 Overview
9.2 Europe: Food Inclusions Market, by Application
9.3 Dairy and Frozen Desserts
9.3.1 Overview
9.3.2 Dairy and Frozen Desserts: Food Inclusions Market, Revenue and Forecast to 2028 (US$ Million)
9.4 Bakery Products
9.4.1 Overview
9.4.2 Bakery Products: Food Inclusions Market, Revenue and Forecast to 2028 (US$ Million)
9.5 Breakfast Cereals
9.5.1 Overview
9.5.2 Breakfast Cereals: Food Inclusions Market, Revenue and Forecast to 2028 (US$ Million)
9.6 Chocolate and Confectionery Products
9.6.1 Overview
9.6.2 Chocolate and Confectionery Products: Food Inclusions Market, Revenue and Forecast to 2028 (US$ Million)
9.7 Others
9.7.1 Overview
9.7.2 Others: Food Inclusions Market, Revenue and Forecast to 2028 (US$ Million)
10.1.1 Europe: Food Inclusions Market, by Country
10.1.1.1 Germany: Food Inclusions Market –Revenue and Forecast to 2028 (US$ Million)
10.1.1.1.1 Germany: Food Inclusions Market, by Type
10.1.1.1.2 Germany: Food Inclusions Market, by Form
10.1.1.1.3 Germany: Food Inclusions Market, by Application
10.1.1.2 France: Food Inclusions Market –Revenue and Forecast to 2028 (US$ Million)
10.1.1.2.1 France: Food Inclusions Market, by Type
10.1.1.2.2 France: Food Inclusions Market, by Form
10.1.1.2.3 France: Food Inclusions Market, by Application
10.1.1.3 Italy: Food Inclusions Market –Revenue and Forecast to 2028 (US$ Million)
10.1.1.3.1 Italy: Food Inclusions Market, by Type
10.1.1.3.2 Italy: Food Inclusions Market, by Form
10.1.1.3.3 Italy: Food Inclusions Market, by Application
10.1.1.4 UK: Food Inclusions Market –Revenue and Forecast to 2028 (US$ Million)
10.1.1.4.1 UK: Food Inclusions Market, by Type
10.1.1.4.2 UK: Food Inclusions Market, by Form
10.1.1.4.3 UK: Food Inclusions Market, by Application
10.1.1.5 Russia: Food Inclusions Market –Revenue and Forecast to 2028 (US$ Million)
10.1.1.5.1 Russia: Food Inclusions Market, by Type
10.1.1.5.2 Russia: Food Inclusions Market, by Form
10.1.1.5.3 Russia: Food Inclusions Market, by Application
10.1.1.6 Rest of Europe: Food Inclusions Market –Revenue and Forecast to 2028 (US$ Million)
10.1.1.6.1 Rest of Europe: Food Inclusions Market, by Type
10.1.1.6.2 Rest of Europe: Food Inclusions Market, by Form
10.1.1.6.3 Rest of Europe: Food Inclusions Market, by Application
11. Europe Food Inclusions Market – Impact of COVID-19
11.1 Overview
12. Industry Landscape
12.1 Overview
12.2 Mergers & acquisition
12.3 Product Launch
12.4 Partnership
12.5 Expansion
13. Company Profiles
13.1 ADM
13.1.1 Key Facts
13.1.2 Business Description
13.1.3 Products and Services
13.1.4 Financial Overview
13.1.5 SWOT Analysis
13.1.6 Key Developments
13.2 AGRANA Beteiligungs-AG
13.2.1 Key Facts
13.2.2 Business Description
13.2.3 Products and Services
13.2.4 Financial Overview
13.2.5 SWOT Analysis
13.2.6 Key Developments
13.3 PURATOS
13.3.1 Key Facts
13.3.2 Business Description
13.3.3 Products and Services
13.3.4 Financial Overview
13.3.5 SWOT Analysis
13.3.6 Key Developments
13.4 Barry Callebaut
13.4.1 Key Facts
13.4.2 Business Description
13.4.3 Products and Services
13.4.4 Financial Overview
13.4.5 SWOT Analysis
13.4.6 Key Developments
13.5 Cargill, Incorporated.
13.5.1 Key Facts
13.5.2 Business Description
13.5.3 Products and Services
13.5.4 Financial Overview
13.5.5 SWOT Analysis
13.5.6 Key Developments
13.6 Kerry Group
13.6.1 Key Facts
13.6.2 Business Description
13.6.3 Products and Services
13.6.4 Financial Overview
13.6.5 SWOT Analysis
13.6.6 Key Developments
13.7 Georgia Nut Company
13.7.1 Key Facts
13.7.2 Business Description
13.7.3 Products and Services
13.7.4 Financial Overview
13.7.5 SWOT Analysis
13.7.6 Key Developments
13.8 Taura Natural Ingredients Ltd.
13.8.1 Key Facts
13.8.2 Business Description
13.8.3 Products and Services
13.8.4 Financial Overview
13.8.5 SWOT Analysis
13.8.6 Key Developments
13.9 Meadow Foods
13.9.1 Key Facts
13.9.2 Business Description
13.9.3 Products and Services
13.9.4 Financial Overview
13.9.5 SWOT Analysis
13.9.6 Key Developments
13.10 Sensient Technologies
13.10.1 Key Facts
13.10.2 Business Description
13.10.3 Products and Services
13.10.4 Financial Overview
13.10.5 SWOT Analysis
13.10.6 Key Developments
14. Appendix
14.1 About The Insight Partners
14.2 Glossary of Terms
LIST OF TABLES
Table 1. Europe Food Inclusions Market –Revenue and Forecast to 2028 (US$ Million)
Table 2. Europe Food Inclusions Market, by Country – Revenue and Forecast to 2028 (US$ Million)
Table 3. Germany Food Inclusions Market, by Type – Revenue and Forecast to 2028 (US$ Million)
Table 4. Germany Food Inclusions Market, by Form – Revenue and Forecast to 2028 (US$ Million)
Table 5. Germany Food Inclusions Market, by Application – Revenue and Forecast to 2028 (US$ Million)
Table 6. France Food Inclusions Market, by Type – Revenue and Forecast to 2028 (US$ Million)
Table 7. France Food Inclusions Market, by Form– Revenue and Forecast to 2028 (US$ Million)
Table 8. France Food Inclusions Market, by Application– Revenue and Forecast to 2028 (US$ Million)
Table 9. Italy Food Inclusions Market, by Type – Revenue and Forecast to 2028 (US$ Million)
Table 10. Italy Food Inclusions Market, by Form – Revenue and Forecast to 2028 (US$ Million)
Table 11. Italy Food Inclusions Market, by Application – Revenue and Forecast to 2028 (US$ Million)
Table 12. UK Food Inclusions Market, by Type – Revenue and Forecast to 2028 (US$ Million)
Table 13. UK Food Inclusions Market, by Form – Revenue and Forecast to 2028 (US$ Million)
Table 14. UK Food Inclusions Market, by Application – Revenue and Forecast to 2028 (US$ Million)
Table 15. Russia Food Inclusions Market, by Type – Revenue and Forecast to 2028 (US$ Million)
Table 16. Russia Food Inclusions Market, by Form – Revenue and Forecast to 2028 (US$ Million)
Table 17. Russia Food Inclusions Market, by Application – Revenue and Forecast to 2028 (US$ Million)
Table 18. Rest of Europe Food Inclusions Market, by Type – Revenue and Forecast to 2028 (US$ Million)
Table 19. Rest of Europe Food Inclusions Market, by Form– Revenue and Forecast to 2028 (US$ Million)
Table 20. Rest of Europe Food Inclusions Market, by Application – Revenue and Forecast to 2028 (US$ Million)
Table 21. Glossary of Terms, Food Inclusions Market
LIST OF FIGURES
Figure 1. Food Inclusions Market Segmentation
Figure 2. Food Inclusions Market Segmentation – By Country
Figure 3. Europe Food Inclusions Market Overview
Figure 4. Chocolates Segment Held Largest Share of Europe Food Inclusions Market
Figure 5. Rest of Europe Region Held Largest Share of Europe Food Inclusions Market
Figure 6. Europe Food Inclusions Market, Industry Landscape
Figure 7. Value Chain: Macadamia Nuts
Figure 8. Value Chain: Caramel
Figure 9. Porter’s Five Forces Analysis
Figure 10. Expert Opinion
Figure 11. Food Inclusions Market Impact Analysis of Driver and Restraint
Figure 12. Europe Food Inclusions Market – Revenue and Forecast to 2028 (US$ Million)
Figure 13. Europe: Food Inclusions Market Revenue Share, by Type (2020 and 2028)
Figure 14. Chocolates: Food Inclusions Market – Revenue, and Forecast to 2028 (US$ Million)
Figure 15. Fruit and Nuts: Food Inclusions Market – Revenue, and Forecast to 2028 (US$ Million)
Figure 16. Flavored Sugar and Caramels: Food Inclusions Market – Revenue, and Forecast to 2028 (US$ Million)
Figure 17. Others: Food Inclusions Market – Revenue, and Forecast to 2028 (US$ Million)
Figure 18. Europe: Food Inclusions Market Revenue Share, by Form (2020 and 2028)
Figure 19. Solid: Food Inclusions Market – Revenue, and Forecast to 2028 (US$ Million)
Figure 20. Semi- Solid: Food Inclusions Market – Revenue, and Forecast to 2028 (US$ Million)
Figure 21. Europe: Food Inclusions Market Revenue Share, by Application (2020 and 2028)
Figure 22. Dairy and Frozen Desserts: Food Inclusions Market, Revenue and Forecast to 2028 (US$ Million)
Figure 23. Bakery Products: Food Inclusions Market, Revenue and Forecast to 2028 (US$ Million)
Figure 24. Breakfast Cereals: Food Inclusions Market, Revenue and Forecast to 2028 (US$ Million)
Figure 25. Chocolate and Confectionery Products: Food Inclusions Market, Revenue and Forecast to 2028 (US$ Million)
Figure 26. Others: Food Inclusions Market, Revenue and Forecast to 2028 (US$ Million)
Figure 27. Geographic Overview of Europe Food Inclusions Market
Figure 28. Europe: Food Inclusions Market Revenue Share, by Country (2020 and 2028)
Figure 29. Germany: Food Inclusions Market –Revenue and Forecast to 2028 (US$ Million)
Figure 30. France: Food Inclusions Market –Revenue and Forecast to 2028 (US$ Million)
Figure 31. Italy: Food Inclusions Market –Revenue and Forecast to 2028 (US$ Million)
Figure 32. UK: Food Inclusions Market –Revenue and Forecast to 2028 (US$ Million)
Figure 33. Russia: Food Inclusions Market –Revenue and Forecast to 2028 (US$ Million)
Figure 34. Rest of Europe: Food Inclusions Market –Revenue and Forecast to 2028 (US$ Million)
Figure 35. Impact of COVID-19 Pandemic in Europe
- ADM
- AGRANA Beteiligungs-AG
- Puratos
- Barry Callebaut
- Cargill, Incorporated.
- Kerry Group
- Georgia Nut Company
- Taura Natural Ingredients Ltd
- Sensient Technologies
- Meadow Foods
The Insight Partners performs research in 4 major stages: Data Collection & Secondary Research, Primary Research, Data Analysis and Data Triangulation & Final Review.
- Data Collection and Secondary Research:
As a market research and consulting firm operating from a decade, we have published many reports and advised several clients across the globe. First step for any study will start with an assessment of currently available data and insights from existing reports. Further, historical and current market information is collected from Investor Presentations, Annual Reports, SEC Filings, etc., and other information related to company’s performance and market positioning are gathered from Paid Databases (Factiva, Hoovers, and Reuters) and various other publications available in public domain.
Several associations trade associates, technical forums, institutes, societies and organizations are accessed to gain technical as well as market related insights through their publications such as research papers, blogs and press releases related to the studies are referred to get cues about the market. Further, white papers, journals, magazines, and other news articles published in the last 3 years are scrutinized and analyzed to understand the current market trends.
- Primary Research:
The primarily interview analysis comprise of data obtained from industry participants interview and answers to survey questions gathered by in-house primary team.
For primary research, interviews are conducted with industry experts/CEOs/Marketing Managers/Sales Managers/VPs/Subject Matter Experts from both demand and supply side to get a 360-degree view of the market. The primary team conducts several interviews based on the complexity of the markets to understand the various market trends and dynamics which makes research more credible and precise.
A typical research interview fulfils the following functions:
- Provides first-hand information on the market size, market trends, growth trends, competitive landscape, and outlook
- Validates and strengthens in-house secondary research findings
- Develops the analysis team’s expertise and market understanding
Primary research involves email interactions and telephone interviews for each market, category, segment, and sub-segment across geographies. The participants who typically take part in such a process include, but are not limited to:
- Industry participants: VPs, business development managers, market intelligence managers and national sales managers
- Outside experts: Valuation experts, research analysts and key opinion leaders specializing in the electronics and semiconductor industry.
Below is the breakup of our primary respondents by company, designation, and region:

Once we receive the confirmation from primary research sources or primary respondents, we finalize the base year market estimation and forecast the data as per the macroeconomic and microeconomic factors assessed during data collection.
- Data Analysis:
Once data is validated through both secondary as well as primary respondents, we finalize the market estimations by hypothesis formulation and factor analysis at regional and country level.
- 3.1 Macro-Economic Factor Analysis:
We analyse macroeconomic indicators such the gross domestic product (GDP), increase in the demand for goods and services across industries, technological advancement, regional economic growth, governmental policies, the influence of COVID-19, PEST analysis, and other aspects. This analysis aids in setting benchmarks for various nations/regions and approximating market splits. Additionally, the general trend of the aforementioned components aid in determining the market's development possibilities.
- 3.2 Country Level Data:
Various factors that are especially aligned to the country are taken into account to determine the market size for a certain area and country, including the presence of vendors, such as headquarters and offices, the country's GDP, demand patterns, and industry growth. To comprehend the market dynamics for the nation, a number of growth variables, inhibitors, application areas, and current market trends are researched. The aforementioned elements aid in determining the country's overall market's growth potential.
- 3.3 Company Profile:
The “Table of Contents” is formulated by listing and analyzing more than 25 - 30 companies operating in the market ecosystem across geographies. However, we profile only 10 companies as a standard practice in our syndicate reports. These 10 companies comprise leading, emerging, and regional players. Nonetheless, our analysis is not restricted to the 10 listed companies, we also analyze other companies present in the market to develop a holistic view and understand the prevailing trends. The “Company Profiles” section in the report covers key facts, business description, products & services, financial information, SWOT analysis, and key developments. The financial information presented is extracted from the annual reports and official documents of the publicly listed companies. Upon collecting the information for the sections of respective companies, we verify them via various primary sources and then compile the data in respective company profiles. The company level information helps us in deriving the base number as well as in forecasting the market size.
- 3.4 Developing Base Number:
Aggregation of sales statistics (2020-2022) and macro-economic factor, and other secondary and primary research insights are utilized to arrive at base number and related market shares for 2022. The data gaps are identified in this step and relevant market data is analyzed, collected from paid primary interviews or databases. On finalizing the base year market size, forecasts are developed on the basis of macro-economic, industry and market growth factors and company level analysis.
- Data Triangulation and Final Review:
The market findings and base year market size calculations are validated from supply as well as demand side. Demand side validations are based on macro-economic factor analysis and benchmarks for respective regions and countries. In case of supply side validations, revenues of major companies are estimated (in case not available) based on industry benchmark, approximate number of employees, product portfolio, and primary interviews revenues are gathered. Further revenue from target product/service segment is assessed to avoid overshooting of market statistics. In case of heavy deviations between supply and demand side values, all thes steps are repeated to achieve synchronization.
We follow an iterative model, wherein we share our research findings with Subject Matter Experts (SME’s) and Key Opinion Leaders (KOLs) until consensus view of the market is not formulated – this model negates any drastic deviation in the opinions of experts. Only validated and universally acceptable research findings are quoted in our reports.
We have important check points that we use to validate our research findings – which we call – data triangulation, where we validate the information, we generate from secondary sources with primary interviews and then we re-validate with our internal data bases and Subject matter experts. This comprehensive model enables us to deliver high quality, reliable data in shortest possible time.
 Get Free Sample For