The geothermal power generation market size is projected to reach US$ 27,149.2 million by 2031 from US$ 15,453.3 million in 2023. The market is expected to register a CAGR of 7.3% during 2023–2031. Growing role of geothermal power in future energy transition is likely to remain key trend in the market.
Geothermal Power Generation Market Analysis
Geothermal power generation is a clean, sustainable, and environmentally friendly method that taps into the Earth's internal heat to produce electricity. This process involves harnessing the natural steam or hot water reservoirs found beneath the Earth's surface. Flash steam power plants accounted for 64.6% of the total geothermal power generation market share globally.
Further, the rising demand for electricity from end users, such as residential, commercial, and industrial sectors, is anticipated to fuel the market growth during the forecast period. Industrial users accounted for 45.4% of the total geothermal power generation in the world, owing to the rise in demand for electricity for various industrial applications such as manufacturing, chemical, petrochemical, processing, and others. Asia Pacific accounted for the largest geothermal power generation market share, i.e., about 40.4%, in 2022.
Geothermal Power Generation Market Overview
The geothermal power generation market growth is linked to the geological conditions favorable for tapping into the Earth's internal heat. The Earth's geology influences geothermal power's global distribution, and regions with high volcanic activity, tectonic plate boundaries, or hotspots are more likely to have significant geothermal resources. While some regions have been at the forefront of geothermal development, ongoing advancements in technology, such as enhanced geothermal systems (EGS), are expanding the reach of geothermal power, making it an increasingly viable option for clean and sustainable energy worldwide.
Geothermal power aligns with global energy transition goals, which aim to reduce carbon emissions and increase reliance on renewable energy sources. As countries commit to international agreements like the Paris Agreement, the role of geothermal power becomes more prominent in achieving carbon neutrality. The reliable and low-carbon nature of geothermal energy makes it an integral part of the clean energy transition. Governments worldwide incorporate geothermal power into their energy transition strategies, setting targets for increased renewable energy capacity and reduced reliance on fossil fuels. The global shift toward sustainable energy practices emphasizes the importance of geothermal power in achieving broader environmental and climate goals.
Customize Research To Suit Your Requirement
We can optimize and tailor the analysis and scope which is unmet through our standard offerings. This flexibility will help you gain the exact information needed for your business planning and decision making.
Geothermal Power Generation Market: Strategic Insights
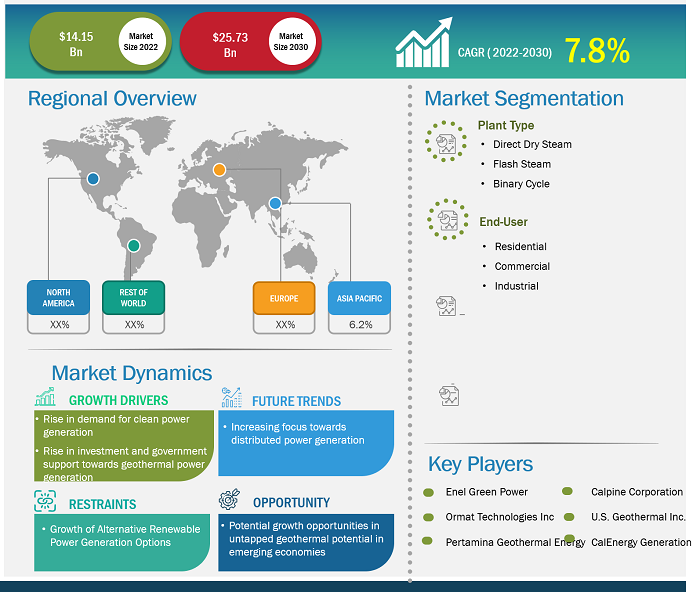
Market Size Value in US$ 14,146.0 million in 2022 Market Size Value by US$ 25,733.8 million by 2030 Growth rate CAGR of 7.8% from 2022 to 2030 Forecast Period 2022-2030 Base Year 2022

Naveen
Have a question?
Naveen will walk you through a 15-minute call to present the report’s content and answer all queries if you have any.
 Speak to Analyst
Customize Research To Suit Your Requirement
We can optimize and tailor the analysis and scope which is unmet through our standard offerings. This flexibility will help you gain the exact information needed for your business planning and decision making.
Geothermal Power Generation Market: Strategic Insights
| Market Size Value in | US$ 14,146.0 million in 2022 |
| Market Size Value by | US$ 25,733.8 million by 2030 |
| Growth rate | CAGR of 7.8% from 2022 to 2030 |
| Forecast Period | 2022-2030 |
| Base Year | 2022 |
Naveen
Have a question?
Naveen will walk you through a 15-minute call to present the report’s content and answer all queries if you have any.
Speak to Analyst
Geothermal Power Generation Market Drivers and Opportunities
Low greenhouse gas emissions from geothermal power to Favor Market
The global growth in energy demand, driven by population growth and industrialization, necessitates the expansion of energy production. The expansion of energy production from fossil fuel-based plants has resulted in a rise in greenhouse gas emissions, which, in turn, is expected to increase the need for renewable power generation. Thus, a rise in the demand for reducing greenhouse gas emissions is expected to drive the geothermal power generation market growth from 2023 to 2031.
In addition, geothermal power is characterized by its low greenhouse gas emissions during both construction and operation. Unlike fossil fuel-based power plants, geothermal facilities produce minimal carbon dioxide and other pollutants. The emissions are primarily from the release of gases in small amounts, such as hydrogen sulfide, which are effectively managed and mitigated. The environmental impact of geothermal power is significantly lower than traditional energy sources, making it a cleaner and more sustainable option. As countries strive to reduce their carbon footprint and combat climate change, the low emissions profile of geothermal power positions it as a crucial component in the transition to a greener and more sustainable energy landscape.
Untapped Geothermal Potential in Emerging Economies
Heat flows from the Earth's interior that covers twice the global energy demand. In order to harness this heat, there is a requirement to drill deep underground and convert that heat into a usable form of energy. This is considered a difficult and expensive process; hence, geothermal energy, sometimes referred to as the forgotten renewable energy, only accounts for ~0.3% of global electricity production. Another main advantage of geothermal energy is that it can provide baseload capacity, which is the minimum amount of electricity that must be available on the grid at any given time. While solar and wind output fluctuates seasonally and throughout the day, geothermal generation can be adjusted in the same way that a fossil fuel power plant can increase or decrease output.
In addition, the government initiatives toward exploring the untapped geothermal potential globally. For instance, to help countries unlock the untapped potential of geothermal energy and promote its widespread use, the International Renewable Energy Agency (IRENA) established the Global Geothermal Alliance (GGA) in 2015 as a platform to improve dialogue, collaboration, and coordinated action to increase the share of geothermal power installed as well as heat generation worldwide. Moreover, Indonesia, Turkey, and Kenya are key economies expected to lead in geothermal electricity generation by the end of 2030. The economic development plan named Kenya Vision 2030 by the Government of Kenya aimed at reaching 5 GW of geothermal capacity by 2030. Thus, exploring the untapped geothermal potential in emerging economies is expected to create several opportunities for the geothermal power generation market growth during the forecast period.
Geothermal Power Generation Market Report Segmentation Analysis
Key segments that contributed to the derivation of the geothermal power generation market analysis are plant type, and end user.
- Based on plant type, the geothermal power generation market is divided into direct dry steam, flash steam, and binary cycle. The flash steam segment held a larger market share in 2023.
- By end user, the market is segmented into residential, commercial, and industrial. The industrial segment held the largest share of the market in 2023.
Geothermal Power Generation Market Share Analysis by Geography
The geographic scope of the geothermal power generation market report is mainly divided into five regions: North America, Asia Pacific, Europe, Middle East & Africa, and South & Central America.
Asia Pacific is leading the market. This is owing to the increasing investments in the geothermal power capacity additions and rise in demand for clean power generation in the coming years. Asia Pacific, particularly countries along the Pacific Ring of Fire, is rich in geothermal resources. The Philippines is a notable example, with a significant share of its electricity coming from geothermal power plants. Indonesia, New Zealand, the Philippines, and Japan also have active geothermal projects and exploration initiatives. Indonesia, New Zealand, and the Philippines accounted for more than 75% of the total global geothermal power generation market size globally in 2022 and are projected to maintain their dominance during the geothermal power generation market forecast period.
Geothermal Power Generation Market Report Scope
Geothermal Power Generation Market News and Recent Developments
The geothermal power generation market is evaluated by gathering qualitative and quantitative data post primary and secondary research, which includes important corporate publications, association data, and databases. A few of the developments in the geothermal power generation market are listed below:
- Fervo Energy breaks ground on the next-generation geothermal plant. This facility is 400 MW in Beaver County, Utah. Fervo Energy will use enhanced geothermal technology to harness heat sources. (Source: Fervo Energy, Press Release, September 2023)
- Exergy International (Provider of clean energy technology) signed an agreement with Energy Development Corporation (EDC) for the supply of a 28 MW binary system plant in Leyte, Eastern Visayas (the Philippines). (Source: Exergy International, Press Release, August 2023)
Geothermal Power Generation Market Report Coverage and Deliverables
The “Geothermal Power Generation Market Size and Forecast (2021–2031)” report provides a detailed analysis of the market covering below areas:
- Geothermal power generation market size and forecast at global, regional, and country levels for all the key market segments covered under the scope
- Geothermal power generation market trends as well as market dynamics such as drivers, restraints, and key opportunities
- Detailed PEST and SWOT analysis
- Geothermal power generation market analysis covering key market trends, global and regional framework, major players, regulations, and recent market developments
- Industry landscape and competition analysis covering market concentration, heat map analysis, prominent players, and recent developments for the geothermal power generation market
- Detailed company profiles

Report Coverage
Revenue forecast, Company Analysis, Industry landscape, Growth factors, and Trends

Segment Covered
Plant Type, End User, and Geography

Regional Scope
North America, Europe, Asia Pacific, Middle East & Africa, South & Central America

Country Scope
This text is related
to country scope.
Frequently Asked Questions
7.3% is the expected CAGR of the geothermal power generation market.
US$ 27,149.2 million estimated value of the geothermal power generation market by 2031.
Northern California Power Agency, Turboden SpA, Toshiba Energy Systems & Solutions Corp, Berkshire Hathaway Inc, NIBE Industrier AB, General Electric Co., Fuji Electric Co Ltd, Kenya Electricity Generating Co Ltd, Carrier Global Corp., and Danfoss AS are some of the leading players in the geothermal power generation market.
Growing role of geothermal power in future energy transition is the future trend of the geothermal power generation market
Asia Pacific dominated the geothermal power generation market in 2023.
1. Introduction
1.1 The Insight Partners Research Report Guidance
1.2 Market Segmentation
2. Executive Summary
2.1 Key Insights
2.2 Market Attractiveness
3. Research Methodology
3.1 Secondary Research
3.2 Primary Research
3.2.1 Hypothesis formulation:
3.2.2 Macro-economic factor analysis:
3.2.3 Developing base number:
3.2.4 Data Triangulation:
3.2.5 Country level data:
4. Geothermal Power Generation Market Landscape
4.1 Overview
4.2 PEST Analysis
4.3 Ecosystem Analysis
4.3.1 Equipment or Component Suppliers
4.3.2 Geothermal Power Plant Operators/Product Manufacturers
4.3.3 End User
5. Geothermal Power Generation Market – Key Market Dynamics
5.1 Geothermal Power Generation Market – Key Market Dynamics
5.2 Market Drivers
5.2.1 Rise in Demand and Utilization of Geothermal Energy
5.2.2 Surge in Investment and Government Support toward Geothermal Power Generation
5.3 Market Restraints
5.3.1 High Investment Cost
5.4 Market Opportunities
5.4.1 Untapped Geothermal Potential in Emerging Economies
5.5 Future Trends
5.5.1 Growing Role of Geothermal Power in Future Energy Transition
5.6 Impact of Drivers and Restraints:
6. Geothermal Power Generation Market – Global Market Analysis
6.1 Geothermal Power Generation Market Revenue (US$ Million), 2021–2031
6.2 Geothermal Power Generation Market Forecast Analysis
7. Geothermal Power Generation Market Analysis – by Plant Type
7.1 Direct Dry Steam
7.1.1 Overview
7.1.2 Direct Dry Steam: Geothermal Power Generation Market – Revenue and Forecast to 2031 (US$ Million)
7.2 Flash Steam
7.2.1 Overview
7.2.2 Flash Steam: Geothermal Power Generation Market – Revenue and Forecast to 2031 (US$ Million)
7.3 Binary Cycle
7.3.1 Overview
7.3.2 Binary Cycle: Geothermal Power Generation Market – Revenue and Forecast to 2031 (US$ Million)
8. Geothermal Power Generation Market Analysis – by End User
8.1 Residential
8.1.1 Overview
8.1.2 Residential: Geothermal Power Generation Market – Revenue and Forecast to 2031 (US$ Million)
8.2 Commercial
8.2.1 Overview
8.2.2 Commercial: Geothermal Power Generation Market – Revenue and Forecast to 2031 (US$ Million)
8.3 Industrial
8.3.1 Overview
8.3.2 Industrial: Geothermal Power Generation Market – Revenue and Forecast to 2031 (US$ Million)
9. Geothermal Power Generation Market – Geographical Analysis
9.1 Overview
9.2 North America
9.2.1 North America Geothermal Power Generation Market Overview
9.2.2 North America: Geothermal Power Generation Market – Revenue and Forecast to 2031 (US$ Million)
9.2.3 North America: Geothermal Power Generation Market Breakdown, by Plant Type
9.2.3.1 North America: Geothermal Power Generation Market – Revenue and Forecast Analysis – by Plant Type
9.2.4 North America: Geothermal Power Generation Market Breakdown, by End User
9.2.4.1 North America: Geothermal Power Generation Market – Revenue and Forecast Analysis – by End User
9.2.5 North America: Geothermal Power Generation Market – Revenue and Forecast Analysis – by Country
9.2.5.1 North America: Geothermal Power Generation Market – Revenue and Forecast Analysis – by Country
9.2.5.2 United States: Geothermal Power Generation Market – Revenue and Forecast to 2031 (US$ Million)
9.2.5.2.1 United States: Geothermal Power Generation Market Breakdown, by Plant Type
9.2.5.2.2 United States: Geothermal Power Generation Market Breakdown, by End User
9.2.5.3 Mexico: Geothermal Power Generation Market – Revenue and Forecast to 2031 (US$ Million)
9.2.5.3.1 Mexico: Geothermal Power Generation Market Breakdown, by Plant Type
9.2.5.3.2 Mexico: Geothermal Power Generation Market Breakdown, by End User
9.3 Europe
9.3.1 Europe Geothermal Power Generation Market Overview
9.3.2 Europe: Geothermal Power Generation Market – Revenue and Forecast to 2031 (US$ Million)
9.3.3 Europe: Geothermal Power Generation Market Breakdown, by Plant Type
9.3.3.1 Europe: Geothermal Power Generation Market – Revenue and Forecast Analysis – by Plant Type
9.3.4 Europe: Geothermal Power Generation Market Breakdown, by End User
9.3.4.1 Europe: Geothermal Power Generation Market – Revenue and Forecast Analysis – by End User
9.3.5 Europe: Geothermal Power Generation Market – Revenue and Forecast Analysis – by Country
9.3.5.1 Europe: Geothermal Power Generation Market – Revenue and Forecast Analysis – by Country
9.3.5.2 Turkey: Geothermal Power Generation Market – Revenue and Forecast to 2031 (US$ Million)
9.3.5.2.1 Turkey: Geothermal Power Generation Market Breakdown, by Plant Type
9.3.5.2.2 Turkey: Geothermal Power Generation Market Breakdown, by End User
9.3.5.3 Iceland: Geothermal Power Generation Market – Revenue and Forecast to 2031 (US$ Million)
9.3.5.3.1 Iceland: Geothermal Power Generation Market Breakdown, by Plant Type
9.3.5.3.2 Iceland: Geothermal Power Generation Market Breakdown, by End User
9.3.5.4 Italy: Geothermal Power Generation Market – Revenue and Forecast to 2031 (US$ Million)
9.3.5.4.1 Italy: Geothermal Power Generation Market Breakdown, by Plant Type
9.3.5.4.2 Italy: Geothermal Power Generation Market Breakdown, by End User
9.3.5.5 Russia: Geothermal Power Generation Market – Revenue and Forecast to 2031 (US$ Million)
9.3.5.5.1 Russia: Geothermal Power Generation Market Breakdown, by Plant Type
9.3.5.5.2 Russia: Geothermal Power Generation Market Breakdown, by End User
9.3.5.6 Rest of Europe: Geothermal Power Generation Market – Revenue and Forecast to 2031 (US$ Million)
9.3.5.6.1 Rest of Europe: Geothermal Power Generation Market Breakdown, by Plant Type
9.3.5.6.2 Rest of Europe: Geothermal Power Generation Market Breakdown, by End User
9.4 Asia Pacific
9.4.1 Asia Pacific Geothermal Power Generation Market Overview
9.4.2 Asia Pacific: Geothermal Power Generation Market – Revenue and Forecast to 2031 (US$ Million)
9.4.3 Asia Pacific: Geothermal Power Generation Market Breakdown, by Plant Type
9.4.3.1 Asia Pacific: Geothermal Power Generation Market – Revenue and Forecast Analysis – by Plant Type
9.4.4 Asia Pacific: Geothermal Power Generation Market Breakdown, by End User
9.4.4.1 Asia Pacific: Geothermal Power Generation Market – Revenue and Forecast Analysis – by End User
9.4.5 Asia Pacific: Geothermal Power Generation Market – Revenue and Forecast Analysis – by Country
9.4.5.1 Asia Pacific: Geothermal Power Generation Market – Revenue and Forecast Analysis – by Country
9.4.5.2 Japan: Geothermal Power Generation Market – Revenue and Forecast to 2031 (US$ Million)
9.4.5.2.1 Japan: Geothermal Power Generation Market Breakdown, by Plant Type
9.4.5.2.2 Japan: Geothermal Power Generation Market Breakdown, by End User
9.4.5.3 Indonesia: Geothermal Power Generation Market – Revenue and Forecast to 2031 (US$ Million)
9.4.5.3.1 Indonesia: Geothermal Power Generation Market Breakdown, by Plant Type
9.4.5.3.2 Indonesia: Geothermal Power Generation Market Breakdown, by End User
9.4.5.4 New Zealand: Geothermal Power Generation Market – Revenue and Forecast to 2031 (US$ Million)
9.4.5.4.1 New Zealand: Geothermal Power Generation Market Breakdown, by Plant Type
9.4.5.4.2 New Zealand: Geothermal Power Generation Market Breakdown, by End User
9.4.5.5 Philippines: Geothermal Power Generation Market – Revenue and Forecast to 2031 (US$ Million)
9.4.5.5.1 Philippines: Geothermal Power Generation Market Breakdown, by Plant Type
9.4.5.5.2 Philippines: Geothermal Power Generation Market Breakdown, by End User
9.4.5.6 Rest of Asia Pacific: Geothermal Power Generation Market – Revenue and Forecast to 2031 (US$ Million)
9.4.5.6.1 Rest of Asia Pacific: Geothermal Power Generation Market Breakdown, by Plant Type
9.4.5.6.2 Rest of Asia Pacific: Geothermal Power Generation Market Breakdown, by End User
9.5 Rest of World
9.5.1 Rest of World Geothermal Power Generation Market Overview
9.5.2 Rest of World: Geothermal Power Generation Market – Revenue and Forecast to 2031 (US$ Million)
9.5.3 Rest of World: Geothermal Power Generation Market Breakdown, by Plant Type
9.5.3.1 Rest of World: Geothermal Power Generation Market – Revenue and Forecast Analysis – by Plant Type
9.5.4 Rest of World: Geothermal Power Generation Market Breakdown, by End User
9.5.4.1 Rest of World: Geothermal Power Generation Market – Revenue and Forecast Analysis – by End User
9.5.5 Rest of World: Geothermal Power Generation Market – Revenue and Forecast Analysis – by Country
9.5.5.1 Rest of World: Geothermal Power Generation Market – Revenue and Forecast Analysis – by Country
9.5.5.2 Chile: Geothermal Power Generation Market – Revenue and Forecast to 2031 (US$ Million)
9.5.5.2.1 Chile: Geothermal Power Generation Market Breakdown, by Plant Type
9.5.5.2.2 Chile: Geothermal Power Generation Market Breakdown, by End User
9.5.5.3 Kenya: Geothermal Power Generation Market – Revenue and Forecast to 2031 (US$ Million)
9.5.5.3.1 Kenya: Geothermal Power Generation Market Breakdown, by Plant Type
9.5.5.3.2 Kenya: Geothermal Power Generation Market Breakdown, by End User
9.5.5.4 El Salvador: Geothermal Power Generation Market – Revenue and Forecast to 2031 (US$ Million)
9.5.5.4.1 El Salvador: Geothermal Power Generation Market Breakdown, by Plant Type
9.5.5.4.2 El Salvador: Geothermal Power Generation Market Breakdown, by End User
9.5.5.5 Others: Geothermal Power Generation Market – Revenue and Forecast to 2031 (US$ Million)
9.5.5.5.1 Others: Geothermal Power Generation Market Breakdown, by Plant Type
9.5.5.5.2 Others: Geothermal Power Generation Market Breakdown, by End User
10. Competitive Landscape
10.1 Company Positioning & Concentration
10.2 Heat Map Analysis
11. Industry Landscape
11.1 Overview
11.2 Market Initiative
11.3 Merger and Acquisition
12. Company Profiles
12.1 Northern California Power Agency
12.1.1 Key Facts
12.1.2 Business Description
12.1.3 Products and Services
12.1.4 Financial Overview
12.1.5 SWOT Analysis
12.1.6 Key Developments
12.2 Turboden SpA
12.2.1 Key Facts
12.2.2 Business Description
12.2.3 Products and Services
12.2.4 Financial Overview
12.2.5 SWOT Analysis
12.2.6 Key Developments
12.3 Toshiba Energy Systems & Solutions Corp
12.3.1 Key Facts
12.3.2 Business Description
12.3.3 Products and Services
12.3.4 Financial Overview
12.3.5 SWOT Analysis
12.3.6 Key Developments
12.4 Berkshire Hathaway Inc
12.4.1 Key Facts
12.4.2 Business Description
12.4.3 Products and Services
12.4.4 Financial Overview
12.4.5 SWOT Analysis
12.4.6 Key Developments
12.5 NIBE Industrier AB
12.5.1 Key Facts
12.5.2 Business Description
12.5.3 Products and Services
12.5.4 Financial Overview
12.5.5 SWOT Analysis
12.5.6 Key Developments
12.6 General Electric Co
12.6.1 Key Facts
12.6.2 Business Description
12.6.3 Products and Services
12.6.4 Financial Overview
12.6.5 SWOT Analysis
12.6.6 Key Developments
12.7 Fuji Electric Co Ltd
12.7.1 Key Facts
12.7.2 Business Description
12.7.3 Products and Services
12.7.4 Financial Overview
12.7.5 SWOT Analysis
12.7.6 Key Developments
12.8 Kenya Electricity Generating Co Ltd
12.8.1 Key Facts
12.8.2 Business Description
12.8.3 Products and Services
12.8.4 Financial Overview
12.8.5 SWOT Analysis
12.8.6 Key Developments
12.9 Carrier Global Corp
12.9.1 Key Facts
12.9.2 Business Description
12.9.3 Products and Services
12.9.4 Financial Overview
12.9.5 SWOT Analysis
12.9.6 Key Developments
12.10 Danfoss AS
12.10.1 Key Facts
12.10.2 Business Description
12.10.3 Products and Services
12.10.4 Financial Overview
12.10.5 SWOT Analysis
12.10.6 Key Developments
13. Appendix
13.1 About The Insight Partners
List of Tables
Table 1. Geothermal Power Generation Market Segmentation
Table 2. Geothermal Power Generation Market – Revenue and Forecast to 2031 (US$ Million)
Table 3. Geothermal Power Generation Market – Revenue and Forecast to 2031 (US$ Million) – by Plant Type
Table 4. Geothermal Power Generation Market – Revenue and Forecast to 2031 (US$ Million) – by End User
Table 5. North America: Geothermal Power Generation Market – Revenue and Forecast to 2031(US$ Million) – by Plant Type
Table 6. North America: Geothermal Power Generation Market – Revenue and Forecast to 2031(US$ Million) – by End User
Table 7. North America: Geothermal Power Generation Market – Revenue and Forecast to 2031(US$ Million) – by Country
Table 8. United States: Geothermal Power Generation Market – Revenue and Forecast to 2031(US$ Million) – by Plant Type
Table 9. United States: Geothermal Power Generation Market – Revenue and Forecast to 2031(US$ Million) – by End User
Table 10. Mexico: Geothermal Power Generation Market – Revenue and Forecast to 2031(US$ Million) – by Plant Type
Table 11. Mexico: Geothermal Power Generation Market – Revenue and Forecast to 2031(US$ Million) – by End User
Table 12. Europe: Geothermal Power Generation Market – Revenue and Forecast to 2031(US$ Million) – by Plant Type
Table 13. Europe: Geothermal Power Generation Market – Revenue and Forecast to 2031(US$ Million) – by End User
Table 14. Europe: Geothermal Power Generation Market – Revenue and Forecast to 2031(US$ Million) – by Country
Table 15. Turkey: Geothermal Power Generation Market – Revenue and Forecast to 2031(US$ Million) – by Plant Type
Table 16. Turkey: Geothermal Power Generation Market – Revenue and Forecast to 2031(US$ Million) – by End User
Table 17. Iceland: Geothermal Power Generation Market – Revenue and Forecast to 2031(US$ Million) – by Plant Type
Table 18. Iceland: Geothermal Power Generation Market – Revenue and Forecast to 2031(US$ Million) – by End User
Table 19. Italy: Geothermal Power Generation Market – Revenue and Forecast to 2031(US$ Million) – by Plant Type
Table 20. Italy: Geothermal Power Generation Market – Revenue and Forecast to 2031(US$ Million) – by End User
Table 21. Russia: Geothermal Power Generation Market – Revenue and Forecast to 2031(US$ Million) – by Plant Type
Table 22. Russia: Geothermal Power Generation Market – Revenue and Forecast to 2031(US$ Million) – by End User
Table 23. Rest of Europe: Geothermal Power Generation Market – Revenue and Forecast to 2031(US$ Million) – by Plant Type
Table 24. Rest of Europe: Geothermal Power Generation Market – Revenue and Forecast to 2031(US$ Million) – by End User
Table 25. Asia Pacific: Geothermal Power Generation Market – Revenue and Forecast to 2031(US$ Million) – by Plant Type
Table 26. Asia Pacific: Geothermal Power Generation Market – Revenue and Forecast to 2031(US$ Million) – by End User
Table 27. Asia Pacific: Geothermal Power Generation Market – Revenue and Forecast to 2031(US$ Million) – by Country
Table 28. Japan: Geothermal Power Generation Market – Revenue and Forecast to 2031(US$ Million) – by Plant Type
Table 29. Japan: Geothermal Power Generation Market – Revenue and Forecast to 2031(US$ Million) – by End User
Table 30. Indonesia: Geothermal Power Generation Market – Revenue and Forecast to 2031(US$ Million) – by Plant Type
Table 31. Indonesia: Geothermal Power Generation Market – Revenue and Forecast to 2031(US$ Million) – by End User
Table 32. New Zealand: Geothermal Power Generation Market – Revenue and Forecast to 2031(US$ Million) – by Plant Type
Table 33. New Zealand: Geothermal Power Generation Market – Revenue and Forecast to 2031(US$ Million) – by End User
Table 34. Philippines: Geothermal Power Generation Market – Revenue and Forecast to 2031(US$ Million) – by Plant Type
Table 35. Philippines: Geothermal Power Generation Market – Revenue and Forecast to 2031(US$ Million) – by End User
Table 36. Rest of Asia Pacific: Geothermal Power Generation Market – Revenue and Forecast to 2031(US$ Million) – by Plant Type
Table 37. Rest of Asia Pacific: Geothermal Power Generation Market – Revenue and Forecast to 2031(US$ Million) – by End User
Table 38. Rest of World: Geothermal Power Generation Market – Revenue and Forecast to 2031(US$ Million) – by Plant Type
Table 39. Rest of World: Geothermal Power Generation Market – Revenue and Forecast to 2031(US$ Million) – by End User
Table 40. Rest of World: Geothermal Power Generation Market – Revenue and Forecast to 2031(US$ Million) – by Country
Table 41. Chile: Geothermal Power Generation Market – Revenue and Forecast to 2031(US$ Million) – by Plant Type
Table 42. Chile: Geothermal Power Generation Market – Revenue and Forecast to 2031(US$ Million) – by End User
Table 43. Kenya: Geothermal Power Generation Market – Revenue and Forecast to 2031(US$ Million) – by Plant Type
Table 44. Kenya: Geothermal Power Generation Market – Revenue and Forecast to 2031(US$ Million) – by End User
Table 45. El Salvador: Geothermal Power Generation Market – Revenue and Forecast to 2031(US$ Million) – by Plant Type
Table 46. El Salvador: Geothermal Power Generation Market – Revenue and Forecast to 2031(US$ Million) – by End User
Table 47. Others: Geothermal Power Generation Market – Revenue and Forecast to 2031(US$ Million) – by Plant Type
Table 48. Others: Geothermal Power Generation Market – Revenue and Forecast to 2031(US$ Million) – by End User
List of Figures
Figure 1. Geothermal Power Generation Market Segmentation, by Geography
Figure 2. PEST Analysis
Figure 3. Ecosystem Analysis
Figure 4. Impact Analysis of Drivers and Restraints
Figure 5. Geothermal Power Generation Market Revenue (US$ Million), 2021–2031
Figure 6. Geothermal Power Generation Market Share (%) – by Plant Type (2023 and 2031)
Figure 7. Direct Dry Steam: Geothermal Power Generation Market – Revenue and Forecast to 2031 (US$ Million)
Figure 8. Flash Steam: Geothermal Power Generation Market – Revenue and Forecast to 2031 (US$ Million)
Figure 9. Binary Cycle: Geothermal Power Generation Market – Revenue and Forecast to 2031 (US$ Million)
Figure 10. Geothermal Power Generation Market Share (%) – by End User (2023 and 2031)
Figure 11. Residential: Geothermal Power Generation Market – Revenue and Forecast to 2031 (US$ Million)
Figure 12. Commercial: Geothermal Power Generation Market – Revenue and Forecast to 2031 (US$ Million)
Figure 13. Industrial: Geothermal Power Generation Market – Revenue and Forecast to 2031 (US$ Million)
Figure 14. Geothermal Power Generation Market Breakdown by Region, 2023 and 2031 (%)
Figure 15. North America: Geothermal Power Generation Market – Revenue and Forecast to 2031(US$ Million)
Figure 16. North America: Geothermal Power Generation Market Breakdown, by Plant Type (2023 and 2031)
Figure 17. North America: Geothermal Power Generation Market Breakdown, by End User (2023 and 2031)
Figure 18. North America: Geothermal Power Generation Market Breakdown, by Key Countries, 2023 and 2031 (%)
Figure 19. United States: Geothermal Power Generation Market – Revenue and Forecast to 2031(US$ Million)
Figure 20. Mexico: Geothermal Power Generation Market – Revenue and Forecast to 2031(US$ Million)
Figure 21. Europe: Geothermal Power Generation Market – Revenue and Forecast to 2031(US$ Million)
Figure 22. Europe: Geothermal Power Generation Market Breakdown, by Plant Type (2023 and 2031)
Figure 23. Europe: Geothermal Power Generation Market Breakdown, by End User (2023 and 2031)
Figure 24. Europe: Geothermal Power Generation Market Breakdown, by Key Countries, 2023 and 2031 (%)
Figure 25. Turkey: Geothermal Power Generation Market – Revenue and Forecast to 2031(US$ Million)
Figure 26. Iceland: Geothermal Power Generation Market – Revenue and Forecast to 2031(US$ Million)
Figure 27. Italy: Geothermal Power Generation Market – Revenue and Forecast to 2031(US$ Million)
Figure 28. Russia: Geothermal Power Generation Market – Revenue and Forecast to 2031(US$ Million)
Figure 29. Rest of Europe: Geothermal Power Generation Market – Revenue and Forecast to 2031(US$ Million)
Figure 30. Asia Pacific: Geothermal Power Generation Market – Revenue and Forecast to 2031(US$ Million)
Figure 31. Asia Pacific: Geothermal Power Generation Market Breakdown, by Plant Type (2023 and 2031)
Figure 32. Asia Pacific: Geothermal Power Generation Market Breakdown, by End User (2023 and 2031)
Figure 33. Asia Pacific: Geothermal Power Generation Market Breakdown, by Key Countries, 2023 and 2031 (%)
Figure 34. Japan: Geothermal Power Generation Market – Revenue and Forecast to 2031(US$ Million)
Figure 35. Indonesia: Geothermal Power Generation Market – Revenue and Forecast to 2031(US$ Million)
Figure 36. New Zealand: Geothermal Power Generation Market – Revenue and Forecast to 2031(US$ Million)
Figure 37. Philippines: Geothermal Power Generation Market – Revenue and Forecast to 2031(US$ Million)
Figure 38. Rest of Asia Pacific: Geothermal Power Generation Market – Revenue and Forecast to 2031(US$ Million)
Figure 39. Rest of World: Geothermal Power Generation Market – Revenue and Forecast to 2031(US$ Million)
Figure 40. Rest of World: Geothermal Power Generation Market Breakdown, by Plant Type (2023 and 2031)
Figure 41. Rest of World: Geothermal Power Generation Market Breakdown, by End User (2023 and 2031)
Figure 42. Rest of World: Geothermal Power Generation Market Breakdown, by Key Countries, 2023 and 2031 (%)
Figure 43. Chile: Geothermal Power Generation Market – Revenue and Forecast to 2031(US$ Million)
Figure 44. Kenya: Geothermal Power Generation Market – Revenue and Forecast to 2031(US$ Million)
Figure 45. El Salvador: Geothermal Power Generation Market – Revenue and Forecast to 2031(US$ Million)
Figure 46. Others: Geothermal Power Generation Market – Revenue and Forecast to 2031(US$ Million)
Figure 47. Company Positioning & Concentration
Figure 48. Heat Map Analysis
The List of Companies - Geothermal Power Generation Market
- Northern California Power Agency
- Turboden SpA
- Toshiba Energy Systems & Solutions Corp
- Berkshire Hathaway Inc
- NIBE Industrier AB
- General Electric Co.
- Fuji Electric Co Ltd
- Kenya Electricity Generating Co Ltd
- Carrier Global Corp.
- Danfoss AS
The Insight Partners performs research in 4 major stages: Data Collection & Secondary Research, Primary Research, Data Analysis and Data Triangulation & Final Review.
- Data Collection and Secondary Research:
As a market research and consulting firm operating from a decade, we have published many reports and advised several clients across the globe. First step for any study will start with an assessment of currently available data and insights from existing reports. Further, historical and current market information is collected from Investor Presentations, Annual Reports, SEC Filings, etc., and other information related to company’s performance and market positioning are gathered from Paid Databases (Factiva, Hoovers, and Reuters) and various other publications available in public domain.
Several associations trade associates, technical forums, institutes, societies and organizations are accessed to gain technical as well as market related insights through their publications such as research papers, blogs and press releases related to the studies are referred to get cues about the market. Further, white papers, journals, magazines, and other news articles published in the last 3 years are scrutinized and analyzed to understand the current market trends.
- Primary Research:
The primarily interview analysis comprise of data obtained from industry participants interview and answers to survey questions gathered by in-house primary team.
For primary research, interviews are conducted with industry experts/CEOs/Marketing Managers/Sales Managers/VPs/Subject Matter Experts from both demand and supply side to get a 360-degree view of the market. The primary team conducts several interviews based on the complexity of the markets to understand the various market trends and dynamics which makes research more credible and precise.
A typical research interview fulfils the following functions:
- Provides first-hand information on the market size, market trends, growth trends, competitive landscape, and outlook
- Validates and strengthens in-house secondary research findings
- Develops the analysis team’s expertise and market understanding
Primary research involves email interactions and telephone interviews for each market, category, segment, and sub-segment across geographies. The participants who typically take part in such a process include, but are not limited to:
- Industry participants: VPs, business development managers, market intelligence managers and national sales managers
- Outside experts: Valuation experts, research analysts and key opinion leaders specializing in the electronics and semiconductor industry.
Below is the breakup of our primary respondents by company, designation, and region:

Once we receive the confirmation from primary research sources or primary respondents, we finalize the base year market estimation and forecast the data as per the macroeconomic and microeconomic factors assessed during data collection.
- Data Analysis:
Once data is validated through both secondary as well as primary respondents, we finalize the market estimations by hypothesis formulation and factor analysis at regional and country level.
- 3.1 Macro-Economic Factor Analysis:
We analyse macroeconomic indicators such the gross domestic product (GDP), increase in the demand for goods and services across industries, technological advancement, regional economic growth, governmental policies, the influence of COVID-19, PEST analysis, and other aspects. This analysis aids in setting benchmarks for various nations/regions and approximating market splits. Additionally, the general trend of the aforementioned components aid in determining the market's development possibilities.
- 3.2 Country Level Data:
Various factors that are especially aligned to the country are taken into account to determine the market size for a certain area and country, including the presence of vendors, such as headquarters and offices, the country's GDP, demand patterns, and industry growth. To comprehend the market dynamics for the nation, a number of growth variables, inhibitors, application areas, and current market trends are researched. The aforementioned elements aid in determining the country's overall market's growth potential.
- 3.3 Company Profile:
The “Table of Contents” is formulated by listing and analyzing more than 25 - 30 companies operating in the market ecosystem across geographies. However, we profile only 10 companies as a standard practice in our syndicate reports. These 10 companies comprise leading, emerging, and regional players. Nonetheless, our analysis is not restricted to the 10 listed companies, we also analyze other companies present in the market to develop a holistic view and understand the prevailing trends. The “Company Profiles” section in the report covers key facts, business description, products & services, financial information, SWOT analysis, and key developments. The financial information presented is extracted from the annual reports and official documents of the publicly listed companies. Upon collecting the information for the sections of respective companies, we verify them via various primary sources and then compile the data in respective company profiles. The company level information helps us in deriving the base number as well as in forecasting the market size.
- 3.4 Developing Base Number:
Aggregation of sales statistics (2020-2022) and macro-economic factor, and other secondary and primary research insights are utilized to arrive at base number and related market shares for 2022. The data gaps are identified in this step and relevant market data is analyzed, collected from paid primary interviews or databases. On finalizing the base year market size, forecasts are developed on the basis of macro-economic, industry and market growth factors and company level analysis.
- Data Triangulation and Final Review:
The market findings and base year market size calculations are validated from supply as well as demand side. Demand side validations are based on macro-economic factor analysis and benchmarks for respective regions and countries. In case of supply side validations, revenues of major companies are estimated (in case not available) based on industry benchmark, approximate number of employees, product portfolio, and primary interviews revenues are gathered. Further revenue from target product/service segment is assessed to avoid overshooting of market statistics. In case of heavy deviations between supply and demand side values, all thes steps are repeated to achieve synchronization.
We follow an iterative model, wherein we share our research findings with Subject Matter Experts (SME’s) and Key Opinion Leaders (KOLs) until consensus view of the market is not formulated – this model negates any drastic deviation in the opinions of experts. Only validated and universally acceptable research findings are quoted in our reports.
We have important check points that we use to validate our research findings – which we call – data triangulation, where we validate the information, we generate from secondary sources with primary interviews and then we re-validate with our internal data bases and Subject matter experts. This comprehensive model enables us to deliver high quality, reliable data in shortest possible time.
 Get Free Sample For