The insurance third-party administrator market size is expected to reach US$ 544.67 billion by 2031 from US$ 256.02 billion in 2023. The market is estimated to record a CAGR of 9.9% from 2023 to 2031. Digital third-party administrators are likely to remain a key market trend in the coming years.
Insurance Third-Party Administrator Market Analysis
The insurance claim process can be complex and time consuming. A third-party administrator can help policyholders claim their policy benefits. They guide policyholders throughout the claim procedure and file claims on their behalf. Once the claims are filed, third-party administrators investigate and verify them. Their services can be tailored to a wide range of needs. Moreover, insurers can customize their agreements made with third-party administrators based on their specific needs. Other noteworthy offerings of insurance third-party administrator services include health benefits reporting and analytics, adjudicating claims, customer service for plan members, healthcare provider network access, detailed healthcare expense reporting, and collaborations with brokers and health insurance consultants. The increasing need for administrators in health insurance with the surging complexity of claim processes fuels the growth of the insurance third-party administrator market. Further, the proliferation of the insurance industry creates opportunities for market growth in the future. Digital third-party administrators are emerging as a significant trend in the market. On the other hand, data privacy concerns and security concerns limit the growth of the insurance third-party administrator market.
Insurance Third-Party Administrator Market Overview
A third-party administrator is an entity that handles administrative and operational tasks associated with an insurance plan. Administrative duties frequently include processing claims, enrolling consumers, and collecting premiums, adhering to federal rules. Third-party administrators do not create the policies of health insurance plans, but they help guarantee their implementation. A single third-party administrator may work with multiple insurers. While third-party administrators are typically linked with health insurance, they are employed in a wide range of other segments of the insurance industry. Commercial liability insurers and retirement plan administrators frequently hire third-party administrators to serve as claims adjusters or customer service representatives. Third-party administrator companies can be major multinational corporations, while individuals having third-party administrator certification can also work as independent contractors.
Customize Research To Suit Your Requirement
We can optimize and tailor the analysis and scope which is unmet through our standard offerings. This flexibility will help you gain the exact information needed for your business planning and decision making.
Insurance Third-Party Administrator Market: Strategic Insights
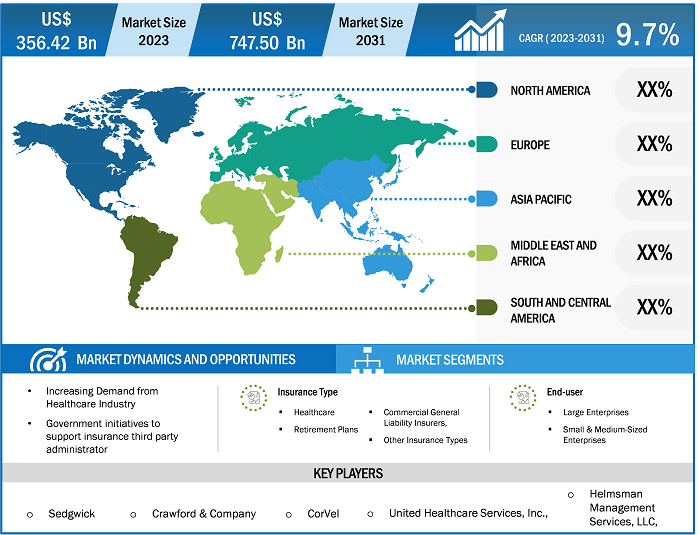
Market Size Value in US$ 356.42 billion in 2023 Market Size Value by US$ 747.50 billion by 2031 Growth rate CAGR of 9.7% from 2023 to 2031 Forecast Period 2023-2031 Base Year 2023

Naveen
Have a question?
Naveen will walk you through a 15-minute call to present the report’s content and answer all queries if you have any.
 Speak to Analyst
Customize Research To Suit Your Requirement
We can optimize and tailor the analysis and scope which is unmet through our standard offerings. This flexibility will help you gain the exact information needed for your business planning and decision making.
Insurance Third-Party Administrator Market: Strategic Insights
| Market Size Value in | US$ 356.42 billion in 2023 |
| Market Size Value by | US$ 747.50 billion by 2031 |
| Growth rate | CAGR of 9.7% from 2023 to 2031 |
| Forecast Period | 2023-2031 |
| Base Year | 2023 |
Naveen
Have a question?
Naveen will walk you through a 15-minute call to present the report’s content and answer all queries if you have any.
Speak to Analyst
Insurance Third-Party Administrator Market Drivers and Opportunities
Increase in Preference for Administrators in Health Insurance Favors Market Growth
Third-party administrators serve as mediators between insurance companies and policyholders. They oversee specific services, such as processing claims, providing customer support, and managing payment transactions on behalf of health insurance companies. These service providers play a pivotal role in handling different facets of health insurance. They maintain policyholders' important records in a dedicated database and provide smooth back-end assistance. Third-party administrators also ensure the correct processing of policyholders' claims. They guarantee that the hospitals they manage meet the standards of network membership, allowing for hassle-free claim settlement. Various value-added services provided by several third-party administrators include specialized consultations, ambulance services, medical supplies, wellness programs, lifestyle management, 24-hour toll-free helplines, and health facilities. Insurers such as Oriental Insurance, New India Assurance, National Insurance, and United India opt for administrator services offered by Vidal Health Insurance TPA, Health Insurance TPA of India Ltd, Focus Health Services TPA Pvt. Ltd, Family Health Plan Insurance TPA Limited, and others. Thus, a broad application of third-party administrators in healthcare insurance drives the growth of the market.
Proliferation of Insurance Industry to Create Opportunities in Market
As countries grow and people gain more discretionary income, they are more likely to be able to afford and recognize the value of insurance products such as life, health, and property insurance plans. This is especially true for a burgeoning middle class striving for financial stability. People are becoming increasingly conscious of the possibility of financial loss due to unforeseen circumstances such as illness, accidents, or natural catastrophes. As a result, individuals, businesses, and other entities seek insurance policies to safeguard themselves from the repercussions, which fuels the demand for insurance solutions that can assist in managing these risks. According to the Federal Insurance Office (FIO), the US had 667 licensed L&H insurers, 2,656 P&C insurers, and 1,355 health in 2022. According to the India Brand Equity Foundation (IBEF), the insurance industry is one of the premium segments seeing significant expansion in India. This upward trend in the insurance sector can be ascribed to rising revenues and increased awareness of the profession. India has the sixth-largest life insurance market among emerging economies, growing at a pace of 32–34% per year. In recent years, the industry has experienced vigorous competition among rival businesses. Moreover, the insurance sector faces numerous constraints, including highly dynamic regulatory complications, which present organizations with considerable threats to financial and operational stability. Thus, the ongoing proliferation of the insurance industry is creating opportunities for the growth of the insurance third-party administrator market.
Insurance Third-Party Administrator Market Report Segmentation Analysis
Key segments that contributed to the derivation of the insurance third-party administrator market analysis are type and end user.
- Based on type, the market is segmented into healthcare, retirement plans, commercial general liability insurance, and other insurance types. The healthcare segment dominated the market in 2023.
- In terms of end user, the market is categorized into large enterprises, and small and medium-sized enterprises. The large enterprises segment dominated the market in 2023.
Insurance Third-Party Administrator Market Share Analysis by Geography
- The insurance third-party administrator market is segmented into five major regions: North America, Europe, Asia Pacific (APAC), the Middle East & Africa (MEA), and South & Central America. North America dominated the market in 2023, followed by APAC and Europe, respectively.
- The US, Canada, and Mexico are among the major economies in North America. This region accounts for a significant share of the global insurance third-party administrator market. These administrators handle claims operations and various other services for insurance companies. North America is a highly advanced region. Businesses in this region widely adopt advanced solutions to simplify their business workflow and operations. Continuous digitalization in the insurance industry is one of the factors fueling the insurance third-party administrator market growth in North America. For example, in October 2023, LIDP partnered with Sutherland, a global digital-first business-process-as-a-service (BPaaS) provider, to introduce innovative, comprehensive solutions. Digital tools and AI drive middle-office and back-office digitization and customer experience (CX), along with providing more precise insights into the insurance carrier business and growth.
Insurance Third-Party Administrator Market Report Scope
Insurance Third-Party Administrator Market News and Recent Developments
The insurance third-party administrator market is evaluated by gathering qualitative and quantitative data post primary and secondary research, which includes important corporate publications, association data, and databases. A few of the developments in the insurance third-party administrator market are listed below: Sedgwick has announced several new updates to its artificial intelligence-powered (AI) technology program The technology goal is to expedite the claims process by predicting, addressing, and automating steps in the claim lifecycle, thereby enhancing consumer experiences and streamlining claim resolutions.
(Source: Sedgwick, Press Release, May 2024)
- Crawford & Company's third-party administration business in the UK, i.e., Crawford TPA, has teamed with Automated Insurance Solutions (AIS), a British insurtech, to support speedier motor claims processing in the country. Crawford TPA would use AIS's automated motor claims liability assessment tool, BAIL, as part of its growing digital claims management ecosystem.
(Source: Crawford & Company, Press Release, May 2022)
Insurance Third-Party Administrator Market Report Coverage and Deliverables
The "Insurance Third-Party Administrator Market Size and Forecast (2021–2031)" provides a detailed analysis of the market covering the areas mentioned below:
- Insurance third-party administrator market size and forecast at global, regional, and country levels for all the key market segments covered under the scope
- Insurance third-party administrator market trends as well as market dynamics such as drivers, restraints, and key opportunities
- Detailed PEST and SWOT analysis
- Insurance third-party administrator market analysis covering key market trends, global and regional framework, major players, regulations, and recent market developments
- Industry landscape and competition analysis covering market concentration, heat map analysis, prominent players, and recent developments for the insurance third-party administrator market
- Detailed company profiles

Report Coverage
Revenue forecast, Company Analysis, Industry landscape, Growth factors, and Trends

Segment Covered
Insurance Type, End-user, and Geography

Regional Scope
North America, Europe, Asia Pacific, Middle East & Africa, South & Central America

Country Scope
This text is related
to country scope.
Frequently Asked Questions
The global third-party administrator market was estimated to be US$ 356.42 billion in 2023 and is expected to grow at a CAGR of 9.7 % during the forecast period 2023 - 2030.
Technological innovations in the market, which is anticipated to play a significant role in the global third-party administrator market in the coming years.
The key players holding majority shares in the global third-party administrator market are Sedgwick, Crawford & Company, CorVel, United Healthcare Services, Inc., and Helmsman Management.
The global third-party administrator market is expected to reach US$ 747.50 billion by 2031.
Increasing demand from the healthcare industry and growing digitalization are the major factors that propel the global third-party administrator market.
1. Introduction
1.1 The Insight Partners Research Report Guidance
1.2 Market Segmentation
2. Executive Summary
2.1 Key Insights
2.2 Market Attractiveness
3. Research Methodology
3.1 Secondary Research
3.2 Primary Research
3.2.1 Hypothesis formulation:
3.2.2 Macro-economic factor analysis:
3.2.3 Developing base number:
3.2.4 Data Triangulation:
3.2.5 Country level data:
4. Insurance Third-Party Administrator Market Landscape
4.1 Overview
4.2 PEST Analysis
4.3 Ecosystem Analysis
4.3.1 List of Vendors in the Value Chain
5. Insurance Third-Party Administrator Market – Key Market Dynamics
5.1 Insurance Third-Party Administrator Market – Key Market Dynamics
5.2 Market Drivers
5.2.1 Increase in Preference for Administrators in Health Insurance
5.2.2 Growing Complexity of Insurance Claims
5.3 Market Restraints
5.3.1 Data Privacy and Security Concerns
5.4 Market Opportunities
5.4.1 Proliferation of Insurance Industry
5.5 Market Trends
5.5.1 Digital Third-Party Administrators
5.6 Impact of Drivers and Restraints:
6. Insurance Third-Party Administrator Market – Global Market Analysis
6.1 Insurance Third-Party Administrator Market Revenue (US$ Million), 2021–2031
6.2 Insurance Third-Party Administrator Market Forecast Analysis
7. Insurance Third-Party Administrator Market Analysis – by Insurance Type
7.1 Healthcare
7.1.1 Overview
7.1.2 Healthcare: Insurance Third-Party Administrator Market – Revenue and Forecast to 2031 (US$ Million)
7.2 Retirement Plans
7.2.1 Overview
7.2.2 Retirement Plans: Insurance Third-Party Administrator Market – Revenue and Forecast to 2031 (US$ Million)
7.3 Commercial General Liability Insurers
7.3.1 Overview
7.3.2 Commercial General Liability Insurers: Insurance Third-Party Administrator Market – Revenue and Forecast to 2031 (US$ Million)
7.4 Other Insurance Types
7.4.1 Overview
7.4.2 Other Insurance Types: Insurance Third-Party Administrator Market – Revenue and Forecast to 2031 (US$ Million)
8. Insurance Third-Party Administrator Market Analysis – by End Users
8.1 Large Enterprises
8.1.1 Overview
8.1.2 Large Enterprises: Insurance Third-Party Administrator Market – Revenue and Forecast to 2031 (US$ Million)
8.2 SMEs
8.2.1 Overview
8.2.2 SMEs: Insurance Third-Party Administrator Market – Revenue and Forecast to 2031 (US$ Million)
9. Insurance Third-Party Administrator Market – Geographical Analysis
9.1 Overview
9.2 North America
9.2.1 North America Insurance Third-Party Administrator Market Overview
9.2.2 North America: Insurance Third-Party Administrator Market – Revenue and Forecast to 2031 (US$ Million)
9.2.3 North America: Insurance Third-Party Administrator Market Breakdown, by Insurance Type
9.2.3.1 North America: Insurance Third-Party Administrator Market – Revenue and Forecast Analysis – by Insurance Type
9.2.4 North America: Insurance Third-Party Administrator Market Breakdown, by End Users
9.2.4.1 North America: Insurance Third-Party Administrator Market – Revenue and Forecast Analysis – by End Users
9.2.5 North America: Insurance Third-Party Administrator Market – Revenue and Forecast Analysis – by Country
9.2.5.1 North America: Insurance Third-Party Administrator Market – Revenue and Forecast Analysis – by Country
9.2.5.2 United States: Insurance Third-Party Administrator Market – Revenue and Forecast to 2031 (US$ Million)
9.2.5.2.1 United States: Insurance Third-Party Administrator Market Breakdown, by Insurance Type
9.2.5.2.2 United States: Insurance Third-Party Administrator Market Breakdown, by End Users
9.2.5.3 Canada: Insurance Third-Party Administrator Market – Revenue and Forecast to 2031 (US$ Million)
9.2.5.3.1 Canada: Insurance Third-Party Administrator Market Breakdown, by Insurance Type
9.2.5.3.2 Canada: Insurance Third-Party Administrator Market Breakdown, by End Users
9.2.5.4 Mexico: Insurance Third-Party Administrator Market – Revenue and Forecast to 2031 (US$ Million)
9.2.5.4.1 Mexico: Insurance Third-Party Administrator Market Breakdown, by Insurance Type
9.2.5.4.2 Mexico: Insurance Third-Party Administrator Market Breakdown, by End Users
9.3 Europe
9.3.1 Europe Insurance Third-Party Administrator Market Overview
9.3.2 Europe: Insurance Third-Party Administrator Market – Revenue and Forecast to 2031 (US$ Million)
9.3.3 Europe: Insurance Third-Party Administrator Market Breakdown, by Insurance Type
9.3.3.1 Europe: Insurance Third-Party Administrator Market – Revenue and Forecast Analysis – by Insurance Type
9.3.4 Europe: Insurance Third-Party Administrator Market Breakdown, by End Users
9.3.4.1 Europe: Insurance Third-Party Administrator Market – Revenue and Forecast Analysis – by End Users
9.3.5 Europe: Insurance Third-Party Administrator Market – Revenue and Forecast Analysis – by Country
9.3.5.1 Europe: Insurance Third-Party Administrator Market – Revenue and Forecast Analysis – by Country
9.3.5.2 United Kingdom: Insurance Third-Party Administrator Market – Revenue and Forecast to 2031 (US$ Million)
9.3.5.2.1 United Kingdom: Insurance Third-Party Administrator Market Breakdown, by Insurance Type
9.3.5.2.2 United Kingdom: Insurance Third-Party Administrator Market Breakdown, by End Users
9.3.5.3 Germany: Insurance Third-Party Administrator Market – Revenue and Forecast to 2031 (US$ Million)
9.3.5.3.1 Germany: Insurance Third-Party Administrator Market Breakdown, by Insurance Type
9.3.5.3.2 Germany: Insurance Third-Party Administrator Market Breakdown, by End Users
9.3.5.4 France: Insurance Third-Party Administrator Market – Revenue and Forecast to 2031 (US$ Million)
9.3.5.4.1 France: Insurance Third-Party Administrator Market Breakdown, by Insurance Type
9.3.5.4.2 France: Insurance Third-Party Administrator Market Breakdown, by End Users
9.3.5.5 Italy: Insurance Third-Party Administrator Market – Revenue and Forecast to 2031 (US$ Million)
9.3.5.5.1 Italy: Insurance Third-Party Administrator Market Breakdown, by Insurance Type
9.3.5.5.2 Italy: Insurance Third-Party Administrator Market Breakdown, by End Users
9.3.5.6 Russia: Insurance Third-Party Administrator Market – Revenue and Forecast to 2031 (US$ Million)
9.3.5.6.1 Russia: Insurance Third-Party Administrator Market Breakdown, by Insurance Type
9.3.5.6.2 Russia: Insurance Third-Party Administrator Market Breakdown, by End Users
9.3.5.7 Rest of Europe: Insurance Third-Party Administrator Market – Revenue and Forecast to 2031 (US$ Million)
9.3.5.7.1 Rest of Europe: Insurance Third-Party Administrator Market Breakdown, by Insurance Type
9.3.5.7.2 Rest of Europe: Insurance Third-Party Administrator Market Breakdown, by End Users
9.4 Asia Pacific
9.4.1 Asia Pacific Insurance Third-Party Administrator Market Overview
9.4.2 Asia Pacific: Insurance Third-Party Administrator Market – Revenue and Forecast to 2031 (US$ Million)
9.4.3 Asia Pacific: Insurance Third-Party Administrator Market Breakdown, by Insurance Type
9.4.3.1 Asia Pacific: Insurance Third-Party Administrator Market – Revenue and Forecast Analysis – by Insurance Type
9.4.4 Asia Pacific: Insurance Third-Party Administrator Market Breakdown, by End Users
9.4.4.1 Asia Pacific: Insurance Third-Party Administrator Market – Revenue and Forecast Analysis – by End Users
9.4.5 Asia Pacific: Insurance Third-Party Administrator Market – Revenue and Forecast Analysis – by Country
9.4.5.1 Asia Pacific: Insurance Third-Party Administrator Market – Revenue and Forecast Analysis – by Country
9.4.5.2 China: Insurance Third-Party Administrator Market – Revenue and Forecast to 2031 (US$ Million)
9.4.5.2.1 China: Insurance Third-Party Administrator Market Breakdown, by Insurance Type
9.4.5.2.2 China: Insurance Third-Party Administrator Market Breakdown, by End Users
9.4.5.3 Japan: Insurance Third-Party Administrator Market – Revenue and Forecast to 2031 (US$ Million)
9.4.5.3.1 Japan: Insurance Third-Party Administrator Market Breakdown, by Insurance Type
9.4.5.3.2 Japan: Insurance Third-Party Administrator Market Breakdown, by End Users
9.4.5.4 South Korea: Insurance Third-Party Administrator Market – Revenue and Forecast to 2031 (US$ Million)
9.4.5.4.1 South Korea: Insurance Third-Party Administrator Market Breakdown, by Insurance Type
9.4.5.4.2 South Korea: Insurance Third-Party Administrator Market Breakdown, by End Users
9.4.5.5 India: Insurance Third-Party Administrator Market – Revenue and Forecast to 2031 (US$ Million)
9.4.5.5.1 India: Insurance Third-Party Administrator Market Breakdown, by Insurance Type
9.4.5.5.2 India: Insurance Third-Party Administrator Market Breakdown, by End Users
9.4.5.6 Australia: Insurance Third-Party Administrator Market – Revenue and Forecast to 2031 (US$ Million)
9.4.5.6.1 Australia: Insurance Third-Party Administrator Market Breakdown, by Insurance Type
9.4.5.6.2 Australia: Insurance Third-Party Administrator Market Breakdown, by End Users
9.4.5.7 Rest of APAC: Insurance Third-Party Administrator Market – Revenue and Forecast to 2031 (US$ Million)
9.4.5.7.1 Rest of APAC: Insurance Third-Party Administrator Market Breakdown, by Insurance Type
9.4.5.7.2 Rest of APAC: Insurance Third-Party Administrator Market Breakdown, by End Users
9.5 Middle East and Africa
9.5.1 Middle East and Africa Insurance Third-Party Administrator Market Overview
9.5.2 Middle East and Africa: Insurance Third-Party Administrator Market – Revenue and Forecast to 2031 (US$ Million)
9.5.3 Middle East and Africa: Insurance Third-Party Administrator Market Breakdown, by Insurance Type
9.5.3.1 Middle East and Africa: Insurance Third-Party Administrator Market – Revenue and Forecast Analysis – by Insurance Type
9.5.4 Middle East and Africa: Insurance Third-Party Administrator Market Breakdown, by End Users
9.5.4.1 Middle East and Africa: Insurance Third-Party Administrator Market – Revenue and Forecast Analysis – by End Users
9.5.5 Middle East and Africa: Insurance Third-Party Administrator Market – Revenue and Forecast Analysis – by Country
9.5.5.1 Middle East and Africa: Insurance Third-Party Administrator Market – Revenue and Forecast Analysis – by Country
9.5.5.2 United Arab Emirates: Insurance Third-Party Administrator Market – Revenue and Forecast to 2031 (US$ Million)
9.5.5.2.1 United Arab Emirates: Insurance Third-Party Administrator Market Breakdown, by Insurance Type
9.5.5.2.2 United Arab Emirates: Insurance Third-Party Administrator Market Breakdown, by End Users
9.5.5.3 Saudi Arabia: Insurance Third-Party Administrator Market – Revenue and Forecast to 2031 (US$ Million)
9.5.5.3.1 Saudi Arabia: Insurance Third-Party Administrator Market Breakdown, by Insurance Type
9.5.5.3.2 Saudi Arabia: Insurance Third-Party Administrator Market Breakdown, by End Users
9.5.5.4 South Africa: Insurance Third-Party Administrator Market – Revenue and Forecast to 2031 (US$ Million)
9.5.5.4.1 South Africa: Insurance Third-Party Administrator Market Breakdown, by Insurance Type
9.5.5.4.2 South Africa: Insurance Third-Party Administrator Market Breakdown, by End Users
9.5.5.5 Rest of Middle East and Africa: Insurance Third-Party Administrator Market – Revenue and Forecast to 2031 (US$ Million)
9.5.5.5.1 Rest of Middle East and Africa: Insurance Third-Party Administrator Market Breakdown, by Insurance Type
9.5.5.5.2 Rest of Middle East and Africa: Insurance Third-Party Administrator Market Breakdown, by End Users
9.6 South and Central America
9.6.1 South and Central America Insurance Third-Party Administrator Market Overview
9.6.2 South and Central America: Insurance Third-Party Administrator Market – Revenue and Forecast to 2031 (US$ Million)
9.6.3 South and Central America: Insurance Third-Party Administrator Market Breakdown, by Insurance Type
9.6.3.1 South and Central America: Insurance Third-Party Administrator Market – Revenue and Forecast Analysis – by Insurance Type
9.6.4 South and Central America: Insurance Third-Party Administrator Market Breakdown, by End Users
9.6.4.1 South and Central America: Insurance Third-Party Administrator Market – Revenue and Forecast Analysis – by End Users
9.6.5 South and Central America: Insurance Third-Party Administrator Market – Revenue and Forecast Analysis – by Country
9.6.5.1 South and Central America: Insurance Third-Party Administrator Market – Revenue and Forecast Analysis – by Country
9.6.5.2 Brazil: Insurance Third-Party Administrator Market – Revenue and Forecast to 2031 (US$ Million)
9.6.5.2.1 Brazil: Insurance Third-Party Administrator Market Breakdown, by Insurance Type
9.6.5.2.2 Brazil: Insurance Third-Party Administrator Market Breakdown, by End Users
9.6.5.3 Argentina: Insurance Third-Party Administrator Market – Revenue and Forecast to 2031 (US$ Million)
9.6.5.3.1 Argentina: Insurance Third-Party Administrator Market Breakdown, by Insurance Type
9.6.5.3.2 Argentina: Insurance Third-Party Administrator Market Breakdown, by End Users
9.6.5.4 Rest of South and Central America: Insurance Third-Party Administrator Market – Revenue and Forecast to 2031 (US$ Million)
9.6.5.4.1 Rest of South and Central America: Insurance Third-Party Administrator Market Breakdown, by Insurance Type
9.6.5.4.2 Rest of South and Central America: Insurance Third-Party Administrator Market Breakdown, by End Users
10. Competitive Landscape
10.1 Heat Map Analysis by Key Players
10.2 Company Positioning & Concentration
11. Industry Landscape
11.1 Overview
11.2 Market Initiative
11.3 Merger and Acquisition
11.4 Product Development
12. Company Profiles
12.1 Sedgwick
12.1.1 Key Facts
12.1.2 Business Description
12.1.3 Products and Services
12.1.4 Financial Overview
12.1.5 SWOT Analysis
12.1.6 Key Developments
12.2 Crawford and Company
12.2.1 Key Facts
12.2.2 Business Description
12.2.3 Products and Services
12.2.4 Financial Overview
12.2.5 SWOT Analysis
12.2.6 Key Developments
12.3 CorVel Corp
12.3.1 Key Facts
12.3.2 Business Description
12.3.3 Products and Services
12.3.4 Financial Overview
12.3.5 SWOT Analysis
12.3.6 Key Developments
12.4 UnitedHealth Group Inc
12.4.1 Key Facts
12.4.2 Business Description
12.4.3 Products and Services
12.4.4 Financial Overview
12.4.5 SWOT Analysis
12.4.6 Key Developments
12.5 Liberty Mutual Insurance Company
12.5.1 Key Facts
12.5.2 Business Description
12.5.3 Products and Services
12.5.4 Financial Overview
12.5.5 SWOT Analysis
12.5.6 Key Developments
12.6 Charles Taylor Limited
12.6.1 Key Facts
12.6.2 Business Description
12.6.3 Products and Services
12.6.4 Financial Overview
12.6.5 SWOT Analysis
12.6.6 Key Developments
12.7 ExlService Holdings, Inc.
12.7.1 Key Facts
12.7.2 Business Description
12.7.3 Products and Services
12.7.4 Financial Overview
12.7.5 SWOT Analysis
12.7.6 Key Developments
12.8 Arthur J Gallagher & Co
12.8.1 Key Facts
12.8.2 Business Description
12.8.3 Products and Services
12.8.4 Financial Overview
12.8.5 SWOT Analysis
12.8.6 Key Developments
12.9 Meritain Health
12.9.1 Key Facts
12.9.2 Business Description
12.9.3 Products and Services
12.9.4 Financial Overview
12.9.5 SWOT Analysis
12.9.6 Key Developments
12.10 Chubb Ltd
12.10.1 Key Facts
12.10.2 Business Description
12.10.3 Products and Services
12.10.4 Financial Overview
12.10.5 SWOT Analysis
12.10.6 Key Developments
13. Appendix
13.1 Word Index
13.2 About The Insight Partners
List of Tables
Table 1. Insurance Third-Party Administrator Market Segmentation
Table 2. List of Vendors
Table 3. Insurance Third-Party Administrator Market – Revenue and Forecast to 2031 (US$ Million)
Table 4. Insurance Third-Party Administrator Market – Revenue and Forecast to 2031 (US$ Million) – by Insurance Type
Table 5. Insurance Third-Party Administrator Market – Revenue and Forecast to 2031 (US$ Million) – by End Users
Table 6. North America: Insurance Third-Party Administrator Market – Revenue and Forecast to 2031(US$ Million) – by Insurance Type
Table 7. North America: Insurance Third-Party Administrator Market – Revenue and Forecast to 2031(US$ Million) – by End Users
Table 8. North America: Insurance Third-Party Administrator Market – Revenue and Forecast to 2031(US$ Million) – by Country
Table 9. United States: Insurance Third-Party Administrator Market – Revenue and Forecast to 2031(US$ Million) – by Insurance Type
Table 10. United States: Insurance Third-Party Administrator Market – Revenue and Forecast to 2031(US$ Million) – by End Users
Table 11. Canada: Insurance Third-Party Administrator Market – Revenue and Forecast to 2031(US$ Million) – by Insurance Type
Table 12. Canada: Insurance Third-Party Administrator Market – Revenue and Forecast to 2031(US$ Million) – by End Users
Table 13. Mexico: Insurance Third-Party Administrator Market – Revenue and Forecast to 2031(US$ Million) – by Insurance Type
Table 14. Mexico: Insurance Third-Party Administrator Market – Revenue and Forecast to 2031(US$ Million) – by End Users
Table 15. Europe: Insurance Third-Party Administrator Market – Revenue and Forecast to 2031(US$ Million) – by Insurance Type
Table 16. Europe: Insurance Third-Party Administrator Market – Revenue and Forecast to 2031(US$ Million) – by End Users
Table 17. Europe: Insurance Third-Party Administrator Market – Revenue and Forecast to 2031(US$ Million) – by Country
Table 18. United Kingdom: Insurance Third-Party Administrator Market – Revenue and Forecast to 2031(US$ Million) – by Insurance Type
Table 19. United Kingdom: Insurance Third-Party Administrator Market – Revenue and Forecast to 2031(US$ Million) – by End Users
Table 20. Germany: Insurance Third-Party Administrator Market – Revenue and Forecast to 2031(US$ Million) – by Insurance Type
Table 21. Germany: Insurance Third-Party Administrator Market – Revenue and Forecast to 2031(US$ Million) – by End Users
Table 22. France: Insurance Third-Party Administrator Market – Revenue and Forecast to 2031(US$ Million) – by Insurance Type
Table 23. France: Insurance Third-Party Administrator Market – Revenue and Forecast to 2031(US$ Million) – by End Users
Table 24. Italy: Insurance Third-Party Administrator Market – Revenue and Forecast to 2031(US$ Million) – by Insurance Type
Table 25. Italy: Insurance Third-Party Administrator Market – Revenue and Forecast to 2031(US$ Million) – by End Users
Table 26. Russia: Insurance Third-Party Administrator Market – Revenue and Forecast to 2031(US$ Million) – by Insurance Type
Table 27. Russia: Insurance Third-Party Administrator Market – Revenue and Forecast to 2031(US$ Million) – by End Users
Table 28. Rest of Europe: Insurance Third-Party Administrator Market – Revenue and Forecast to 2031(US$ Million) – by Insurance Type
Table 29. Rest of Europe: Insurance Third-Party Administrator Market – Revenue and Forecast to 2031(US$ Million) – by End Users
Table 30. Asia Pacific: Insurance Third-Party Administrator Market – Revenue and Forecast to 2031(US$ Million) – by Insurance Type
Table 31. Asia Pacific: Insurance Third-Party Administrator Market – Revenue and Forecast to 2031(US$ Million) – by End Users
Table 32. Asia Pacific: Insurance Third-Party Administrator Market – Revenue and Forecast to 2031(US$ Million) – by Country
Table 33. China: Insurance Third-Party Administrator Market – Revenue and Forecast to 2031(US$ Million) – by Insurance Type
Table 34. China: Insurance Third-Party Administrator Market – Revenue and Forecast to 2031(US$ Million) – by End Users
Table 35. Japan: Insurance Third-Party Administrator Market – Revenue and Forecast to 2031(US$ Million) – by Insurance Type
Table 36. Japan: Insurance Third-Party Administrator Market – Revenue and Forecast to 2031(US$ Million) – by End Users
Table 37. South Korea: Insurance Third-Party Administrator Market – Revenue and Forecast to 2031(US$ Million) – by Insurance Type
Table 38. South Korea: Insurance Third-Party Administrator Market – Revenue and Forecast to 2031(US$ Million) – by End Users
Table 39. India: Insurance Third-Party Administrator Market – Revenue and Forecast to 2031(US$ Million) – by Insurance Type
Table 40. India: Insurance Third-Party Administrator Market – Revenue and Forecast to 2031(US$ Million) – by End Users
Table 41. Australia: Insurance Third-Party Administrator Market – Revenue and Forecast to 2031(US$ Million) – by Insurance Type
Table 42. Australia: Insurance Third-Party Administrator Market – Revenue and Forecast to 2031(US$ Million) – by End Users
Table 43. Rest of APAC: Insurance Third-Party Administrator Market – Revenue and Forecast to 2031(US$ Million) – by Insurance Type
Table 44. Rest of APAC: Insurance Third-Party Administrator Market – Revenue and Forecast to 2031(US$ Million) – by End Users
Table 45. Middle East and Africa: Insurance Third-Party Administrator Market – Revenue and Forecast to 2031(US$ Million) – by Insurance Type
Table 46. Middle East and Africa: Insurance Third-Party Administrator Market – Revenue and Forecast to 2031 (US$ Million) – by End Users
Table 47. Middle East and Africa: Insurance Third-Party Administrator Market – Revenue and Forecast to 2031 (US$ Million) – by Country
Table 48. United Arab Emirates: Insurance Third-Party Administrator Market – Revenue and Forecast to 2031(US$ Million) – by Insurance Type
Table 49. United Arab Emirates: Insurance Third-Party Administrator Market – Revenue and Forecast to 2031(US$ Million) – by End Users
Table 50. Saudi Arabia: Insurance Third-Party Administrator Market – Revenue and Forecast to 2031(US$ Million) – by Insurance Type
Table 51. Saudi Arabia: Insurance Third-Party Administrator Market – Revenue and Forecast to 2031(US$ Million) – by End Users
Table 52. South Africa: Insurance Third-Party Administrator Market – Revenue and Forecast to 2031(US$ Million) – by Insurance Type
Table 53. South Africa: Insurance Third-Party Administrator Market – Revenue and Forecast to 2031(US$ Million) – by End Users
Table 54. Rest of Middle East and Africa: Insurance Third-Party Administrator Market – Revenue and Forecast to 2031(US$ Million) – by Insurance Type
Table 55. Rest of Middle East and Africa: Insurance Third-Party Administrator Market – Revenue and Forecast to 2031 (US$ Million) – by End Users
Table 56. South and Central America: Insurance Third-Party Administrator Market – Revenue and Forecast to 2031 (US$ Million) – by Insurance Type
Table 57. South and Central America: Insurance Third-Party Administrator Market – Revenue and Forecast to 2031 (US$ Million) – by End Users
Table 58. South and Central America: Insurance Third-Party Administrator Market – Revenue and Forecast to 2031 (US$ Million) – by Country
Table 59. Brazil: Insurance Third-Party Administrator Market – Revenue and Forecast to 2031(US$ Million) – by Insurance Type
Table 60. Brazil: Insurance Third-Party Administrator Market – Revenue and Forecast to 2031(US$ Million) – by End Users
Table 61. Argentina: Insurance Third-Party Administrator Market – Revenue and Forecast to 2031(US$ Million) – by Insurance Type
Table 62. Argentina: Insurance Third-Party Administrator Market – Revenue and Forecast to 2031(US$ Million) – by End Users
Table 63. Rest of South and Central America: Insurance Third-Party Administrator Market – Revenue and Forecast to 2031(US$ Million) – by Insurance Type
Table 64. Rest of South and Central America: Insurance Third-Party Administrator Market – Revenue and Forecast to 2031(US$ Million) – by End Users
Table 65. Company Positioning & Concentration
Table 66. List of Abbreviation
List of Figures
Figure 1. Insurance Third-Party Administrator Market Segmentation, by Geography
Figure 2. PEST Analysis
Figure 3. Impact Analysis of Drivers and Restraints
Figure 4. Insurance Third-Party Administrator Market Revenue (US$ Million), 2021–2031
Figure 5. Insurance Third-Party Administrator Market Share (%) – by Insurance Type (2023 and 2031)
Figure 6. Healthcare: Insurance Third-Party Administrator Market – Revenue and Forecast to 2031 (US$ Million)
Figure 7. Retirement Plans: Insurance Third-Party Administrator Market – Revenue and Forecast to 2031 (US$ Million)
Figure 8. Commercial General Liability Insurers: Insurance Third-Party Administrator Market – Revenue and Forecast to 2031 (US$ Million)
Figure 9. Other Insurance Types: Insurance Third-Party Administrator Market – Revenue and Forecast to 2031 (US$ Million)
Figure 10. Insurance Third-Party Administrator Market Share (%) – by End Users (2023 and 2031)
Figure 11. Large Enterprises: Insurance Third-Party Administrator Market – Revenue and Forecast to 2031 (US$ Million)
Figure 12. SMEs: Insurance Third-Party Administrator Market – Revenue and Forecast to 2031 (US$ Million)
Figure 13. Insurance Third-Party Administrator Market Breakdown by Region, 2023 and 2031 (%)
Figure 14. North America: Insurance Third-Party Administrator Market – Revenue and Forecast to 2031(US$ Million)
Figure 15. North America: Insurance Third-Party Administrator Market Breakdown, by Insurance Type (2023 and 2031)
Figure 16. North America: Insurance Third-Party Administrator Market Breakdown, by End Users (2023 and 2031)
Figure 17. North America: Insurance Third-Party Administrator Market Breakdown, by Key Countries, 2023 and 2031 (%)
Figure 18. United States: Insurance Third-Party Administrator Market – Revenue and Forecast to 2031(US$ Million)
Figure 19. Canada: Insurance Third-Party Administrator Market – Revenue and Forecast to 2031(US$ Million)
Figure 20. Mexico: Insurance Third-Party Administrator Market – Revenue and Forecast to 2031(US$ Million)
Figure 21. Europe: Insurance Third-Party Administrator Market – Revenue and Forecast to 2031(US$ Million)
Figure 22. Europe: Insurance Third-Party Administrator Market Breakdown, by Insurance Type (2023 and 2031)
Figure 23. Europe: Insurance Third-Party Administrator Market Breakdown, by End Users (2023 and 2031)
Figure 24. Europe: Insurance Third-Party Administrator Market Breakdown, by Key Countries, 2023 and 2031 (%)
Figure 25. United Kingdom: Insurance Third-Party Administrator Market – Revenue and Forecast to 2031(US$ Million)
Figure 26. Germany: Insurance Third-Party Administrator Market – Revenue and Forecast to 2031(US$ Million)
Figure 27. France: Insurance Third-Party Administrator Market – Revenue and Forecast to 2031(US$ Million)
Figure 28. Italy: Insurance Third-Party Administrator Market – Revenue and Forecast to 2031(US$ Million)
Figure 29. Russia: Insurance Third-Party Administrator Market – Revenue and Forecast to 2031(US$ Million)
Figure 30. Rest of Europe: Insurance Third-Party Administrator Market – Revenue and Forecast to 2031(US$ Million)
Figure 31. Asia Pacific: Insurance Third-Party Administrator Market – Revenue and Forecast to 2031(US$ Million)
Figure 32. Asia Pacific: Insurance Third-Party Administrator Market Breakdown, by Insurance Type (2023 and 2031)
Figure 33. Asia Pacific: Insurance Third-Party Administrator Market Breakdown, by End Users (2023 and 2031)
Figure 34. Asia Pacific: Insurance Third-Party Administrator Market Breakdown, by Key Countries, 2023 and 2031 (%)
Figure 35. China: Insurance Third-Party Administrator Market – Revenue and Forecast to 2031(US$ Million)
Figure 36. Japan: Insurance Third-Party Administrator Market – Revenue and Forecast to 2031(US$ Million)
Figure 37. South Korea: Insurance Third-Party Administrator Market – Revenue and Forecast to 2031(US$ Million)
Figure 38. India: Insurance Third-Party Administrator Market – Revenue and Forecast to 2031(US$ Million)
Figure 39. Australia: Insurance Third-Party Administrator Market – Revenue and Forecast to 2031(US$ Million)
Figure 40. Rest of APAC: Insurance Third-Party Administrator Market – Revenue and Forecast to 2031(US$ Million)
Figure 41. Middle East and Africa: Insurance Third-Party Administrator Market – Revenue and Forecast to 2031(US$ Million)
Figure 42. Middle East and Africa: Insurance Third-Party Administrator Market Breakdown, by Insurance Type (2023 and 2031)
Figure 43. Middle East and Africa: Insurance Third-Party Administrator Market Breakdown, by End Users (2023 and 2031)
Figure 44. Middle East and Africa: Insurance Third-Party Administrator Market Breakdown, by Key Countries, 2023 and 2031 (%)
Figure 45. United Arab Emirates: Insurance Third-Party Administrator Market – Revenue and Forecast to 2031(US$ Million)
Figure 46. Saudi Arabia: Insurance Third-Party Administrator Market – Revenue and Forecast to 2031(US$ Million)
Figure 47. South Africa: Insurance Third-Party Administrator Market – Revenue and Forecast to 2031(US$ Million)
Figure 48. Rest of Middle East and Africa: Insurance Third-Party Administrator Market – Revenue and Forecast to 2031 (US$ Million)
Figure 49. South and Central America: Insurance Third-Party Administrator Market – Revenue and Forecast to 2031 (US$ Million)
Figure 50. South and Central America: Insurance Third-Party Administrator Market Breakdown, by Insurance Type (2023 and 2031)
Figure 51. South and Central America: Insurance Third-Party Administrator Market Breakdown, by End Users (2023 and 2031)
Figure 52. South and Central America: Insurance Third-Party Administrator Market Breakdown, by Key Countries, 2023 and 2031 (%)
Figure 53. Brazil: Insurance Third-Party Administrator Market – Revenue and Forecast to 2031(US$ Million)
Figure 54. Argentina: Insurance Third-Party Administrator Market – Revenue and Forecast to 2031(US$ Million)
Figure 55. Rest of South and Central America: Insurance Third-Party Administrator Market – Revenue and Forecast to 2031(US$ Million)
Figure 56. Heat Map Analysis by Key Players
The List of Companies - Insurance Third-Party Administrator Market
- Sedgwick
- Crawford and Company
- CorVel Corp
- UnitedHealth Group Inc
- Liberty Mutual Insurance Company
- Charles Taylor Limited
- ExlService Holdings, Inc.
- Arthur J Gallagher & Co
- Meritain Health
- Chubb Ltd
The Insight Partners performs research in 4 major stages: Data Collection & Secondary Research, Primary Research, Data Analysis and Data Triangulation & Final Review.
- Data Collection and Secondary Research:
As a market research and consulting firm operating from a decade, we have published many reports and advised several clients across the globe. First step for any study will start with an assessment of currently available data and insights from existing reports. Further, historical and current market information is collected from Investor Presentations, Annual Reports, SEC Filings, etc., and other information related to company’s performance and market positioning are gathered from Paid Databases (Factiva, Hoovers, and Reuters) and various other publications available in public domain.
Several associations trade associates, technical forums, institutes, societies and organizations are accessed to gain technical as well as market related insights through their publications such as research papers, blogs and press releases related to the studies are referred to get cues about the market. Further, white papers, journals, magazines, and other news articles published in the last 3 years are scrutinized and analyzed to understand the current market trends.
- Primary Research:
The primarily interview analysis comprise of data obtained from industry participants interview and answers to survey questions gathered by in-house primary team.
For primary research, interviews are conducted with industry experts/CEOs/Marketing Managers/Sales Managers/VPs/Subject Matter Experts from both demand and supply side to get a 360-degree view of the market. The primary team conducts several interviews based on the complexity of the markets to understand the various market trends and dynamics which makes research more credible and precise.
A typical research interview fulfils the following functions:
- Provides first-hand information on the market size, market trends, growth trends, competitive landscape, and outlook
- Validates and strengthens in-house secondary research findings
- Develops the analysis team’s expertise and market understanding
Primary research involves email interactions and telephone interviews for each market, category, segment, and sub-segment across geographies. The participants who typically take part in such a process include, but are not limited to:
- Industry participants: VPs, business development managers, market intelligence managers and national sales managers
- Outside experts: Valuation experts, research analysts and key opinion leaders specializing in the electronics and semiconductor industry.
Below is the breakup of our primary respondents by company, designation, and region:

Once we receive the confirmation from primary research sources or primary respondents, we finalize the base year market estimation and forecast the data as per the macroeconomic and microeconomic factors assessed during data collection.
- Data Analysis:
Once data is validated through both secondary as well as primary respondents, we finalize the market estimations by hypothesis formulation and factor analysis at regional and country level.
- 3.1 Macro-Economic Factor Analysis:
We analyse macroeconomic indicators such the gross domestic product (GDP), increase in the demand for goods and services across industries, technological advancement, regional economic growth, governmental policies, the influence of COVID-19, PEST analysis, and other aspects. This analysis aids in setting benchmarks for various nations/regions and approximating market splits. Additionally, the general trend of the aforementioned components aid in determining the market's development possibilities.
- 3.2 Country Level Data:
Various factors that are especially aligned to the country are taken into account to determine the market size for a certain area and country, including the presence of vendors, such as headquarters and offices, the country's GDP, demand patterns, and industry growth. To comprehend the market dynamics for the nation, a number of growth variables, inhibitors, application areas, and current market trends are researched. The aforementioned elements aid in determining the country's overall market's growth potential.
- 3.3 Company Profile:
The “Table of Contents” is formulated by listing and analyzing more than 25 - 30 companies operating in the market ecosystem across geographies. However, we profile only 10 companies as a standard practice in our syndicate reports. These 10 companies comprise leading, emerging, and regional players. Nonetheless, our analysis is not restricted to the 10 listed companies, we also analyze other companies present in the market to develop a holistic view and understand the prevailing trends. The “Company Profiles” section in the report covers key facts, business description, products & services, financial information, SWOT analysis, and key developments. The financial information presented is extracted from the annual reports and official documents of the publicly listed companies. Upon collecting the information for the sections of respective companies, we verify them via various primary sources and then compile the data in respective company profiles. The company level information helps us in deriving the base number as well as in forecasting the market size.
- 3.4 Developing Base Number:
Aggregation of sales statistics (2020-2022) and macro-economic factor, and other secondary and primary research insights are utilized to arrive at base number and related market shares for 2022. The data gaps are identified in this step and relevant market data is analyzed, collected from paid primary interviews or databases. On finalizing the base year market size, forecasts are developed on the basis of macro-economic, industry and market growth factors and company level analysis.
- Data Triangulation and Final Review:
The market findings and base year market size calculations are validated from supply as well as demand side. Demand side validations are based on macro-economic factor analysis and benchmarks for respective regions and countries. In case of supply side validations, revenues of major companies are estimated (in case not available) based on industry benchmark, approximate number of employees, product portfolio, and primary interviews revenues are gathered. Further revenue from target product/service segment is assessed to avoid overshooting of market statistics. In case of heavy deviations between supply and demand side values, all thes steps are repeated to achieve synchronization.
We follow an iterative model, wherein we share our research findings with Subject Matter Experts (SME’s) and Key Opinion Leaders (KOLs) until consensus view of the market is not formulated – this model negates any drastic deviation in the opinions of experts. Only validated and universally acceptable research findings are quoted in our reports.
We have important check points that we use to validate our research findings – which we call – data triangulation, where we validate the information, we generate from secondary sources with primary interviews and then we re-validate with our internal data bases and Subject matter experts. This comprehensive model enables us to deliver high quality, reliable data in shortest possible time.
 Get Free Sample For