The interactive display market size is projected to reach US$ 18.51 billion by 2031 from US$ 11.30 billion in 2023. The market is expected to register a CAGR of 6.4% during 2023–2031. Growing demand for interactive retail displays is anticipated to be the key interactive display market trend during the forecast period.
Interactive Display Market Analysis
Increasing applications of the interactive display is expected to contribute to the growing interactive display market size. Growing investment in AI technologies and the expansion of the education, BFSI, and retail industries are likely to propel the interactive display market during the forecast period. Moreover, the rising adoption of advanced technologies such as AI and next-generation products is projected to benefit the interactive display market growth.
Interactive Display Market Overview
An interactive display, also known as an interactive touchscreen, is a large wall-mounted device with a digital touchscreen input that allows users to generate visual presentations and manipulate on-screen data. An interactive display is a large tablet that offers dynamic opportunities to both students and teachers by providing familiar access to instruction. These devices are most commonly used in classrooms, meeting rooms, and other collaborative environments by enhancing engagement and facilitating interactive learning and collaboration among users. Growing digitalization and expansion of numerous industries such as education, retail & e-commerce, BFSI, and entertainment are driving the interactive display market growth.
Customize Research To Suit Your Requirement
We can optimize and tailor the analysis and scope which is unmet through our standard offerings. This flexibility will help you gain the exact information needed for your business planning and decision making.
Interactive Display Market: Strategic Insights
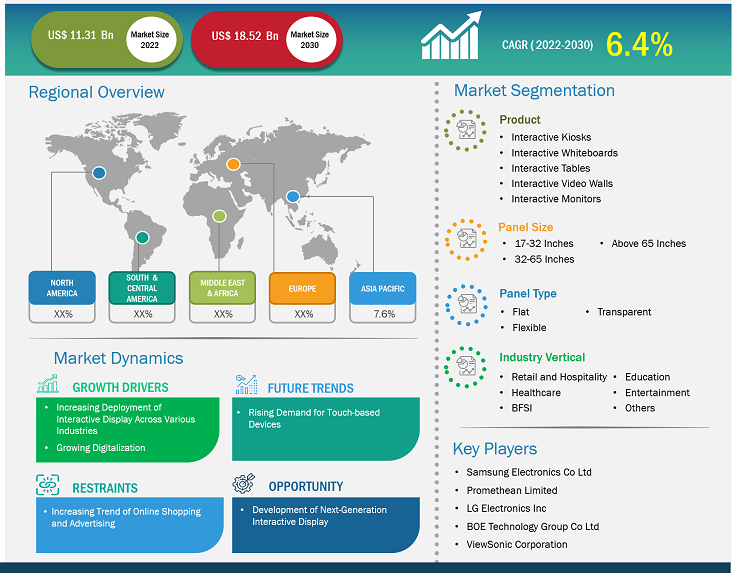
Market Size Value in US$ 11.31 billion in 2022 Market Size Value by US$ 18.52 billion by 2030 Growth rate CAGR of 6.4% from 2022 to 2030 Forecast Period 2022-2030 Base Year 2022

Naveen
Have a question?
Naveen will walk you through a 15-minute call to present the report’s content and answer all queries if you have any.
 Speak to Analyst
Customize Research To Suit Your Requirement
We can optimize and tailor the analysis and scope which is unmet through our standard offerings. This flexibility will help you gain the exact information needed for your business planning and decision making.
Interactive Display Market: Strategic Insights
| Market Size Value in | US$ 11.31 billion in 2022 |
| Market Size Value by | US$ 18.52 billion by 2030 |
| Growth rate | CAGR of 6.4% from 2022 to 2030 |
| Forecast Period | 2022-2030 |
| Base Year | 2022 |
Naveen
Have a question?
Naveen will walk you through a 15-minute call to present the report’s content and answer all queries if you have any.
Speak to Analyst
Interactive Display Market Drivers and Opportunities
Increasing Deployment of Interactive Displays across Various Industries to Favor Market
Interactive display plays a significant role in understanding consumer's needs, wants, likes, and dislikes. These machines help companies to derive valuable insights and understand their customers' buying behavior. Major market players are engaged in developing innovative products or adding features to existing portfolios, such as color optimization and voice assistants. These additional features support companies in attracting new customers across the globe. Moreover, increasing demand and adoption of interactive displays among various industries such as education, retail, BFSI, healthcare, and transportation is fueling the market. For instance, in January 2023, Queenstown Airport upgraded its terminal by installing a Common-use self-service (CUSS) to enhance passengers' experience in the airport. CUSS is a shared kiosk that helps the airport with an easy check-in process and minimizes queues. Growing digitalization and rising demand for digital learning platforms among consumers have also surged the adoption of interactive displays in the education industry. These boards allow learners to visualize and easily understand the concepts. Additionally, the pandemic caused a significant change in the education industry, leading to a rise in digital learning platforms and the use of display boards. The evolution of SMART board technology in the education industry further helps students or learners to perform well and improve their learning, which is anticipated to drive the overall market in the near future.
Development of Next-Generation Interactive Display
Advanced technologies such as artificial intelligence (AI) and the Internet of Things (IoT) are being highly adopted by businesses to streamline operations effectively and attract new customers. Al technology enhances interactive display by adding significant features such as personalized content recommendations, gesture recognition, and adaptive user interfaces. This improves customer interaction by creating dynamic and engaging experiences based on behaviors and preferences. The integration of Al technology in interactive displays helps users analyze data for valuable insights and refine content delivery by making interactive displays more responsive.
The manufacturers of interactive displays are taking initiatives such as collaborating and partnering to develop AI-based and next-generation interactive displays in order to support industries, including retail & e-commerce, BFSI, healthcare, and education, which generates significant opportunities in the market. For instance:
- In June 2023, Hitachi Ltd partnered with LG Electronics Inc. to launch a new AI display for the retail and e-commerce industry. Both companies are developing a 29-inch touchscreen panel that has the biometric infrastructure and public key authentication, with numerous additional features such as a high-definition camera, face recognition technology, and a real-time monitoring system. The AI-based interactive display is designed to fulfill the demands of various customers from retail shops, restaurants, offices, gyms, residential sectors, and conference centers.
- In October 2022, OTI Lumionics raised funding of US$ 55 million to develop display materials for interactive display makers. The material allows manufacturers to create full-view displays without cut-outs for sensors and components. Display technology is revolutionizing the smartphone industry by changing the manufacturing processes of interactive screens.
Increasing investments in R&D activities to develop new technologies are also creating opportunities for market players. For instance, in October 2022, researchers at the Indian Institute of Technology (IIT) Madras developed a new display technology device, the interactive Touch Active Display (iTad). This device is capable of simulating textures such as sharp edges and gritted surfaces. This new display technology has a built-in multi-touch sensor used to detect the movement of a finger through software that controls electric fields via electro-adhesion. Thus, increasing investments in R&D for developing next-generation products are expected to offer lucrative opportunities to the interactive display market during the forecast period.
Interactive Display Market Report Segmentation Analysis
Key segments that contributed to the derivation of the interactive display market analysis are product, panel size, panel type, and industry vertical.
- Based on product, the interactive display market is segmented into interactive kiosks, interactive whiteboards, interactive tables, interactive video walls, and interactive monitors. The interactive kiosks segment is anticipated to hold a significant interactive display market share by 2030. Growing digitalization and the rising deployment of display screens in malls, retail stores, hotels, and schools driving the growth of the segment interactive kiosks’
- Based on panel size, the interactive display market is categorized into 17–32 inches, 32–65 inches, and above 65 inches.
- On the basis of panel type, the market is divided into flat, flexible, and transparent.
- Based on industry vertical, the market is divided into retail & hospitality, healthcare, BFSI, education, entertainment, and others.
Interactive Display Market Share Analysis by Geography
The geographic scope of the interactive display market report is mainly divided into five regions: North America, Asia Pacific, Europe, the Middle East & Africa, and South & Central America.
Asia Pacific dominated the interactive display marketin 2023, owing to the presence of key market players such as Samsung Electronics Co Ltd, LG Electronics Inc, Panasonic Holdings Corp, Sharp Electronics Corp, Hitachi Ltd, BenQ Corporation, and BOE Technology Group Co Ltd. These players are engaged in developing advanced products for different industries. For instance, in May 2023, LG Electronics Inc. launched the LG CreateBoard Interactive Whiteboard solution, which is ideal for digital classrooms. CreateBoard Interactive Whiteboard is integrated with 40 multi-touch points that offer the user an interactive, smooth drawing and writing experience. Moreover, growing investment in the education sector and constant technological advancements are driving the interactive display market, particularly in the world's largest technologically advanced countries such as China, Japan, and South Korea.
Interactive Display Market Report Scope
Interactive Display Market News and Recent Developments
The interactive display market is evaluated by gathering qualitative and quantitative data post primary and secondary research, which includes important corporate publications, association data, and databases. A few of the developments in the interactive display market are listed below:
- Elo Touch Solutions introduced the 2799L open-frame display, which was specially designed for retail and related sectors. The 2799L open frame display is a highly durable customized solution with a 27-inch screen, making it suitable for outdoor use. (Source: Elo Touch Solutions., Press Release, September 2023)
- Samsung Electronics USA showcased Tizen at the National Restaurant Association (NRA) 2023. Tizen is a new interactive kiosk technology that provides greater flexibility by offering a more convenient dining experience to consumers.
(Source: Samsung Electronics, Press Release, May 2023)
Interactive Display Market Report Coverage and Deliverables
The "Interactive Display Market Size and Forecast (2021–2031)" report provides a detailed analysis of the market covering below areas:
- Interactive display market size and forecast at global, regional, and country levels for all the key market segments covered under the scope
- Interactive display market trends as well as market dynamics such as drivers, restraints, and key opportunities
- Detailed PEST/Porter's Five Forces and SWOT analysis
- Interactive display market analysis covering key market trends, global and regional framework, major players, regulations, and recent market developments
- Industry landscape and competition analysis covering market concentration, heat map analysis, prominent players, and recent developments for the interactive display market
- Detailed company profiles

Report Coverage
Revenue forecast, Company Analysis, Industry landscape, Growth factors, and Trends

Segment Covered
Product, Panel Size, Panel Type, and Industry Vertical

Regional Scope
North America, Europe, Asia Pacific, Middle East & Africa, South & Central America

Country Scope
This text is related
to country scope.
Frequently Asked Questions
Samsung Electronics Co Ltd, Promethean Limited, LG Electronics Inc., BOE Technology Group Co Ltd, and ViewSonic Corporation are major players in the market.
The market is expected to reach a value of US$ 18.51 billion by 2031.
Rising demand for smart learning, increasing deployment of interactive displays across various industries, and rising need for effective collaboration are driving the market growth.
The market is anticipated to expand at a CAGR of 6.4% during 2023–2031.
Growing demand for interactive retail displays is a key trend in the market.
Asia Pacific dominated the interactive display market in 2023.
1. Introduction
1.1 The Insight Partners Research Report Guidance
1.2 Market Segmentation
2. Executive Summary
2.1 Key Insights
2.2 Market Attractiveness
3. Research Methodology
3.1 Secondary Research
3.2 Primary Research
3.2.1 Hypothesis formulation:
3.2.2 Macro-economic factor analysis:
3.2.3 Developing base number:
3.2.4 Data Triangulation:
3.2.5 Country level data:
4. Interactive Display Market Landscape
4.1 Overview
4.2 PEST Analysis
4.3 Ecosystem Analysis
5. Interactive Display Market – Key Market Dynamics
5.1 Interactive Display Market – Key Market Dynamics
5.2 Market Drivers
5.2.1 Rising Demand for Smart Learning
5.2.2 Increasing Need for Effective Collaboration
5.3 Market Restraints
5.3.1 High Initial and Maintenance Cost
5.4 Market Opportunities
5.4.1 Development of Next-Generation Interactive Display
5.4.2 Increasing Adoption of Touchscreen Tables
5.5 Future Trends
5.5.1 Growing Demand for Interactive Retail Display
5.6 Impact of Drivers and Restraints:
6. Interactive Display Market – Global Market Analysis
6.1 Interactive Display Market Revenue (US$ Million), 2021–2031
6.2 Interactive Display Market Forecast Analysis
7. Interactive Display Market Analysis – by Product
7.1 Interactive Kiosks
7.1.1 Overview
7.1.2 Interactive Kiosks: Interactive Display Market – Revenue and Forecast to 2031 (US$ Million)
7.2 Interactive Whiteboards
7.2.1 Overview
7.2.2 Interactive Whiteboards: Interactive Display Market – Revenue and Forecast to 2031 (US$ Million)
7.3 Interactive Tables
7.3.1 Overview
7.3.2 Interactive Tables: Interactive Display Market – Revenue and Forecast to 2031 (US$ Million)
7.4 Interactive Video Walls
7.4.1 Overview
7.4.2 Interactive Video Walls: Interactive Display Market – Revenue and Forecast to 2031 (US$ Million)
7.5 Interactive Monitors
7.5.1 Overview
7.5.2 Interactive Monitors: Interactive Display Market – Revenue and Forecast to 2031 (US$ Million)
8. Interactive Display Market Analysis – by Panel Size
8.1-32 Inches
8.1.1 Overview
8.1.2-32 Inches: Interactive Display Market – Revenue and Forecast to 2031 (US$ Million)
8.2-65 Inches
8.2.1 Overview
8.2.2-65 Inches: Interactive Display Market – Revenue and Forecast to 2031 (US$ Million)
8.3 Above 65 Inches
8.3.1 Overview
8.3.2 Above 65 Inches: Interactive Display Market – Revenue and Forecast to 2031 (US$ Million)
9. Interactive Display Market Analysis – by Panel Type
9.1 Flat
9.1.1 Overview
9.1.2 Flat: Interactive Display Market – Revenue and Forecast to 2031 (US$ Million)
9.2 Flexible
9.2.1 Overview
9.2.2 Flexible: Interactive Display Market – Revenue and Forecast to 2031 (US$ Million)
9.3 Transparent
9.3.1 Overview
9.3.2 Transparent: Interactive Display Market – Revenue and Forecast to 2031 (US$ Million)
10. Interactive Display Market Analysis – by Industry Vertical
10.1 Retail and Hospitality
10.1.1 Overview
10.1.2 Retail and Hospitality: Interactive Display Market – Revenue and Forecast to 2031 (US$ Million)
10.2 Healthcare
10.2.1 Overview
10.2.2 Healthcare: Interactive Display Market – Revenue and Forecast to 2031 (US$ Million)
10.3 BFSI
10.3.1 Overview
10.3.2 BFSI: Interactive Display Market – Revenue and Forecast to 2031 (US$ Million)
10.4 Education
10.4.1 Overview
10.4.2 Education: Interactive Display Market – Revenue and Forecast to 2031 (US$ Million)
10.5 Entertainment
10.5.1 Overview
10.5.2 Entertainment: Interactive Display Market – Revenue and Forecast to 2031 (US$ Million)
10.6 Others
10.6.1 Overview
10.6.2 Others: Interactive Display Market – Revenue and Forecast to 2031 (US$ Million)
11. Interactive Display Market – Geographical Analysis
11.1 Overview
11.2 North America
11.2.1 North America Interactive Display Market Overview
11.2.2 North America: Interactive Display Market – Revenue and Forecast to 2031 (US$ Million)
11.2.3 North America: Interactive Display Market Breakdown, by Product
11.2.3.1 North America: Interactive Display Market – Revenue and Forecast Analysis – by Product
11.2.4 North America: Interactive Display Market Breakdown by Panel Size
11.2.4.1 North America: Interactive Display Market – Revenue and Forecast Analysis – by Panel Size
11.2.5 North America: Interactive Display Market Breakdown by Panel Type
11.2.5.1 North America: Interactive Display Market – Revenue and Forecast Analysis – by Panel Type
11.2.6 North America: Interactive Display Market Breakdown by Industry Vertical
11.2.6.1 North America: Interactive Display Market – Revenue and Forecast Analysis – by Industry Vertical
11.2.7 North America: Interactive Display Market – Revenue and Forecast Analysis – by Country
11.2.7.1 North America: Interactive Display Market – Revenue and Forecast Analysis – by Country
11.2.7.2 United States: Interactive Display Market – Revenue and Forecast to 2031 (US$ Million)
11.2.7.2.1 United States: Interactive Display Market Breakdown by Product
11.2.7.2.2 United States: Interactive Display Market Breakdown by Panel Size
11.2.7.2.3 United States: Interactive Display Market Breakdown, by Panel Type
11.2.7.2.4 United States: Interactive Display Market Breakdown by Industry Vertical
11.2.7.3 Canada: Interactive Display Market – Revenue and Forecast to 2031 (US$ Million)
11.2.7.3.1 Canada: Interactive Display Market Breakdown, by Product
11.2.7.3.2 Canada: Interactive Display Market Breakdown, by Panel Size
11.2.7.3.3 Canada: Interactive Display Market Breakdown, by Panel Type
11.2.7.3.4 Canada: Interactive Display Market Breakdown, by Industry Vertical
11.2.7.4 Mexico: Interactive Display Market – Revenue and Forecast to 2031 (US$ Million)
11.2.7.4.1 Mexico: Interactive Display Market Breakdown, by Product
11.2.7.4.2 Mexico: Interactive Display Market Breakdown, by Panel Size
11.2.7.4.3 Mexico: Interactive Display Market Breakdown, by Panel Type
11.2.7.4.4 Mexico: Interactive Display Market Breakdown, by Industry Vertical
11.3 Europe
11.3.1 Europe Interactive Display Market Overview
11.3.2 Europe: Interactive Display Market – Revenue and Forecast to 2031 (US$ Million)
11.3.3 Europe: Interactive Display Market Breakdown, by Product
11.3.3.1 Europe: Interactive Display Market – Revenue and Forecast Analysis – by Product
11.3.4 Europe: Interactive Display Market Breakdown, by Panel Size
11.3.4.1 Europe: Interactive Display Market – Revenue and Forecast Analysis – by Panel Size
11.3.5 Europe: Interactive Display Market Breakdown, by Panel Type
11.3.5.1 Europe: Interactive Display Market – Revenue and Forecast Analysis – by Panel Type
11.3.6 Europe: Interactive Display Market Breakdown, by Industry Vertical
11.3.6.1 Europe: Interactive Display Market – Revenue and Forecast Analysis – by Industry Vertical
11.3.7 Europe: Interactive Display Market – Revenue and Forecast Analysis – by Country
11.3.7.1 Europe: Interactive Display Market – Revenue and Forecast Analysis – by Country
11.3.7.2 Germany: Interactive Display Market – Revenue and Forecast to 2031 (US$ Million)
11.3.7.2.1 Germany: Interactive Display Market Breakdown, by Product
11.3.7.2.2 Germany: Interactive Display Market Breakdown, by Panel Size
11.3.7.2.3 Germany: Interactive Display Market Breakdown, by Panel Type
11.3.7.2.4 Germany: Interactive Display Market Breakdown, by Industry Vertical
11.3.7.3 France: Interactive Display Market – Revenue and Forecast to 2031 (US$ Million)
11.3.7.3.1 France: Interactive Display Market Breakdown, by Product
11.3.7.3.2 France: Interactive Display Market Breakdown, by Panel Size
11.3.7.3.3 France: Interactive Display Market Breakdown, by Panel Type
11.3.7.3.4 France: Interactive Display Market Breakdown, by Industry Vertical
11.3.7.4 Italy: Interactive Display Market – Revenue and Forecast to 2031 (US$ Million)
11.3.7.4.1 Italy: Interactive Display Market Breakdown, by Product
11.3.7.4.2 Italy: Interactive Display Market Breakdown, by Panel Size
11.3.7.4.3 Italy: Interactive Display Market Breakdown, by Panel Type
11.3.7.4.4 Italy: Interactive Display Market Breakdown, by Industry Vertical
11.3.7.5 United Kingdom: Interactive Display Market – Revenue and Forecast to 2031 (US$ Million)
11.3.7.5.1 United Kingdom: Interactive Display Market Breakdown, by Product
11.3.7.5.2 United Kingdom: Interactive Display Market Breakdown, by Panel Size
11.3.7.5.3 United Kingdom: Interactive Display Market Breakdown, by Panel Type
11.3.7.5.4 United Kingdom: Interactive Display Market Breakdown, by Industry Vertical
11.3.7.6 Russia: Interactive Display Market – Revenue and Forecast to 2031 (US$ Million)
11.3.7.6.1 Russia: Interactive Display Market Breakdown, by Product
11.3.7.6.2 Russia: Interactive Display Market Breakdown, by Panel Size
11.3.7.6.3 Russia: Interactive Display Market Breakdown, by Panel Type
11.3.7.6.4 Russia: Interactive Display Market Breakdown, by Industry Vertical
11.3.7.7 Rest of Europe: Interactive Display Market – Revenue and Forecast to 2031 (US$ Million)
11.3.7.7.1 Rest of Europe: Interactive Display Market Breakdown, by Product
11.3.7.7.2 Rest of Europe: Interactive Display Market Breakdown, by Panel Size
11.3.7.7.3 Rest of Europe: Interactive Display Market Breakdown, by Panel Type
11.3.7.7.4 Rest of Europe: Interactive Display Market Breakdown, by Industry Vertical
11.4 Asia Pacific
11.4.1 Asia Pacific Interactive Display Market Overview
11.4.2 Asia Pacific: Interactive Display Market – Revenue and Forecast to 2031 (US$ Million)
11.4.3 Asia Pacific: Interactive Display Market Breakdown, by Product
11.4.3.1 Asia Pacific: Interactive Display Market – Revenue and Forecast Analysis – by Product
11.4.4 Asia Pacific: Interactive Display Market Breakdown, by Panel Size
11.4.4.1 Asia Pacific: Interactive Display Market – Revenue and Forecast Analysis – by Panel Size
11.4.5 Asia Pacific: Interactive Display Market Breakdown, by Panel Type
11.4.5.1 Asia Pacific: Interactive Display Market – Revenue and Forecast Analysis – by Panel Type
11.4.6 Asia Pacific: Interactive Display Market Breakdown, by Industry Vertical
11.4.6.1 Asia Pacific: Interactive Display Market – Revenue and Forecast Analysis – by Industry Vertical
11.4.7 Asia Pacific: Interactive Display Market – Revenue and Forecast Analysis – by Country
11.4.7.1 Asia Pacific: Interactive Display Market – Revenue and Forecast Analysis – by Country
11.4.7.2 Australia: Interactive Display Market – Revenue and Forecast to 2031 (US$ Million)
11.4.7.2.1 Australia: Interactive Display Market Breakdown by Product
11.4.7.2.2 Australia: Interactive Display Market Breakdown, by Panel Size
11.4.7.2.3 Australia: Interactive Display Market Breakdown, by Panel Type
11.4.7.2.4 Australia: Interactive Display Market Breakdown, by Industry Vertical
11.4.7.3 China: Interactive Display Market – Revenue and Forecast to 2031 (US$ Million)
11.4.7.3.1 China: Interactive Display Market Breakdown by Product
11.4.7.3.2 China: Interactive Display Market Breakdown by Panel Size
11.4.7.3.3 China: Interactive Display Market Breakdown by Panel Type
11.4.7.3.4 China: Interactive Display Market Breakdown by Industry Vertical
11.4.7.4 Japan: Interactive Display Market – Revenue and Forecast to 2031 (US$ Million)
11.4.7.4.1 Japan: Interactive Display Market Breakdown by Product
11.4.7.4.2 Japan: Interactive Display Market Breakdown by Panel Size
11.4.7.4.3 Japan: Interactive Display Market Breakdown, by Panel Type
11.4.7.4.4 Japan: Interactive Display Market Breakdown, by Industry Vertical
11.4.7.5 India: Interactive Display Market – Revenue and Forecast to 2031 (US$ Million)
11.4.7.5.1 India: Interactive Display Market Breakdown, by Product
11.4.7.5.2 India: Interactive Display Market Breakdown by Panel Size
11.4.7.5.3 India: Interactive Display Market Breakdown by Panel Type
11.4.7.5.4 India: Interactive Display Market Breakdown, by Industry Vertical
11.4.7.6 South Korea: Interactive Display Market – Revenue and Forecast to 2031 (US$ Million)
11.4.7.6.1 South Korea: Interactive Display Market Breakdown by Product
11.4.7.6.2 South Korea: Interactive Display Market Breakdown by Panel Size
11.4.7.6.3 South Korea: Interactive Display Market Breakdown by Panel Type
11.4.7.6.4 South Korea: Interactive Display Market Breakdown by Industry Vertical
11.4.7.7 Rest of APAC: Interactive Display Market – Revenue and Forecast to 2031 (US$ Million)
11.4.7.7.1 Rest of APAC: Interactive Display Market Breakdown by Product
11.4.7.7.2 Rest of APAC: Interactive Display Market Breakdown by Panel Size
11.4.7.7.3 Rest of APAC: Interactive Display Market Breakdown by Panel Type
11.4.7.7.4 Rest of APAC: Interactive Display Market Breakdown by Industry Vertical
11.5 Middle East and Africa
11.5.1 Middle East and Africa Interactive Display Market Overview
11.5.2 Middle East and Africa: Interactive Display Market – Revenue and Forecast to 2031 (US$ Million)
11.5.3 Middle East and Africa: Interactive Display Market Breakdown, by Product
11.5.3.1 Middle East and Africa: Interactive Display Market – Revenue and Forecast Analysis – by Product
11.5.4 Middle East and Africa: Interactive Display Market Breakdown by Panel Size
11.5.4.1 Middle East and Africa: Interactive Display Market – Revenue and Forecast Analysis – by Panel Size
11.5.5 Middle East and Africa: Interactive Display Market Breakdown, by Panel Type
11.5.5.1 Middle East and Africa: Interactive Display Market – Revenue and Forecast Analysis – by Panel Type
11.5.6 Middle East and Africa: Interactive Display Market Breakdown, by Industry Vertical
11.5.6.1 Middle East and Africa: Interactive Display Market – Revenue and Forecast Analysis – by Industry Vertical
11.5.7 Middle East and Africa: Interactive Display Market – Revenue and Forecast Analysis – by Country
11.5.7.1 Middle East and Africa: Interactive Display Market – Revenue and Forecast Analysis – by Country
11.5.7.2 South Africa: Interactive Display Market – Revenue and Forecast to 2031 (US$ Million)
11.5.7.2.1 South Africa: Interactive Display Market Breakdown by Product
11.5.7.2.2 South Africa: Interactive Display Market Breakdown by Panel Size
11.5.7.2.3 South Africa: Interactive Display Market Breakdown by Panel Type
11.5.7.2.4 South Africa: Interactive Display Market Breakdown by Industry Vertical
11.5.7.3 Saudi Arabia: Interactive Display Market – Revenue and Forecast to 2031 (US$ Million)
11.5.7.3.1 Saudi Arabia: Interactive Display Market Breakdown by Product
11.5.7.3.2 Saudi Arabia: Interactive Display Market Breakdown by Panel Size
11.5.7.3.3 Saudi Arabia: Interactive Display Market Breakdown by Panel Type
11.5.7.3.4 Saudi Arabia: Interactive Display Market Breakdown by Industry Vertical
11.5.7.4 United Arab Emirates: Interactive Display Market – Revenue and Forecast to 2031 (US$ Million)
11.5.7.4.1 United Arab Emirates: Interactive Display Market Breakdown by Product
11.5.7.4.2 United Arab Emirates: Interactive Display Market Breakdown by Panel Size
11.5.7.4.3 United Arab Emirates: Interactive Display Market Breakdown by Panel Type
11.5.7.4.4 United Arab Emirates: Interactive Display Market Breakdown, by Industry Vertical
11.5.7.5 Rest of Middle East and Africa: Interactive Display Market – Revenue and Forecast to 2031 (US$ Million)
11.5.7.5.1 Rest of Middle East and Africa: Interactive Display Market Breakdown by Product
11.5.7.5.2 Rest of Middle East and Africa: Interactive Display Market Breakdown, by Panel Size
11.5.7.5.3 Rest of Middle East and Africa: Interactive Display Market Breakdown, by Panel Type
11.5.7.5.4 Rest of Middle East and Africa: Interactive Display Market Breakdown, by Industry Vertical
11.6 South and Central America
11.6.1 South and Central America Interactive Display Market Overview
11.6.2 South and Central America: Interactive Display Market – Revenue and Forecast to 2031 (US$ Million)
11.6.3 South and Central America: Interactive Display Market Breakdown by Product
11.6.3.1 South and Central America: Interactive Display Market – Revenue and Forecast Analysis – by Product
11.6.4 South and Central America: Interactive Display Market Breakdown by Panel Size
11.6.4.1 South and Central America: Interactive Display Market – Revenue and Forecast Analysis – by Panel Size
11.6.5 South and Central America: Interactive Display Market Breakdown by Panel Type
11.6.5.1 South and Central America: Interactive Display Market – Revenue and Forecast Analysis – by Panel Type
11.6.6 South and Central America: Interactive Display Market Breakdown by Industry Vertical
11.6.6.1 South and Central America: Interactive Display Market – Revenue and Forecast Analysis – by Industry Vertical
11.6.7 South and Central America: Interactive Display Market – Revenue and Forecast Analysis – by Country
11.6.7.1 South and Central America: Interactive Display Market – Revenue and Forecast Analysis – by Country
11.6.7.2 Brazil: Interactive Display Market – Revenue and Forecast to 2031 (US$ Million)
11.6.7.2.1 Brazil: Interactive Display Market Breakdown by Product
11.6.7.2.2 Brazil: Interactive Display Market Breakdown by Panel Size
11.6.7.2.3 Brazil: Interactive Display Market Breakdown by Panel Type
11.6.7.2.4 Brazil: Interactive Display Market Breakdown by Industry Vertical
11.6.7.3 Argentina: Interactive Display Market – Revenue and Forecast to 2031 (US$ Million)
11.6.7.3.1 Argentina: Interactive Display Market Breakdown by Product
11.6.7.3.2 Argentina: Interactive Display Market Breakdown by Panel Size
11.6.7.3.3 Argentina: Interactive Display Market Breakdown, by Panel Type
11.6.7.3.4 Argentina: Interactive Display Market Breakdown, by Industry Vertical
11.6.7.4 Rest of South and Central America: Interactive Display Market – Revenue and Forecast to 2031 (US$ Million)
11.6.7.4.1 Rest of South and Central America: Interactive Display Market Breakdown by Product
11.6.7.4.2 Rest of South and Central America: Interactive Display Market Breakdown, by Panel Size
11.6.7.4.3 Rest of South and Central America: Interactive Display Market Breakdown, by Panel Type
11.6.7.4.4 Rest of South and Central America: Interactive Display Market Breakdown, by Industry Vertical
12. Competitive Landscape
12.1 Company Positioning & Concentration
13. Industry Landscape
13.1 Overview
13.2 Market Initiative
13.3 Product Development
14. Company Profiles
14.1 Samsung Electronics Co Ltd
14.1.1 Key Facts
14.1.2 Business Description
14.1.3 Products and Services
14.1.4 Financial Overview
14.1.5 SWOT Analysis
14.1.6 Key Developments
14.2 PROMETHEAN LIMITED
14.2.1 Key Facts
14.2.2 Business Description
14.2.3 Products and Services
14.2.4 Financial Overview
14.2.5 SWOT Analysis
14.2.6 Key Developments
14.3 LG Electronics Inc
14.3.1 Key Facts
14.3.2 Business Description
14.3.3 Products and Services
14.3.4 Financial Overview
14.3.5 SWOT Analysis
14.3.6 Key Developments
14.4 BOE Technology Group Co Ltd
14.4.1 Key Facts
14.4.2 Business Description
14.4.3 Products and Services
14.4.4 Financial Overview
14.4.5 SWOT Analysis
14.4.6 Key Developments
14.5 Panasonic Holdings Corp
14.5.1 Key Facts
14.5.2 Business Description
14.5.3 Products and Services
14.5.4 Financial Overview
14.5.5 SWOT Analysis
14.5.6 Key Developments
14.6 Sharp Electronics Corp
14.6.1 Key Facts
14.6.2 Business Description
14.6.3 Products and Services
14.6.4 Financial Overview
14.6.5 SWOT Analysis
14.6.6 Key Developments
14.7 Hitachi Ltd
14.7.1 Key Facts
14.7.2 Business Description
14.7.3 Products and Services
14.7.4 Financial Overview
14.7.5 SWOT Analysis
14.7.6 Key Developments
14.8 BenQ Corporation
14.8.1 Key Facts
14.8.2 Business Description
14.8.3 Products and Services
14.8.4 Financial Overview
14.8.5 SWOT Analysis
14.8.6 Key Developments
14.9 SMART TECHNOLOGIES ULC
14.9.1 Key Facts
14.9.2 Business Description
14.9.3 Products and Services
14.9.4 Financial Overview
14.9.5 SWOT Analysis
14.9.6 Key Developments
14.10 ViewSonic Corporation
14.10.1 Key Facts
14.10.2 Business Description
14.10.3 Products and Services
14.10.4 Financial Overview
14.10.5 SWOT Analysis
14.10.6 Key Developments
15. Appendix
15.1 Word Index
15.2 About The Insight Partners
List of Tables
Table 1. Interactive Display Market Segmentation
Table 2. List of Vendors in the Value Chain:
Table 3. Interactive Display Market – Revenue and Forecast to 2031 (US$ Million)
Table 4. Interactive Display Market – Revenue and Forecast to 2031 (US$ Million) – by Product
Table 5. Interactive Display Market – Revenue and Forecast to 2031 (US$ Million) – by Panel Size
Table 6. Interactive Display Market – Revenue and Forecast to 2031 (US$ Million) – by Panel Type
Table 7. Interactive Display Market – Revenue and Forecast to 2031 (US$ Million) – by Industry Vertical
Table 8. North America: Interactive Display Market – Revenue and Forecast to 2031(US$ Million) – by Product
Table 9. North America: Interactive Display Market – Revenue and Forecast to 2031(US$ Million) – by Panel Size
Table 10. North America: Interactive Display Market – Revenue and Forecast to 2031(US$ Million) – by Panel Type
Table 11. North America: Interactive Display Market – Revenue and Forecast to 2031(US$ Million) – by Industry Vertical
Table 12. North America: Interactive Display Market – Revenue and Forecast to 2031(US$ Million) – by Country
Table 13. United States: Interactive Display Market – Revenue and Forecast to 2031(US$ Million) – by Product
Table 14. United States: Interactive Display Market – Revenue and Forecast to 2031(US$ Million) – by Panel Size
Table 15. United States: Interactive Display Market – Revenue and Forecast to 2031(US$ Million) – by Panel Type
Table 16. United States: Interactive Display Market – Revenue and Forecast to 2031(US$ Million) – by Industry Vertical
Table 17. Canada: Interactive Display Market – Revenue and Forecast to 2031(US$ Million) – by Product
Table 18. Canada: Interactive Display Market – Revenue and Forecast to 2031(US$ Million) – by Panel Size
Table 19. Canada: Interactive Display Market – Revenue and Forecast to 2031(US$ Million) – by Panel Type
Table 20. Canada: Interactive Display Market – Revenue and Forecast to 2031(US$ Million) – by Industry Vertical
Table 21. Mexico: Interactive Display Market – Revenue and Forecast to 2031(US$ Million) – by Product
Table 22. Mexico: Interactive Display Market – Revenue and Forecast to 2031(US$ Million) – by Panel Size
Table 23. Mexico: Interactive Display Market – Revenue and Forecast to 2031(US$ Million) – by Panel Type
Table 24. Mexico: Interactive Display Market – Revenue and Forecast to 2031(US$ Million) – by Industry Vertical
Table 25. Europe: Interactive Display Market – Revenue and Forecast to 2031(US$ Million) – by Product
Table 26. Europe: Interactive Display Market – Revenue and Forecast to 2031(US$ Million) – by Panel Size
Table 27. Europe: Interactive Display Market – Revenue and Forecast to 2031(US$ Million) – by Panel Type
Table 28. Europe: Interactive Display Market – Revenue and Forecast to 2031(US$ Million) – by Industry Vertical
Table 29. Europe: Interactive Display Market – Revenue and Forecast to 2031(US$ Million) – by Country
Table 30. Germany: Interactive Display Market – Revenue and Forecast to 2031(US$ Million) – by Product
Table 31. Germany: Interactive Display Market – Revenue and Forecast to 2031(US$ Million) – by Panel Size
Table 32. Germany: Interactive Display Market – Revenue and Forecast to 2031(US$ Million) – by Panel Type
Table 33. Germany: Interactive Display Market – Revenue and Forecast to 2031(US$ Million) – by Industry Vertical
Table 34. France: Interactive Display Market – Revenue and Forecast to 2031(US$ Million) – by Product
Table 35. France: Interactive Display Market – Revenue and Forecast to 2031(US$ Million) – by Panel Size
Table 36. France: Interactive Display Market – Revenue and Forecast to 2031(US$ Million) – by Panel Type
Table 37. France: Interactive Display Market – Revenue and Forecast to 2031(US$ Million) – by Industry Vertical
Table 38. Italy: Interactive Display Market – Revenue and Forecast to 2031(US$ Million) – by Product
Table 39. Italy: Interactive Display Market – Revenue and Forecast to 2031(US$ Million) – by Panel Size
Table 40. Italy: Interactive Display Market – Revenue and Forecast to 2031(US$ Million) – by Panel Type
Table 41. Italy: Interactive Display Market – Revenue and Forecast to 2031(US$ Million) – by Industry Vertical
Table 42. United Kingdom: Interactive Display Market – Revenue and Forecast to 2031(US$ Million) – by Product
Table 43. United Kingdom: Interactive Display Market – Revenue and Forecast to 2031(US$ Million) – by Panel Size
Table 44. United Kingdom: Interactive Display Market – Revenue and Forecast to 2031(US$ Million) – by Panel Type
Table 45. United Kingdom: Interactive Display Market – Revenue and Forecast to 2031(US$ Million) – by Industry Vertical
Table 46. Russia: Interactive Display Market – Revenue and Forecast to 2031(US$ Million) – by Product
Table 47. Russia: Interactive Display Market – Revenue and Forecast to 2031(US$ Million) – by Panel Size
Table 48. Russia: Interactive Display Market – Revenue and Forecast to 2031(US$ Million) – by Panel Type
Table 49. Russia: Interactive Display Market – Revenue and Forecast to 2031(US$ Million) – by Industry Vertical
Table 50. Rest of Europe: Interactive Display Market – Revenue and Forecast to 2031(US$ Million) – by Product
Table 51. Rest of Europe: Interactive Display Market – Revenue and Forecast to 2031(US$ Million) – by Panel Size
Table 52. Rest of Europe: Interactive Display Market – Revenue and Forecast to 2031(US$ Million) – by Panel Type
Table 53. Rest of Europe: Interactive Display Market – Revenue and Forecast to 2031(US$ Million) – by Industry Vertical
Table 54. Asia Pacific: Interactive Display Market – Revenue and Forecast to 2031(US$ Million) – by Product
Table 55. Asia Pacific: Interactive Display Market – Revenue and Forecast to 2031(US$ Million) – by Panel Size
Table 56. Asia Pacific: Interactive Display Market – Revenue and Forecast to 2031(US$ Million) – by Panel Type
Table 57. Asia Pacific: Interactive Display Market – Revenue and Forecast to 2031(US$ Million) – by Industry Vertical
Table 58. Asia Pacific: Interactive Display Market – Revenue and Forecast to 2031(US$ Million) – by Country
Table 59. Australia: Interactive Display Market – Revenue and Forecast to 2031(US$ Million) – by Product
Table 60. Australia: Interactive Display Market – Revenue and Forecast to 2031(US$ Million) – by Panel Size
Table 61. Australia: Interactive Display Market – Revenue and Forecast to 2031(US$ Million) – by Panel Type
Table 62. Australia: Interactive Display Market – Revenue and Forecast to 2031(US$ Million) – by Industry Vertical
Table 63. China: Interactive Display Market – Revenue and Forecast to 2031(US$ Million) – by Product
Table 64. China: Interactive Display Market – Revenue and Forecast to 2031(US$ Million) – by Panel Size
Table 65. China: Interactive Display Market – Revenue and Forecast to 2031(US$ Million) – by Panel Type
Table 66. China: Interactive Display Market – Revenue and Forecast to 2031(US$ Million) – by Industry Vertical
Table 67. Japan: Interactive Display Market – Revenue and Forecast to 2031(US$ Million) – by Product
Table 68. Japan: Interactive Display Market – Revenue and Forecast to 2031(US$ Million) – by Panel Size
Table 69. Japan: Interactive Display Market – Revenue and Forecast to 2031(US$ Million) – by Panel Type
Table 70. Japan: Interactive Display Market – Revenue and Forecast to 2031(US$ Million) – by Industry Vertical
Table 71. India: Interactive Display Market – Revenue and Forecast to 2031(US$ Million) – by Product
Table 72. India: Interactive Display Market – Revenue and Forecast to 2031(US$ Million) – by Panel Size
Table 73. India: Interactive Display Market – Revenue and Forecast to 2031(US$ Million) – by Panel Type
Table 74. India: Interactive Display Market – Revenue and Forecast to 2031(US$ Million) – by Industry Vertical
Table 75. South Korea: Interactive Display Market – Revenue and Forecast to 2031(US$ Million) – by Product
Table 76. South Korea: Interactive Display Market – Revenue and Forecast to 2031(US$ Million) – by Panel Size
Table 77. South Korea: Interactive Display Market – Revenue and Forecast to 2031(US$ Million) – by Panel Type
Table 78. South Korea: Interactive Display Market – Revenue and Forecast to 2031(US$ Million) – by Industry Vertical
Table 79. Rest of APAC: Interactive Display Market – Revenue and Forecast to 2031(US$ Million) – by Product
Table 80. Rest of APAC: Interactive Display Market – Revenue and Forecast to 2031(US$ Million) – by Panel Size
Table 81. Rest of APAC: Interactive Display Market – Revenue and Forecast to 2031(US$ Million) – by Panel Type
Table 82. Rest of APAC: Interactive Display Market – Revenue and Forecast to 2031(US$ Million) – by Industry Vertical
Table 83. Middle East and Africa: Interactive Display Market – Revenue and Forecast to 2031(US$ Million) – by Product
Table 84. Middle East and Africa: Interactive Display Market – Revenue and Forecast to 2031(US$ Million) – by Panel Size
Table 85. Middle East and Africa: Interactive Display Market – Revenue and Forecast to 2031(US$ Million) – by Panel Type
Table 86. Middle East and Africa: Interactive Display Market – Revenue and Forecast to 2031(US$ Million) – by Industry Vertical
Table 87. Middle East and Africa: Interactive Display Market – Revenue and Forecast to 2031(US$ Million) – by Country
Table 88. South Africa: Interactive Display Market – Revenue and Forecast to 2031(US$ Million) – by Product
Table 89. South Africa: Interactive Display Market – Revenue and Forecast to 2031(US$ Million) – by Panel Size
Table 90. South Africa: Interactive Display Market – Revenue and Forecast to 2031(US$ Million) – by Panel Type
Table 91. South Africa: Interactive Display Market – Revenue and Forecast to 2031(US$ Million) – by Industry Vertical
Table 92. Saudi Arabia: Interactive Display Market – Revenue and Forecast to 2031(US$ Million) – by Product
Table 93. Saudi Arabia: Interactive Display Market – Revenue and Forecast to 2031(US$ Million) – by Panel Size
Table 94. Saudi Arabia: Interactive Display Market – Revenue and Forecast to 2031(US$ Million) – by Panel Type
Table 95. Saudi Arabia: Interactive Display Market – Revenue and Forecast to 2031(US$ Million) – by Industry Vertical
Table 96. United Arab Emirates: Interactive Display Market – Revenue and Forecast to 2031(US$ Million) – by Product
Table 97. United Arab Emirates: Interactive Display Market – Revenue and Forecast to 2031(US$ Million) – by Panel Size
Table 98. United Arab Emirates: Interactive Display Market – Revenue and Forecast to 2031(US$ Million) – by Panel Type
Table 99. United Arab Emirates: Interactive Display Market – Revenue and Forecast to 2031(US$ Million) – by Industry Vertical
Table 100. Rest of Middle East and Africa: Interactive Display Market – Revenue and Forecast to 2031(US$ Million) – by Product
Table 101. Rest of Middle East and Africa: Interactive Display Market – Revenue and Forecast to 2031(US$ Million) – by Panel Size
Table 102. Rest of Middle East and Africa: Interactive Display Market – Revenue and Forecast to 2031(US$ Million) – by Panel Type
Table 103. Rest of Middle East and Africa: Interactive Display Market – Revenue and Forecast to 2031(US$ Million) – by Industry Vertical
Table 104. South and Central America: Interactive Display Market – Revenue and Forecast to 2031(US$ Million) – by Product
Table 105. South and Central America: Interactive Display Market – Revenue and Forecast to 2031(US$ Million) – by Panel Size
Table 106. South and Central America: Interactive Display Market – Revenue and Forecast to 2031(US$ Million) – by Panel Type
Table 107. South and Central America: Interactive Display Market – Revenue and Forecast to 2031(US$ Million) – by Industry Vertical
Table 108. South and Central America: Interactive Display Market – Revenue and Forecast to 2031(US$ Million) – by Country
Table 109. Brazil: Interactive Display Market – Revenue and Forecast to 2031(US$ Million) – by Product
Table 110. Brazil: Interactive Display Market – Revenue and Forecast to 2031(US$ Million) – by Panel Size
Table 111. Brazil: Interactive Display Market – Revenue and Forecast to 2031(US$ Million) – by Panel Type
Table 112. Brazil: Interactive Display Market – Revenue and Forecast to 2031(US$ Million) – by Industry Vertical
Table 113. Argentina: Interactive Display Market – Revenue and Forecast to 2031(US$ Million) – by Product
Table 114. Argentina: Interactive Display Market – Revenue and Forecast to 2031(US$ Million) – by Panel Size
Table 115. Argentina: Interactive Display Market – Revenue and Forecast to 2031(US$ Million) – by Panel Type
Table 116. Argentina: Interactive Display Market – Revenue and Forecast to 2031(US$ Million) – by Industry Vertical
Table 117. Rest of South and Central America: Interactive Display Market – Revenue and Forecast to 2031(US$ Million) – by Product
Table 118. Rest of South and Central America: Interactive Display Market – Revenue and Forecast to 2031(US$ Million) – by Panel Size
Table 119. Rest of South and Central America: Interactive Display Market – Revenue and Forecast to 2031(US$ Million) – by Panel Type
Table 120. Rest of South and Central America: Interactive Display Market – Revenue and Forecast to 2031(US$ Million) – by Industry Vertical
Table 121. List of Abbreviation
List of Figures
Figure 1. Interactive Display Market Segmentation, by Geography
Figure 2. PEST Analysis
Figure 3. Impact Analysis of Drivers and Restraints
Figure 4. Interactive Display Market Revenue (US$ Million), 2021–2031
Figure 5. Interactive Display Market Share (%) – by Product (2023 and 2031)
Figure 6. Interactive Kiosks: Interactive Display Market – Revenue and Forecast to 2031 (US$ Million)
Figure 7. Interactive Whiteboards: Interactive Display Market – Revenue and Forecast to 2031 (US$ Million)
Figure 8. Interactive Tables: Interactive Display Market – Revenue and Forecast to 2031 (US$ Million)
Figure 9. Interactive Video Walls: Interactive Display Market – Revenue and Forecast to 2031 (US$ Million)
Figure 10. Interactive Monitors: Interactive Display Market – Revenue and Forecast to 2031 (US$ Million)
Figure 11. Interactive Display Market Share (%) – by Panel Size (2023 and 2031)
Figure 12.-32 Inches: Interactive Display Market – Revenue and Forecast to 2031 (US$ Million)
Figure 13.-65 Inches: Interactive Display Market – Revenue and Forecast to 2031 (US$ Million)
Figure 14. Above 65 Inches: Interactive Display Market – Revenue and Forecast to 2031 (US$ Million)
Figure 15. Interactive Display Market Share (%) – by Panel Type (2023 and 2031)
Figure 16. Flat: Interactive Display Market – Revenue and Forecast to 2031 (US$ Million)
Figure 17. Flexible: Interactive Display Market – Revenue and Forecast to 2031 (US$ Million)
Figure 18. Transparent: Interactive Display Market – Revenue and Forecast to 2031 (US$ Million)
Figure 19. Interactive Display Market Share (%) – by Industry Vertical (2023 and 2031)
Figure 20. Retail and Hospitality: Interactive Display Market – Revenue and Forecast to 2031 (US$ Million)
Figure 21. Healthcare: Interactive Display Market – Revenue and Forecast to 2031 (US$ Million)
Figure 22. BFSI: Interactive Display Market – Revenue and Forecast to 2031 (US$ Million)
Figure 23. Education: Interactive Display Market – Revenue and Forecast to 2031 (US$ Million)
Figure 24. Entertainment: Interactive Display Market – Revenue and Forecast to 2031 (US$ Million)
Figure 25. Others: Interactive Display Market – Revenue and Forecast to 2031 (US$ Million)
Figure 26. Interactive Display Market Breakdown by Region, 2023 and 2031 (%)
Figure 27. North America: Interactive Display Market – Revenue and Forecast to 2031(US$ Million)
Figure 28. North America: Interactive Display Market Breakdown by Product (2023 and 2031)
Figure 29. North America: Interactive Display Market Breakdown by Panel Size (2023 and 2031)
Figure 30. North America: Interactive Display Market Breakdown by Panel Type (2023 and 2031)
Figure 31. North America: Interactive Display Market Breakdown by Industry Vertical (2023 and 2031)
Figure 32. North America: Interactive Display Market Breakdown, by Key Countries, 2023 and 2031 (%)
Figure 33. United States: Interactive Display Market – Revenue and Forecast to 2031(US$ Million)
Figure 34. Canada: Interactive Display Market – Revenue and Forecast to 2031(US$ Million)
Figure 35. Mexico: Interactive Display Market – Revenue and Forecast to 2031(US$ Million)
Figure 36. Europe: Interactive Display Market – Revenue and Forecast to 2031(US$ Million)
Figure 37. Europe: Interactive Display Market Breakdown, by Product (2023 and 2031)
Figure 38. Europe: Interactive Display Market Breakdown, by Panel Size (2023 and 2031)
Figure 39. Europe: Interactive Display Market Breakdown, by Panel Type (2023 and 2031)
Figure 40. Europe: Interactive Display Market Breakdown, by Industry Vertical (2023 and 2031)
Figure 41. Europe: Interactive Display Market Breakdown, by Key Countries, 2023 and 2031 (%)
Figure 42. Germany: Interactive Display Market – Revenue and Forecast to 2031(US$ Million)
Figure 43. France: Interactive Display Market – Revenue and Forecast to 2031(US$ Million)
Figure 44. Italy: Interactive Display Market – Revenue and Forecast to 2031(US$ Million)
Figure 45. United Kingdom: Interactive Display Market – Revenue and Forecast to 2031(US$ Million)
Figure 46. Russia: Interactive Display Market – Revenue and Forecast to 2031(US$ Million)
Figure 47. Rest of Europe: Interactive Display Market – Revenue and Forecast to 2031(US$ Million)
Figure 48. Asia Pacific: Interactive Display Market – Revenue and Forecast to 2031(US$ Million)
Figure 49. Asia Pacific: Interactive Display Market Breakdown, by Product (2023 and 2031)
Figure 50. Asia Pacific: Interactive Display Market Breakdown, by Panel Size (2023 and 2031)
Figure 51. Asia Pacific: Interactive Display Market Breakdown, by Panel Type (2023 and 2031)
Figure 52. Asia Pacific: Interactive Display Market Breakdown, by Industry Vertical (2023 and 2031)
Figure 53. Asia Pacific: Interactive Display Market Breakdown, by Key Countries, 2023 and 2031 (%)
Figure 54. Australia: Interactive Display Market – Revenue and Forecast to 2031(US$ Million)
Figure 55. China: Interactive Display Market – Revenue and Forecast to 2031(US$ Million)
Figure 56. Japan: Interactive Display Market – Revenue and Forecast to 2031(US$ Million)
Figure 57. India: Interactive Display Market – Revenue and Forecast to 2031(US$ Million)
Figure 58. South Korea: Interactive Display Market – Revenue and Forecast to 2031(US$ Million)
Figure 59. Rest of APAC: Interactive Display Market – Revenue and Forecast to 2031(US$ Million)
Figure 60. Middle East and Africa: Interactive Display Market – Revenue and Forecast to 2031(US$ Million)
Figure 61. Middle East and Africa: Interactive Display Market Breakdown by Product (2023 and 2031)
Figure 62. Middle East and Africa: Interactive Display Market Breakdown by Panel Size (2023 and 2031)
Figure 63. Middle East and Africa: Interactive Display Market Breakdown by Panel Type (2023 and 2031)
Figure 64. Middle East and Africa: Interactive Display Market Breakdown, by Industry Vertical (2023 and 2031)
Figure 65. Middle East and Africa: Interactive Display Market Breakdown, by Key Countries, 2023 and 2031 (%)
Figure 66. South Africa: Interactive Display Market – Revenue and Forecast to 2031(US$ Million)
Figure 67. Saudi Arabia: Interactive Display Market – Revenue and Forecast to 2031(US$ Million)
Figure 68. United Arab Emirates: Interactive Display Market – Revenue and Forecast to 2031(US$ Million)
Figure 69. Rest of Middle East and Africa: Interactive Display Market – Revenue and Forecast to 2031(US$ Million)
Figure 70. South and Central America: Interactive Display Market – Revenue and Forecast to 2031(US$ Million)
Figure 71. South and Central America: Interactive Display Market Breakdown by Product (2023 and 2031)
Figure 72. South and Central America: Interactive Display Market Breakdown by Panel Size (2023 and 2031)
Figure 73. South and Central America: Interactive Display Market Breakdown by Panel Type (2023 and 2031)
Figure 74. South and Central America: Interactive Display Market Breakdown by Industry Vertical (2023 and 2031)
Figure 75. South and Central America: Interactive Display Market Breakdown, by Key Countries, 2023 and 2031 (%)
Figure 76. Brazil: Interactive Display Market – Revenue and Forecast to 2031(US$ Million)
Figure 77. Argentina: Interactive Display Market – Revenue and Forecast to 2031(US$ Million)
Figure 78. Rest of South and Central America: Interactive Display Market – Revenue and Forecast to 2031(US$ Million)
Figure 79. Company Positioning & Concentration
The List of Companies - Interactive Display Market
- Samsung Electronics Co Ltd
- PROMETHEAN LIMITED
- LG Electronics Inc
- BOE Technology Group Co Ltd
- Panasonic Holdings Corp
- Sharp Electronics Corp
- Hitachi Ltd
- BenQ Corporation
- SMART TECHNOLOGIES ULC
- ViewSonic Corporation
The Insight Partners performs research in 4 major stages: Data Collection & Secondary Research, Primary Research, Data Analysis and Data Triangulation & Final Review.
- Data Collection and Secondary Research:
As a market research and consulting firm operating from a decade, we have published many reports and advised several clients across the globe. First step for any study will start with an assessment of currently available data and insights from existing reports. Further, historical and current market information is collected from Investor Presentations, Annual Reports, SEC Filings, etc., and other information related to company’s performance and market positioning are gathered from Paid Databases (Factiva, Hoovers, and Reuters) and various other publications available in public domain.
Several associations trade associates, technical forums, institutes, societies and organizations are accessed to gain technical as well as market related insights through their publications such as research papers, blogs and press releases related to the studies are referred to get cues about the market. Further, white papers, journals, magazines, and other news articles published in the last 3 years are scrutinized and analyzed to understand the current market trends.
- Primary Research:
The primarily interview analysis comprise of data obtained from industry participants interview and answers to survey questions gathered by in-house primary team.
For primary research, interviews are conducted with industry experts/CEOs/Marketing Managers/Sales Managers/VPs/Subject Matter Experts from both demand and supply side to get a 360-degree view of the market. The primary team conducts several interviews based on the complexity of the markets to understand the various market trends and dynamics which makes research more credible and precise.
A typical research interview fulfils the following functions:
- Provides first-hand information on the market size, market trends, growth trends, competitive landscape, and outlook
- Validates and strengthens in-house secondary research findings
- Develops the analysis team’s expertise and market understanding
Primary research involves email interactions and telephone interviews for each market, category, segment, and sub-segment across geographies. The participants who typically take part in such a process include, but are not limited to:
- Industry participants: VPs, business development managers, market intelligence managers and national sales managers
- Outside experts: Valuation experts, research analysts and key opinion leaders specializing in the electronics and semiconductor industry.
Below is the breakup of our primary respondents by company, designation, and region:

Once we receive the confirmation from primary research sources or primary respondents, we finalize the base year market estimation and forecast the data as per the macroeconomic and microeconomic factors assessed during data collection.
- Data Analysis:
Once data is validated through both secondary as well as primary respondents, we finalize the market estimations by hypothesis formulation and factor analysis at regional and country level.
- 3.1 Macro-Economic Factor Analysis:
We analyse macroeconomic indicators such the gross domestic product (GDP), increase in the demand for goods and services across industries, technological advancement, regional economic growth, governmental policies, the influence of COVID-19, PEST analysis, and other aspects. This analysis aids in setting benchmarks for various nations/regions and approximating market splits. Additionally, the general trend of the aforementioned components aid in determining the market's development possibilities.
- 3.2 Country Level Data:
Various factors that are especially aligned to the country are taken into account to determine the market size for a certain area and country, including the presence of vendors, such as headquarters and offices, the country's GDP, demand patterns, and industry growth. To comprehend the market dynamics for the nation, a number of growth variables, inhibitors, application areas, and current market trends are researched. The aforementioned elements aid in determining the country's overall market's growth potential.
- 3.3 Company Profile:
The “Table of Contents” is formulated by listing and analyzing more than 25 - 30 companies operating in the market ecosystem across geographies. However, we profile only 10 companies as a standard practice in our syndicate reports. These 10 companies comprise leading, emerging, and regional players. Nonetheless, our analysis is not restricted to the 10 listed companies, we also analyze other companies present in the market to develop a holistic view and understand the prevailing trends. The “Company Profiles” section in the report covers key facts, business description, products & services, financial information, SWOT analysis, and key developments. The financial information presented is extracted from the annual reports and official documents of the publicly listed companies. Upon collecting the information for the sections of respective companies, we verify them via various primary sources and then compile the data in respective company profiles. The company level information helps us in deriving the base number as well as in forecasting the market size.
- 3.4 Developing Base Number:
Aggregation of sales statistics (2020-2022) and macro-economic factor, and other secondary and primary research insights are utilized to arrive at base number and related market shares for 2022. The data gaps are identified in this step and relevant market data is analyzed, collected from paid primary interviews or databases. On finalizing the base year market size, forecasts are developed on the basis of macro-economic, industry and market growth factors and company level analysis.
- Data Triangulation and Final Review:
The market findings and base year market size calculations are validated from supply as well as demand side. Demand side validations are based on macro-economic factor analysis and benchmarks for respective regions and countries. In case of supply side validations, revenues of major companies are estimated (in case not available) based on industry benchmark, approximate number of employees, product portfolio, and primary interviews revenues are gathered. Further revenue from target product/service segment is assessed to avoid overshooting of market statistics. In case of heavy deviations between supply and demand side values, all thes steps are repeated to achieve synchronization.
We follow an iterative model, wherein we share our research findings with Subject Matter Experts (SME’s) and Key Opinion Leaders (KOLs) until consensus view of the market is not formulated – this model negates any drastic deviation in the opinions of experts. Only validated and universally acceptable research findings are quoted in our reports.
We have important check points that we use to validate our research findings – which we call – data triangulation, where we validate the information, we generate from secondary sources with primary interviews and then we re-validate with our internal data bases and Subject matter experts. This comprehensive model enables us to deliver high quality, reliable data in shortest possible time.
 Get Free Sample For