The IoT Monetization market size is projected to reach US$ 2552.69 billion by 2031 from US$ 154.42 billion in 2023. The market is expected to register a CAGR of 42.0% during 2023–2031. Edge computing and integration with technologies such as AI and ML are likely to remain key trends in the market.
IoT Monetization Market Analysis
The evolution of the Internet of Things has resulted in the progress of technology that once appeared unfathomable. From connected homes, smart devices, and remote door locks to app-controlled devices, IoT products offer a pool of convenience that helps shape daily lives. Internet of Things devices in the consumer market typically pertain to products that enable smart homes, e.g., lighting fixtures, thermostats, home appliances, cameras, and home security systems. The new class of products can be controlled by other cloud-connected devices or a smartphone. The Internet of Things technology helps connect various smart devices to ease the operation and data sharing. There are different smart devices, such as sensors, smartphones, and wearables, which collect necessary data from devices, which are further utilized to enhance customer’s experience. The rising need for data analysis and integration of analytics is expected to drive the IoT monetization market during the forecast period.
IoT Monetization Market Overview
The rising adoption of IoT technology across end-user industries, such as manufacturing, automotive, and healthcare, drives the IoT monetization market growth. With the traditional manufacturing sector in a digital transformation, the IoT fuels intelligent connectivity's next industrial revolution. This is changing the way industries approach increasingly complex systems and machines to improve efficiency and reduce downtime. The Internet of Things is anticipated to make a massive transformation in various areas, such as replenishing goods. Devices such as connected refrigerators that can automatically place orders for milk, cheese, or any other product that is running low are being introduced by major electronics manufacturers—Samsung and LG. Additionally, e-commerce platforms are rapidly increasing due to the ease of shopping and growing smartphone penetration in the market. The growing need for data analysis and integration of analytics is anticipated to drive the utilization of IoT, subsequently expected to drive the IoT monetization market over the forecast period.
Customize Research To Suit Your Requirement
We can optimize and tailor the analysis and scope which is unmet through our standard offerings. This flexibility will help you gain the exact information needed for your business planning and decision making.
IoT Monetization Market: Strategic Insights
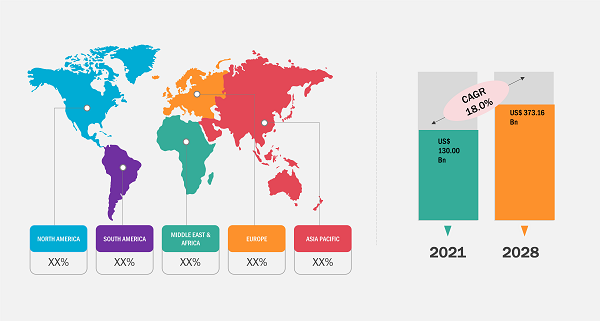
Market Size Value in US$ 76.58 Billion in 2021 Market Size Value by US$ 865.40 Billion by 2028 Growth rate CAGR of 42.0% from 2022 to 2028 Forecast Period 2022-2028 Base Year 2021

Naveen
Have a question?
Naveen will walk you through a 15-minute call to present the report’s content and answer all queries if you have any.
 Speak to Analyst
Customize Research To Suit Your Requirement
We can optimize and tailor the analysis and scope which is unmet through our standard offerings. This flexibility will help you gain the exact information needed for your business planning and decision making.
IoT Monetization Market: Strategic Insights
| Market Size Value in | US$ 76.58 Billion in 2021 |
| Market Size Value by | US$ 865.40 Billion by 2028 |
| Growth rate | CAGR of 42.0% from 2022 to 2028 |
| Forecast Period | 2022-2028 |
| Base Year | 2021 |
Naveen
Have a question?
Naveen will walk you through a 15-minute call to present the report’s content and answer all queries if you have any.
Speak to Analyst
IoT Monetization Market Drivers and Opportunities
Maximizing Business Potential with IoT Data to Favor Market
In the growing IoT world, monetization techniques are changing away from one-time hardware costs and toward more dynamic, recurring revenue models. This change is critical for firms looking to increase their influence across many industries and develop long-term trust with users through continual customer involvement. Companies that focus on IoT data monetization not only improve revenue predictability but also considerably increase overall value.
Enhancing IoT Monetization with Subscription and Usage Management
Subscription and Usage Management (SUM) solutions are critical tools for automating manual procedures in IoT monetization, resulting in faster uptake and more efficient pricing strategies for applications with high Monthly Recurring Revenue (MRR) potential. These platforms make it possible to effectively monetize a wide range of recurring business models, allowing for the long-term collection of income in exchange for IoT products or services. Pricing methods can include one-time fees, subscriptions, consumption-based outcomes, or a combination of the above, allowing for more flexible ways for IoT monetization.
IoT Monetization Market Report Segmentation Analysis
Key segments that contributed to the derivation of the IoT monetization market analysis are type and application.
- Based on deployment type, the IoT monetization market is divided into on-premise and cloud. The cloud segment held a larger market share in 2023.
- By application, the market is segmented into retail, education, aerospace and defense, automotive, healthcare, manufacturing, IT & telecom, and others.
IoT Monetization Market Share Analysis by Geography
The geographic scope of the IoT monetization market report is mainly divided into five regions: North America, Asia Pacific, Europe, Middle East & Africa, and South & Central America.
North America holds a prominent share in the market. In North America, the US is a key contributor to the IoT monetization market. Factors such as the presence of several IoT companies in the region and the fast adoption of new technology by the masses are driving the IoT monetization market in North America. Several IoT companies present in the US offer a variety of IoT devices for applications in automotive & transportation, industrial, retail, healthcare, consumer electronics, and other sectors.
IoT Monetization Market Report Scope
IoT Monetization Market News and Recent Developments
The IoT monetization market is evaluated by gathering qualitative and quantitative data post primary and secondary research, which includes important corporate publications, association data, and databases. A few of the developments in the IoT monetization market are listed below:
- SEALSQ Corp, a semiconductor, PKI, and Post-Quantum technology firm, announced the debut of SEALDATA, a new service designed to help clients monetize their Internet of Things (IoT) data. This service is designed to capitalize on the increasing value of IoT data by providing a platform for users to transform data from their devices into cash streams using SEALCOIN, a new cryptocurrency set to be issued by the end of the second quarter of 2024. (Source: SEALSQ Corp, Newsletter, 2024)
- Nokia has launched a new Software-as-a-Service (SaaS) solution to assist communication service providers (CSPs) and enterprises in commercializing new 5G and IoT use cases and offers. The solution works in situations with over 150 million subscribers and can be integrated with 5G Standalone core network functionalities in a multivendor environment. Nokia stated that the SaaS solution will help CSPs better monetize new consumer and enterprise solutions such as cloud gaming and logistics. (Source: Nokia, Newsletter, 2022)
IoT Monetization Market Report Coverage and Deliverables
The “IoT Monetization Market Size and Forecast (2021–2031)” report provides a detailed analysis of the market covering below areas:
- IoT monetization market size and forecast at global, regional, and country levels for all the key market segments covered under the scope
- IoT monetization market trends as well as market dynamics such as drivers, restraints, and key opportunities
- Detailed PEST/Porter’s Five Forces and SWOT analysis
- IoT monetization market analysis covering key market trends, global and regional framework, major players, regulations, and recent market developments
- Industry landscape and competition analysis covering market concentration, heat map analysis, prominent players, and recent developments for the IoT monetization market
- Detailed company profiles

Report Coverage
Revenue forecast, Company Analysis, Industry landscape, Growth factors, and Trends

Segment Covered
Deployment Type and Application

Regional Scope
North America, Europe, Asia Pacific, Middle East & Africa, South & Central America

Country Scope
US, UK, Canada, Germany, France, Italy, Australia, Russia, China, Japan, South Korea, Saudi Arabia, Brazil, Argentina
Frequently Asked Questions
The IoT monetization market is expected to register a CAGR of 42.0% during 2023–2031
The IoT monetization market size is projected to reach US$ 2552.69 billion by 2031
Edge computing and integration with technologies such as AI and ML are likely to remain key trends in the market.
Amdocs, Cisco Systems, Inc., Flexera, Thales, Intel Corporation, Microsoft Corporation, Netcracker, Inc., Samsung Electronics Co. Ltd., SAP SE, Telefonaktiebolaget LM Ericsonnare, PTC Inc, IBM, General Electric Co., Google Inc., Oracle Corporation, TOMIA, Synthesis Systems, Philips, John Deere, and Amazon.com are among the leading payers operating in the IoT monetization market.
Maximizing business potential with IoT data and increasing digital transformation are expected to drive the IoT monetization market.
North America dominated the IoT monetization market in 2023.
The Insight Partners performs research in 4 major stages: Data Collection & Secondary Research, Primary Research, Data Analysis and Data Triangulation & Final Review.
- Data Collection and Secondary Research:
As a market research and consulting firm operating from a decade, we have published many reports and advised several clients across the globe. First step for any study will start with an assessment of currently available data and insights from existing reports. Further, historical and current market information is collected from Investor Presentations, Annual Reports, SEC Filings, etc., and other information related to company’s performance and market positioning are gathered from Paid Databases (Factiva, Hoovers, and Reuters) and various other publications available in public domain.
Several associations trade associates, technical forums, institutes, societies and organizations are accessed to gain technical as well as market related insights through their publications such as research papers, blogs and press releases related to the studies are referred to get cues about the market. Further, white papers, journals, magazines, and other news articles published in the last 3 years are scrutinized and analyzed to understand the current market trends.
- Primary Research:
The primarily interview analysis comprise of data obtained from industry participants interview and answers to survey questions gathered by in-house primary team.
For primary research, interviews are conducted with industry experts/CEOs/Marketing Managers/Sales Managers/VPs/Subject Matter Experts from both demand and supply side to get a 360-degree view of the market. The primary team conducts several interviews based on the complexity of the markets to understand the various market trends and dynamics which makes research more credible and precise.
A typical research interview fulfils the following functions:
- Provides first-hand information on the market size, market trends, growth trends, competitive landscape, and outlook
- Validates and strengthens in-house secondary research findings
- Develops the analysis team’s expertise and market understanding
Primary research involves email interactions and telephone interviews for each market, category, segment, and sub-segment across geographies. The participants who typically take part in such a process include, but are not limited to:
- Industry participants: VPs, business development managers, market intelligence managers and national sales managers
- Outside experts: Valuation experts, research analysts and key opinion leaders specializing in the electronics and semiconductor industry.
Below is the breakup of our primary respondents by company, designation, and region:

Once we receive the confirmation from primary research sources or primary respondents, we finalize the base year market estimation and forecast the data as per the macroeconomic and microeconomic factors assessed during data collection.
- Data Analysis:
Once data is validated through both secondary as well as primary respondents, we finalize the market estimations by hypothesis formulation and factor analysis at regional and country level.
- 3.1 Macro-Economic Factor Analysis:
We analyse macroeconomic indicators such the gross domestic product (GDP), increase in the demand for goods and services across industries, technological advancement, regional economic growth, governmental policies, the influence of COVID-19, PEST analysis, and other aspects. This analysis aids in setting benchmarks for various nations/regions and approximating market splits. Additionally, the general trend of the aforementioned components aid in determining the market's development possibilities.
- 3.2 Country Level Data:
Various factors that are especially aligned to the country are taken into account to determine the market size for a certain area and country, including the presence of vendors, such as headquarters and offices, the country's GDP, demand patterns, and industry growth. To comprehend the market dynamics for the nation, a number of growth variables, inhibitors, application areas, and current market trends are researched. The aforementioned elements aid in determining the country's overall market's growth potential.
- 3.3 Company Profile:
The “Table of Contents” is formulated by listing and analyzing more than 25 - 30 companies operating in the market ecosystem across geographies. However, we profile only 10 companies as a standard practice in our syndicate reports. These 10 companies comprise leading, emerging, and regional players. Nonetheless, our analysis is not restricted to the 10 listed companies, we also analyze other companies present in the market to develop a holistic view and understand the prevailing trends. The “Company Profiles” section in the report covers key facts, business description, products & services, financial information, SWOT analysis, and key developments. The financial information presented is extracted from the annual reports and official documents of the publicly listed companies. Upon collecting the information for the sections of respective companies, we verify them via various primary sources and then compile the data in respective company profiles. The company level information helps us in deriving the base number as well as in forecasting the market size.
- 3.4 Developing Base Number:
Aggregation of sales statistics (2020-2022) and macro-economic factor, and other secondary and primary research insights are utilized to arrive at base number and related market shares for 2022. The data gaps are identified in this step and relevant market data is analyzed, collected from paid primary interviews or databases. On finalizing the base year market size, forecasts are developed on the basis of macro-economic, industry and market growth factors and company level analysis.
- Data Triangulation and Final Review:
The market findings and base year market size calculations are validated from supply as well as demand side. Demand side validations are based on macro-economic factor analysis and benchmarks for respective regions and countries. In case of supply side validations, revenues of major companies are estimated (in case not available) based on industry benchmark, approximate number of employees, product portfolio, and primary interviews revenues are gathered. Further revenue from target product/service segment is assessed to avoid overshooting of market statistics. In case of heavy deviations between supply and demand side values, all thes steps are repeated to achieve synchronization.
We follow an iterative model, wherein we share our research findings with Subject Matter Experts (SME’s) and Key Opinion Leaders (KOLs) until consensus view of the market is not formulated – this model negates any drastic deviation in the opinions of experts. Only validated and universally acceptable research findings are quoted in our reports.
We have important check points that we use to validate our research findings – which we call – data triangulation, where we validate the information, we generate from secondary sources with primary interviews and then we re-validate with our internal data bases and Subject matter experts. This comprehensive model enables us to deliver high quality, reliable data in shortest possible time.
 Get Free Sample For