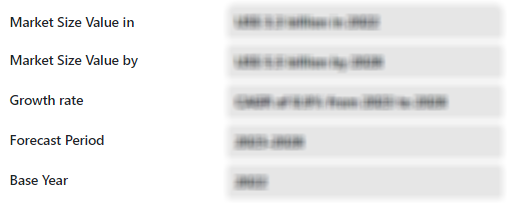
The Non-Alcoholic Beverage Packaging Market is expected to register a CAGR of 6% from 2025 to 2031, with a market size expanding from US$ XX million in 2024 to US$ XX Million by 2031.
The report is segmented by type (rigid packaging and flexible packaging) and application (carbonated drinks, juices, ready-to-drink tea, ready-to-drink coffee, functional drinks and others). The global analysis is further broken-down at regional level and major countries. The market size and forecast at global, regional, and country levels for all the key market segments are covered under the scope. The report offers the value in USD for the above analysis and segments. The report provides key statistics on the market status of the key market players and offers market trends and opportunities.
Purpose of the ReportThe report Non-Alcoholic Beverage Packaging Market by The Insight Partners aims to describe the present landscape and future growth, top driving factors, challenges, and opportunities. This will provide insights to various business stakeholders, such as:
- Technology Providers/Manufacturers: To understand the evolving market dynamics and know the potential growth opportunities, enabling them to make informed strategic decisions.
- Investors: To conduct a comprehensive trend analysis regarding the market growth rate, market financial projections, and opportunities that exist across the value chain.
- Regulatory bodies: To regulate policies and police activities in the market with the aim of minimizing abuse, preserving investor trust and confidence, and upholding the integrity and stability of the market.
Non-Alcoholic Beverage Packaging Market Segmentation
Type- Rigid Packaging and Flexible Packaging
- Carbonated Drinks
- Juices
- Ready-to-Drink Tea
- Ready-to-Drink Coffee
- Functional Drinks and Others
Strategic Insights
Non-Alcoholic Beverage Packaging Market Growth Drivers- Health Trends Boost Packaging Demand: In more recent years, there has been a growing appetite for healthier living, making consumers look for non-alcoholic drinks with less sugar and calorie content. The change is spurring the need for new product packaging technologies that demonstrate the advantages of the products, including but not limited to organic products or even key ingredients present within the products, such as vitamins and electrolytes. As brands catch up with consumers on this trend, they have emboldened effective communication of health aspects entrenched in the products, thus fueling the non-alcoholic beverages packaging industry.
- Convenience Packaging Drives Market Growth: The current consumer lifestyle comes with a desire for packaging solutions that address the on-the-go aspect of the product. Consumers want easy-to-use packaging; therefore, single-served and portable packaging formats are trending. Convenience-enhancing packaging features such as reclosable caps and lightweight materials contribute to the upsurge in the non-alcoholic beverage packaging market.
- Eco-Friendly Materials Shape Consumer Choices: There is also a significant influence on consumer attitudes and the inclusion of environmental aspects in purchasing products. Materials with low ecological footprints and environmental friendliness are well appreciated. More and more brands use recyclable, biodegradable, and compost materials for their packets. This positive change towards eco-friendly practices is in response to what the consumers want. It is also in line with the policies on plastic reduction, which is also an impulse for developing the non-alcoholic beverage packaging market.
- Smart Packaging Technologies Enhance Consumer Engagement: One of the striking characteristics of the non-alcoholic beverage industry presently is smart technology in packaging. QR codes, NFC, and augmented reality are new technologies embraced to interact with customers and give them more information about the product. Such technologies enable direct engagement between the brands and consumers by providing offers, nutritional details, and some elements that trigger purchase behavior.
- Sustainable Materials Drive Non-Alcoholic Beverage Packaging: New materials utilized in packaging development are lighter, stronger, and more environmentally friendly. For example, the introduction of bioplastics and lightweight glass has begun to find a footing in the market. Alternatively, many designers have pleased customers with new design ideas, including the appeal and function of shelf bottles like ergonomic-shaped bottles and easy-pour spouts. Fewer transportation costs and environmental degradation are never achieved without these improvements.
- Strategic Alliances Promote Eco-Friendly Packaging Solutions: Several companies engage in strategic alliances to leverage sustainability in the non-alcoholic beverage packaging segment. This includes beverage producers, packaging manufacturers, and even recyclers working to develop sustainable packaged beverages using recycled packaging components. Such measures are essential given the growing consumer appetite for sustainable practices and the need for businesses to enhance their image within a green society.
- Eco-Friendly Packaging for Non-Alcoholic Beverages: The lucrative potential for manufacturers to design and market clean, environmentally friendly packaged goods for the non-alcoholic beverage segment. Developing bio-based materials, bioplastics, and systems for returnable packaging will please the environment lovers. The companies that research and develop such solutions will help win over green consumers and ensure them a place on the market.
- Personalized Packaging to Boost Consumer Engagement: With the growing demand for personalization of consumer products, the non-alcoholic beverage packaging market stands to benefit. Brands can examine the packaging consumers customize on the beverage container and whether the labeling changes colors and patterns. Such a strategy increases captive engagement and encourages loyalty since customers gravitate toward products that best fit their tastes.
- Growth Potential in Developing Markets: Despite being a mature market, the non-alcoholic beverage packaging market has high growth potential in the developing countries in Asia-Pacific and Africa. The packaged beverages market is growing significantly. Companies that can tweak their packaging solutions to suit the local tastes and preferences of the consumers in these regions will enjoy this growth.
Market Report Scope
Key Selling Points
- Comprehensive Coverage: The report comprehensively covers the analysis of products, services, types, and end users of the Non-Alcoholic Beverage Packaging Market, providing a holistic landscape.
- Expert Analysis: The report is compiled based on the in-depth understanding of industry experts and analysts.
- Up-to-date Information: The report assures business relevance due to its coverage of recent information and data trends.
- Customization Options: This report can be customized to cater to specific client requirements and suit the business strategies aptly.
The research report on the Non-Alcoholic Beverage Packaging Market can, therefore, help spearhead the trail of decoding and understanding the industry scenario and growth prospects. Although there can be a few valid concerns, the overall benefits of this report tend to outweigh the disadvantages.
REGIONAL FRAMEWORK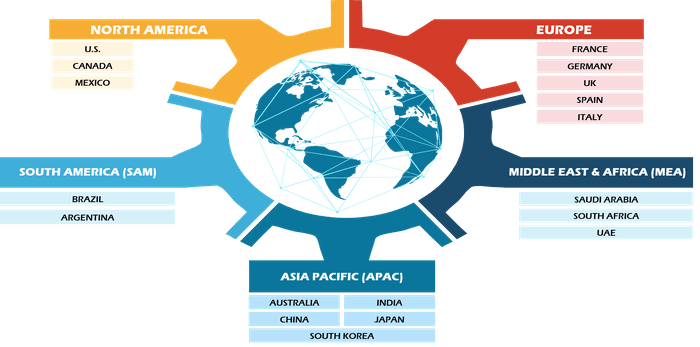
Have a question?

Shejal
Shejal will walk you through a 15-minute call to present the report’s content and answer all queries if you have any.
 Speak to Analyst
- Sample PDF showcases the content structure and the nature of the information with qualitative and quantitative analysis.
- Request discounts available for Start-Ups & Universities

- Sample PDF showcases the content structure and the nature of the information with qualitative and quantitative analysis.
- Request discounts available for Start-Ups & Universities

Report Coverage
Revenue forecast, Company Analysis, Industry landscape, Growth factors, and Trends

Segment Covered
This text is related
to segments covered.

Regional Scope
North America, Europe, Asia Pacific, Middle East & Africa, South & Central America

Country Scope
This text is related
to country scope.
Frequently Asked Questions
Smart packaging technologies is expected to be the key market trends
The report can be delivered in PDF/Word format, we can also share excel data sheet based on request.
On the basis of geography, the non-alcoholic beverage packaging market is classified into North America, Europe, Asia Pacific, Middle East and Africa, and South and Central America
Allied Glass; Amcor plc; AptarGroup Inc; BALL Corporation; CCL Industries are some of the key players operating in the non-alcoholic beverage packaging market
Rising health consciousness among consumers is driving the market growth
The Non-Alcoholic Beverage Packaging Market is estimated to witness a CAGR of 6% from 2023 to 2031
1. INTRODUCTION
1.1. SCOPE OF THE STUDY
1.2. THE INSIGHT PARTNERS RESEARCH REPORT GUIDANCE
1.3. MARKET SEGMENTATION
1.3.1 Non-alcoholic Beverage Packaging Market - By Type
1.3.2 Non-alcoholic Beverage Packaging Market - By Application
1.3.3 Non-alcoholic Beverage Packaging Market - By Region
1.3.3.1 By Country
2. KEY TAKEAWAYS
3. RESEARCH METHODOLOGY
4. NON-ALCOHOLIC BEVERAGE PACKAGING MARKET LANDSCAPE
4.1. OVERVIEW
4.2. PORTER'S FIVE FORCES ANALYSIS
4.2.1 Bargaining Power of Buyers
4.2.1 Bargaining Power of Suppliers
4.2.1 Threat of Substitute
4.2.1 Threat of New Entrants
4.2.1 Competitive Rivalry
4.3. EXPERT OPINIONS
5. NON-ALCOHOLIC BEVERAGE PACKAGING MARKET - KEY MARKET DYNAMICS
5.1. KEY MARKET DRIVERS
5.2. KEY MARKET RESTRAINTS
5.3. KEY MARKET OPPORTUNITIES
5.4. FUTURE TRENDS
5.5. IMPACT ANALYSIS OF DRIVERS AND RESTRAINTS
6. NON-ALCOHOLIC BEVERAGE PACKAGING MARKET - GLOBAL MARKET ANALYSIS
6.1. NON-ALCOHOLIC BEVERAGE PACKAGING - GLOBAL MARKET OVERVIEW
6.2. NON-ALCOHOLIC BEVERAGE PACKAGING - GLOBAL MARKET AND FORECAST TO 2028
6.3. MARKET POSITIONING
7. NON-ALCOHOLIC BEVERAGE PACKAGING MARKET - REVENUE AND FORECASTS TO 2028 - TYPE
7.1. OVERVIEW
7.2. TYPE MARKET FORECASTS AND ANALYSIS
7.3. RIGID PACKAGING
7.3.1. Overview
7.3.2. Rigid Packaging Market Forecast and Analysis
7.4. FLEXIBLE PACKAGING
7.4.1. Overview
7.4.2. Flexible Packaging Market Forecast and Analysis
8. NON-ALCOHOLIC BEVERAGE PACKAGING MARKET - REVENUE AND FORECASTS TO 2028 - APPLICATION
8.1. OVERVIEW
8.2. APPLICATION MARKET FORECASTS AND ANALYSIS
8.3. CARBONATED SOFT DRINKS
8.3.1. Overview
8.3.2. Carbonated Soft Drinks Market Forecast and Analysis
8.4. JUICES
8.4.1. Overview
8.4.2. Juices Market Forecast and Analysis
8.5. READY-TO-DRINK TEA AND COFFEE
8.5.1. Overview
8.5.2. Ready-to-Drink Tea and Coffee Market Forecast and Analysis
8.6. FUNCTIONAL DRINKS
8.6.1. Overview
8.6.2. Functional Drinks Market Forecast and Analysis
8.7. OTHERS
8.7.1. Overview
8.7.2. Others Market Forecast and Analysis
9. NON-ALCOHOLIC BEVERAGE PACKAGING MARKET REVENUE AND FORECASTS TO 2028 - GEOGRAPHICAL ANALYSIS
9.1. NORTH AMERICA
9.1.1 North America Non-alcoholic Beverage Packaging Market Overview
9.1.2 North America Non-alcoholic Beverage Packaging Market Forecasts and Analysis
9.1.3 North America Non-alcoholic Beverage Packaging Market Forecasts and Analysis - By Type
9.1.4 North America Non-alcoholic Beverage Packaging Market Forecasts and Analysis - By Application
9.1.5 North America Non-alcoholic Beverage Packaging Market Forecasts and Analysis - By Countries
9.1.5.1 United States Non-alcoholic Beverage Packaging Market
9.1.5.1.1 United States Non-alcoholic Beverage Packaging Market by Type
9.1.5.1.2 United States Non-alcoholic Beverage Packaging Market by Application
9.1.5.2 Canada Non-alcoholic Beverage Packaging Market
9.1.5.2.1 Canada Non-alcoholic Beverage Packaging Market by Type
9.1.5.2.2 Canada Non-alcoholic Beverage Packaging Market by Application
9.1.5.3 Mexico Non-alcoholic Beverage Packaging Market
9.1.5.3.1 Mexico Non-alcoholic Beverage Packaging Market by Type
9.1.5.3.2 Mexico Non-alcoholic Beverage Packaging Market by Application
9.2. EUROPE
9.2.1 Europe Non-alcoholic Beverage Packaging Market Overview
9.2.2 Europe Non-alcoholic Beverage Packaging Market Forecasts and Analysis
9.2.3 Europe Non-alcoholic Beverage Packaging Market Forecasts and Analysis - By Type
9.2.4 Europe Non-alcoholic Beverage Packaging Market Forecasts and Analysis - By Application
9.2.5 Europe Non-alcoholic Beverage Packaging Market Forecasts and Analysis - By Countries
9.2.5.1 Germany Non-alcoholic Beverage Packaging Market
9.2.5.1.1 Germany Non-alcoholic Beverage Packaging Market by Type
9.2.5.1.2 Germany Non-alcoholic Beverage Packaging Market by Application
9.2.5.2 France Non-alcoholic Beverage Packaging Market
9.2.5.2.1 France Non-alcoholic Beverage Packaging Market by Type
9.2.5.2.2 France Non-alcoholic Beverage Packaging Market by Application
9.2.5.3 Italy Non-alcoholic Beverage Packaging Market
9.2.5.3.1 Italy Non-alcoholic Beverage Packaging Market by Type
9.2.5.3.2 Italy Non-alcoholic Beverage Packaging Market by Application
9.2.5.4 United Kingdom Non-alcoholic Beverage Packaging Market
9.2.5.4.1 United Kingdom Non-alcoholic Beverage Packaging Market by Type
9.2.5.4.2 United Kingdom Non-alcoholic Beverage Packaging Market by Application
9.2.5.5 Russia Non-alcoholic Beverage Packaging Market
9.2.5.5.1 Russia Non-alcoholic Beverage Packaging Market by Type
9.2.5.5.2 Russia Non-alcoholic Beverage Packaging Market by Application
9.2.5.6 Rest of Europe Non-alcoholic Beverage Packaging Market
9.2.5.6.1 Rest of Europe Non-alcoholic Beverage Packaging Market by Type
9.2.5.6.2 Rest of Europe Non-alcoholic Beverage Packaging Market by Application
9.3. ASIA-PACIFIC
9.3.1 Asia-Pacific Non-alcoholic Beverage Packaging Market Overview
9.3.2 Asia-Pacific Non-alcoholic Beverage Packaging Market Forecasts and Analysis
9.3.3 Asia-Pacific Non-alcoholic Beverage Packaging Market Forecasts and Analysis - By Type
9.3.4 Asia-Pacific Non-alcoholic Beverage Packaging Market Forecasts and Analysis - By Application
9.3.5 Asia-Pacific Non-alcoholic Beverage Packaging Market Forecasts and Analysis - By Countries
9.3.5.1 Australia Non-alcoholic Beverage Packaging Market
9.3.5.1.1 Australia Non-alcoholic Beverage Packaging Market by Type
9.3.5.1.2 Australia Non-alcoholic Beverage Packaging Market by Application
9.3.5.2 China Non-alcoholic Beverage Packaging Market
9.3.5.2.1 China Non-alcoholic Beverage Packaging Market by Type
9.3.5.2.2 China Non-alcoholic Beverage Packaging Market by Application
9.3.5.3 India Non-alcoholic Beverage Packaging Market
9.3.5.3.1 India Non-alcoholic Beverage Packaging Market by Type
9.3.5.3.2 India Non-alcoholic Beverage Packaging Market by Application
9.3.5.4 Japan Non-alcoholic Beverage Packaging Market
9.3.5.4.1 Japan Non-alcoholic Beverage Packaging Market by Type
9.3.5.4.2 Japan Non-alcoholic Beverage Packaging Market by Application
9.3.5.5 South Korea Non-alcoholic Beverage Packaging Market
9.3.5.5.1 South Korea Non-alcoholic Beverage Packaging Market by Type
9.3.5.5.2 South Korea Non-alcoholic Beverage Packaging Market by Application
9.3.5.6 Rest of Asia-Pacific Non-alcoholic Beverage Packaging Market
9.3.5.6.1 Rest of Asia-Pacific Non-alcoholic Beverage Packaging Market by Type
9.3.5.6.2 Rest of Asia-Pacific Non-alcoholic Beverage Packaging Market by Application
9.4. MIDDLE EAST AND AFRICA
9.4.1 Middle East and Africa Non-alcoholic Beverage Packaging Market Overview
9.4.2 Middle East and Africa Non-alcoholic Beverage Packaging Market Forecasts and Analysis
9.4.3 Middle East and Africa Non-alcoholic Beverage Packaging Market Forecasts and Analysis - By Type
9.4.4 Middle East and Africa Non-alcoholic Beverage Packaging Market Forecasts and Analysis - By Application
9.4.5 Middle East and Africa Non-alcoholic Beverage Packaging Market Forecasts and Analysis - By Countries
9.4.5.1 South Africa Non-alcoholic Beverage Packaging Market
9.4.5.1.1 South Africa Non-alcoholic Beverage Packaging Market by Type
9.4.5.1.2 South Africa Non-alcoholic Beverage Packaging Market by Application
9.4.5.2 Saudi Arabia Non-alcoholic Beverage Packaging Market
9.4.5.2.1 Saudi Arabia Non-alcoholic Beverage Packaging Market by Type
9.4.5.2.2 Saudi Arabia Non-alcoholic Beverage Packaging Market by Application
9.4.5.3 U.A.E Non-alcoholic Beverage Packaging Market
9.4.5.3.1 U.A.E Non-alcoholic Beverage Packaging Market by Type
9.4.5.3.2 U.A.E Non-alcoholic Beverage Packaging Market by Application
9.4.5.4 Rest of Middle East and Africa Non-alcoholic Beverage Packaging Market
9.4.5.4.1 Rest of Middle East and Africa Non-alcoholic Beverage Packaging Market by Type
9.4.5.4.2 Rest of Middle East and Africa Non-alcoholic Beverage Packaging Market by Application
9.5. SOUTH AND CENTRAL AMERICA
9.5.1 South and Central America Non-alcoholic Beverage Packaging Market Overview
9.5.2 South and Central America Non-alcoholic Beverage Packaging Market Forecasts and Analysis
9.5.3 South and Central America Non-alcoholic Beverage Packaging Market Forecasts and Analysis - By Type
9.5.4 South and Central America Non-alcoholic Beverage Packaging Market Forecasts and Analysis - By Application
9.5.5 South and Central America Non-alcoholic Beverage Packaging Market Forecasts and Analysis - By Countries
9.5.5.1 Brazil Non-alcoholic Beverage Packaging Market
9.5.5.1.1 Brazil Non-alcoholic Beverage Packaging Market by Type
9.5.5.1.2 Brazil Non-alcoholic Beverage Packaging Market by Application
9.5.5.2 Argentina Non-alcoholic Beverage Packaging Market
9.5.5.2.1 Argentina Non-alcoholic Beverage Packaging Market by Type
9.5.5.2.2 Argentina Non-alcoholic Beverage Packaging Market by Application
9.5.5.3 Rest of South and Central America Non-alcoholic Beverage Packaging Market
9.5.5.3.1 Rest of South and Central America Non-alcoholic Beverage Packaging Market by Type
9.5.5.3.2 Rest of South and Central America Non-alcoholic Beverage Packaging Market by Application
10. INDUSTRY LANDSCAPE
10.1. MERGERS AND ACQUISITIONS
10.2. AGREEMENTS, COLLABORATIONS AND JOIN VENTURES
10.3. NEW PRODUCT LAUNCHES
10.4. EXPANSIONS AND OTHER STRATEGIC DEVELOPMENTS
11. NON-ALCOHOLIC BEVERAGE PACKAGING MARKET, KEY COMPANY PROFILES
11.1. ALLIED GLASS
11.1.1. Key Facts
11.1.2. Business Description
11.1.3. Products and Services
11.1.4. Financial Overview
11.1.5. SWOT Analysis
11.1.6. Key Developments
11.2. AMCOR PLC
11.2.1. Key Facts
11.2.2. Business Description
11.2.3. Products and Services
11.2.4. Financial Overview
11.2.5. SWOT Analysis
11.2.6. Key Developments
11.3. APTARGROUP, INC.
11.3.1. Key Facts
11.3.2. Business Description
11.3.3. Products and Services
11.3.4. Financial Overview
11.3.5. SWOT Analysis
11.3.6. Key Developments
11.4. BALL CORPORATION
11.4.1. Key Facts
11.4.2. Business Description
11.4.3. Products and Services
11.4.4. Financial Overview
11.4.5. SWOT Analysis
11.4.6. Key Developments
11.5. CCL INDUSTRIES
11.5.1. Key Facts
11.5.2. Business Description
11.5.3. Products and Services
11.5.4. Financial Overview
11.5.5. SWOT Analysis
11.5.6. Key Developments
11.6. CROWN HOLDINGS, INC.
11.6.1. Key Facts
11.6.2. Business Description
11.6.3. Products and Services
11.6.4. Financial Overview
11.6.5. SWOT Analysis
11.6.6. Key Developments
11.7. PACTIV EVERGREEN INC.
11.7.1. Key Facts
11.7.2. Business Description
11.7.3. Products and Services
11.7.4. Financial Overview
11.7.5. SWOT Analysis
11.7.6. Key Developments
11.8. GENPAK, LLC
11.8.1. Key Facts
11.8.2. Business Description
11.8.3. Products and Services
11.8.4. Financial Overview
11.8.5. SWOT Analysis
11.8.6. Key Developments
11.9. INTERNATIONAL PAPER
11.9.1. Key Facts
11.9.2. Business Description
11.9.3. Products and Services
11.9.4. Financial Overview
11.9.5. SWOT Analysis
11.9.6. Key Developments
11.10. PARKSONS PACKAGING LTD.
11.10.1. Key Facts
11.10.2. Business Description
11.10.3. Products and Services
11.10.4. Financial Overview
11.10.5. SWOT Analysis
11.10.6. Key Developments
12. APPENDIX
12.1. ABOUT THE INSIGHT PARTNERS
12.2. GLOSSARY OF TERMS
1.Allied Glass
2.Amcor plc
3.AptarGroup, Inc.
4.BALL CORPORATION
5.CCL Industries
6.Crown Holdings, Inc.
7.Pactiv Evergreen Inc.
8.Genpak, LLC
9.International Paper
10.Parksons Packaging Ltd.
The Insight Partners performs research in 4 major stages: Data Collection & Secondary Research, Primary Research, Data Analysis and Data Triangulation & Final Review.
- Data Collection and Secondary Research:
As a market research and consulting firm operating from a decade, we have published many reports and advised several clients across the globe. First step for any study will start with an assessment of currently available data and insights from existing reports. Further, historical and current market information is collected from Investor Presentations, Annual Reports, SEC Filings, etc., and other information related to company’s performance and market positioning are gathered from Paid Databases (Factiva, Hoovers, and Reuters) and various other publications available in public domain.
Several associations trade associates, technical forums, institutes, societies and organizations are accessed to gain technical as well as market related insights through their publications such as research papers, blogs and press releases related to the studies are referred to get cues about the market. Further, white papers, journals, magazines, and other news articles published in the last 3 years are scrutinized and analyzed to understand the current market trends.
- Primary Research:
The primarily interview analysis comprise of data obtained from industry participants interview and answers to survey questions gathered by in-house primary team.
For primary research, interviews are conducted with industry experts/CEOs/Marketing Managers/Sales Managers/VPs/Subject Matter Experts from both demand and supply side to get a 360-degree view of the market. The primary team conducts several interviews based on the complexity of the markets to understand the various market trends and dynamics which makes research more credible and precise.
A typical research interview fulfils the following functions:
- Provides first-hand information on the market size, market trends, growth trends, competitive landscape, and outlook
- Validates and strengthens in-house secondary research findings
- Develops the analysis team’s expertise and market understanding
Primary research involves email interactions and telephone interviews for each market, category, segment, and sub-segment across geographies. The participants who typically take part in such a process include, but are not limited to:
- Industry participants: VPs, business development managers, market intelligence managers and national sales managers
- Outside experts: Valuation experts, research analysts and key opinion leaders specializing in the electronics and semiconductor industry.
Below is the breakup of our primary respondents by company, designation, and region:

Once we receive the confirmation from primary research sources or primary respondents, we finalize the base year market estimation and forecast the data as per the macroeconomic and microeconomic factors assessed during data collection.
- Data Analysis:
Once data is validated through both secondary as well as primary respondents, we finalize the market estimations by hypothesis formulation and factor analysis at regional and country level.
- 3.1 Macro-Economic Factor Analysis:
We analyse macroeconomic indicators such the gross domestic product (GDP), increase in the demand for goods and services across industries, technological advancement, regional economic growth, governmental policies, the influence of COVID-19, PEST analysis, and other aspects. This analysis aids in setting benchmarks for various nations/regions and approximating market splits. Additionally, the general trend of the aforementioned components aid in determining the market's development possibilities.
- 3.2 Country Level Data:
Various factors that are especially aligned to the country are taken into account to determine the market size for a certain area and country, including the presence of vendors, such as headquarters and offices, the country's GDP, demand patterns, and industry growth. To comprehend the market dynamics for the nation, a number of growth variables, inhibitors, application areas, and current market trends are researched. The aforementioned elements aid in determining the country's overall market's growth potential.
- 3.3 Company Profile:
The “Table of Contents” is formulated by listing and analyzing more than 25 - 30 companies operating in the market ecosystem across geographies. However, we profile only 10 companies as a standard practice in our syndicate reports. These 10 companies comprise leading, emerging, and regional players. Nonetheless, our analysis is not restricted to the 10 listed companies, we also analyze other companies present in the market to develop a holistic view and understand the prevailing trends. The “Company Profiles” section in the report covers key facts, business description, products & services, financial information, SWOT analysis, and key developments. The financial information presented is extracted from the annual reports and official documents of the publicly listed companies. Upon collecting the information for the sections of respective companies, we verify them via various primary sources and then compile the data in respective company profiles. The company level information helps us in deriving the base number as well as in forecasting the market size.
- 3.4 Developing Base Number:
Aggregation of sales statistics (2020-2022) and macro-economic factor, and other secondary and primary research insights are utilized to arrive at base number and related market shares for 2022. The data gaps are identified in this step and relevant market data is analyzed, collected from paid primary interviews or databases. On finalizing the base year market size, forecasts are developed on the basis of macro-economic, industry and market growth factors and company level analysis.
- Data Triangulation and Final Review:
The market findings and base year market size calculations are validated from supply as well as demand side. Demand side validations are based on macro-economic factor analysis and benchmarks for respective regions and countries. In case of supply side validations, revenues of major companies are estimated (in case not available) based on industry benchmark, approximate number of employees, product portfolio, and primary interviews revenues are gathered. Further revenue from target product/service segment is assessed to avoid overshooting of market statistics. In case of heavy deviations between supply and demand side values, all thes steps are repeated to achieve synchronization.
We follow an iterative model, wherein we share our research findings with Subject Matter Experts (SME’s) and Key Opinion Leaders (KOLs) until consensus view of the market is not formulated – this model negates any drastic deviation in the opinions of experts. Only validated and universally acceptable research findings are quoted in our reports.
We have important check points that we use to validate our research findings – which we call – data triangulation, where we validate the information, we generate from secondary sources with primary interviews and then we re-validate with our internal data bases and Subject matter experts. This comprehensive model enables us to deliver high quality, reliable data in shortest possible time.
 Get Free Sample For