The North America direct reduced iron market size was valued at US$ 1,953.20 million in 2022 and is projected to reach US$ 3,063.91 million by 2028; it is expected to record a CAGR of 7.8% from 2022 to 2028.
Direct-reduced iron, also known as sponge iron, is the product of the direct reduction of iron ore in the solid state by carbon monoxide and hydrogen derived from natural gas or coal. Steel manufacturing from direct reduced iron is considered as a sustainable way of steel production. Rising awareness regarding the adverse effects of carbon emissions and favorable government initiatives on sustainable steel product development boost market growth. The market for direct reduced iron in North America is moderately consolidated due to the presence of a few regional and international players.
In 2021, the US held the largest revenue share of the North America direct reduced iron market, and Canada is expected to register the highest CAGR from 2022 to 2028. The direct reduced iron market is competitive in the US owing to the expansion of electric arc furnace-based steel production and surge in adoption of sponge iron in construction applications. Moreover, hydrogen-based direct reduction of iron ore is gaining popularity, since hydrogen is considered low carbon alternative and a potential substitute of coke for reducing oxygen. Besides, rising demand for direct reduced iron in steel-making applications has resulted in increased imports of porous iron products in the country.
Customize Research To Suit Your Requirement
We can optimize and tailor the analysis and scope which is unmet through our standard offerings. This flexibility will help you gain the exact information needed for your business planning and decision making.
North America Direct Reduced Iron (DRI) Market: Strategic Insights
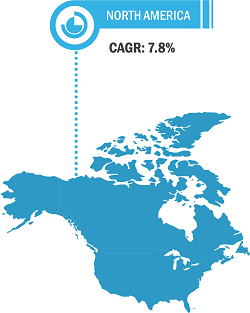
Market Size Value in US$ 1,953.20 million in 2022 Market Size Value by US$ 3,063.91 million by 2028 Growth rate CAGR of 7.8% from 2022 to 2028 Forecast Period 2022-2028 Base Year 2021

Shejal
Have a question?
Shejal will walk you through a 15-minute call to present the report’s content and answer all queries if you have any.
 Speak to Analyst
Customize Research To Suit Your Requirement
We can optimize and tailor the analysis and scope which is unmet through our standard offerings. This flexibility will help you gain the exact information needed for your business planning and decision making.
North America Direct Reduced Iron (DRI) Market: Strategic Insights
| Market Size Value in | US$ 1,953.20 million in 2022 |
| Market Size Value by | US$ 3,063.91 million by 2028 |
| Growth rate | CAGR of 7.8% from 2022 to 2028 |
| Forecast Period | 2022-2028 |
| Base Year | 2021 |
Shejal
Have a question?
Shejal will walk you through a 15-minute call to present the report’s content and answer all queries if you have any.
Speak to Analyst
Impact of COVID-19 Pandemic on North America Direct Reduced Iron Market
The COVID-19 pandemic has affected economies and industries in various countries due to lockdowns, travel bans, and business shutdowns. Lockdowns, travel restrictions, and business shutdowns in US and Canada hampered the growth of several industries, including steel and construction. The shutdown of manufacturing units disturbed global supply chains, manufacturing activities, delivery schedules, and various essential and nonessential product sales. Many companies announced possible delays in product deliveries and a slump in future sales of their products in 2020. Moreover, the shortage of manpower interrupted direct reduced iron production and distribution operations during the peak pandemic phase. The upheavals in the global supply chain and industrial material production facilities led to a severe spike in the prices of raw materials and production costs. All these factors hampered the steel making and construction industries in 2020 and early 2021, thereby restraining the growth of various markets related to this industry.
In 2021, various economies resumed operations as governments of several countries announced relaxation in the previously imposed restrictions, which positively impacted the global marketplace. Moreover, manufacturers were permitted to operate at full capacity, which helped them overcome the demand and supply gap. With successful vaccination drives across the world, the manufacturers of direct reduced iron are focusing on increasing their production for serving the rising consumer demand for sustainable steel products. This factor is positively impacting the North America direct reduced iron market growth.
North America Direct Reduced Iron Market Breakdown – by Region
- Sample PDF showcases the content structure and the nature of the information with qualitative and quantitative analysis.
- Request discounts available for Start-Ups & Universities
- Sample PDF showcases the content structure and the nature of the information with qualitative and quantitative analysis.
- Request discounts available for Start-Ups & Universities
Market Insights
Expansion of Direct Reduced Iron Plants in North America
North America has huge natural gas production facilities owing to the abundance of natural gas in the region. According to the US Energy Information Agency, the country contributes ~21–25% to global natural gas production. Natural gas has gained significant traction as a source of energy in recent times owing to its relatively clean combustion and fuel efficiency. It is a mixture of gaseous hydrocarbons mainly consisting of methane and other atmospheric gases in minor quantities. Natural gas is used as the principal raw material in the form of a reducing agent in the production of sponge iron. The major manufacturers of direct reduced iron in North America are expanding their production capacities due to the feasibility of accessing natural gas. In July 2021, ArcelorMittal, in collaboration with the Government of Canada, announced to set up a new direct reduced iron and electric arc furnace plant in the country. This facility will be capable of producing 2 million metric tons of iron, which would be used in the manufacturing of around 2.4 million metric tons of high-quality steel. Also, in June 2022, United Steel Corporation, one of the key manufacturers of steel through the electric arc furnace method, announced its plans to construct a new direct reduced iron pellets plant in Minnesota, US. Thus, strong demand for alternatives to scrap iron and the need for decarbonization of the steel industry have urged manufacturers in the region to expand their production capacity to serve the customer demand.
Application Insights
Based on application, the North America direct reduced iron market is segmented into steel making and construction. The steel making segment accounted for a larger market share in 2021. After pig iron or hot metal is produced in blast furnaces, direct reduced iron is the second most viable source of virgin iron in steel making. Natural gas-based shaft reactors for direct reduced iron production are commonly used in North America and South America, while coal-based direct reduced iron production is popular among Asian markets. According to Air Products and Chemicals, Inc., in North America, more than 60% of steel is produced through the electric arc furnace route using sponge iron as basic feed material for steel production. Rising demand for high-quality iron and steel products in steel making is anticipated to boost the market growth for the segment during the forecast period.
North America Direct Reduced Iron Market, by Application – 2021 and 2028
Nucor Corp, Cleveland-Cliffs Inc., Kobe Steel Ltd, Voestalpine AG, Ternium SA, SMS Group GmbH, JSW Steel Ltd, Tenova SpA, Liberty Steel Group Holdings UK Ltd, and Bharat Engineering Works Pvt Ltd. are a few major players operating in the North America direct reduced iron market. The North America direct reduced iron market players are constantly focusing on strategies such as investments in research and development activities and new product launches. These market players are highly focused on the development of high quality and innovative product offerings to fulfil the customer’s requirements.
Report Spotlights
- Progressive industry trends in the North America direct reduced iron market to help players develop effective long-term strategies
- Business growth strategies adopted by developed and developing markets
- Quantitative analysis of the North America direct reduced iron market from 2020 to 2028
- Estimation of demand for direct reduced iron in North America
- Recent developments to understand the competitive market scenario
- Market trend and outlook as well as factors driving and restraining the growth of the North America direct reduced iron market
- Assistance in decision-making process by highlighting market strategies that underpin commercial interest, leading to the market growth
- The size of the North America direct reduced iron market at various nodes
- Detailed overview and segmentation of the market, as well as the North America direct reduced iron industry dynamics
- Size of the North America direct reduced iron market in various countries with promising growth opportunities
North America Direct Reduced Iron Market Segmentation
By form, the North America direct reduced iron market is segmented into lumps, pellets and fine. Based on production process, the market is bifurcated into coal based and gas based. Based on application, the market is bifurcated into steel making and construction.
Company Profiles
- Nucor Corp
- Cleveland-Cliffs Inc
- Kobe Steel Ltd
- Voestalpine AG
- Ternium SA
- SMS Group GmbH
- JSW Steel Ltd
- Tenova SpA
- Liberty Steel Group Holdings UK Ltd
- Bharat Engineering Works Pvt Ltd.

Report Coverage
Revenue forecast, Company Analysis, Industry landscape, Growth factors, and Trends

Segment Covered
Form, Production Process, and Application

Regional Scope
North America, Europe, Asia Pacific, Middle East & Africa, South & Central America

Country Scope
Canada, United States
1. Introduction
1.1 Study Scope
1.2 The Insight Partners Research Report Guidance
1.3 Market Segmentation
2. Key Takeaways
3. Research Methodology
3.1 Scope of the Study
3.2 Research Methodology
3.2.1 Data Collection:
3.2.2 Primary Interviews:
3.2.3 Hypothesis Formulation:
3.2.4 Macro-economic Factor Analysis:
3.2.5 Developing Base Number:
3.2.6 Data Triangulation:
3.2.7 Country Level Data:
4. Direct Reduced Iron Market Landscape
4.1 Market Overview
4.2 Porter’s Five Forces Analysis
4.2.1 Threat of New Entrants:
4.2.2 Bargaining Power of Suppliers:
4.2.3 Bargaining Power of Buyers:
4.2.4 Competitive Rivalry:
4.2.5 Threat of Substitutes:
4.3 Production Capacity, by Country, 2021
4.4 Ecosystem Analysis
4.4.1 Overview:
4.4.2 Raw Material Suppliers:
4.4.3 Direct Reduced Iron Manufacturers
4.4.4 Distributors/Suppliers:
4.4.5 End-User
4.5 Expert Opinion
5. North America Direct Reduced Iron Market — Key Market Dynamics
5.1 Market Drivers
5.1.1 Rise in Steel Production and Use
5.1.2 Expansion of DRI Plants in North America
5.2 Market Restraints
5.2.1 Shortage of High-Quality Raw Materials
5.3 Market Opportunities
5.3.1 Rising Preference for Green Steel Production
5.4 Future Trends
5.4.1 Initiatives Taken by Various Government Bodies to Lower Carbon Footprint
5.5 Impact Analysis
6. Direct Reduced Iron – Regional Market Analysis
6.1 Direct Reduced Iron Market Overview
6.2 Competitive Positioning – Key Market Players
7. North America Direct Reduced Iron Market Analysis – By Form
7.1 Overview
7.2 North America Direct Reduced Iron Market Breakdown, by Form, 2021 & 2028
7.3 Lumps
7.3.1 Overview
7.3.2 Lumps: North America Direct Reduced Iron Market – Volume and Forecast to 2028 (Kilo Tons)
7.3.3 Lumps: North America Direct Reduced Iron Market – Revenue and Forecast to 2028 (US$ Million)
7.4 Pellets
7.4.1 Overview
7.4.2 Pellets: North America Direct Reduced Iron Market – Volume and Forecast to 2028 (Kilo Tons)
7.4.3 Pellets: North America Direct Reduced Iron Market – Revenue and Forecast to 2028 (US$ Million)
7.5 Fine
7.5.1 Overview
7.5.2 Fine: North America Direct Reduced Iron Market – Volume and Forecast to 2028 (Kilo Tons)
7.5.3 Fine: North America Direct Reduced Iron Market – Revenue and Forecast to 2028 (US$ Million)
8. North America Direct Reduced Iron Market Analysis – By Production Process
8.1 Overview
8.2 North America Direct Reduced Iron Market Breakdown, by Production Process, 2021 & 2028
8.3 Coal Based
8.3.1 Overview
8.3.2 Coal Based: North America Direct Reduced Iron Market – Revenue and Forecast to 2028 (US$ Million)
8.4 Gas Based
8.4.1 Overview
8.4.2 Gas Based: North America Direct Reduced Iron Market – Revenue and Forecast to 2028 (US$ Million)
9. North America Direct Reduced Iron Market Analysis – By Application
9.1 Overview
9.2 North America Direct Reduced Iron Market Breakdown, by Application, 2021 & 2028
9.3 Steel Making
9.3.1 Overview
9.3.2 Steel Making: North America Direct Reduced Iron Market – Revenue and Forecast to 2028 (US$ Million)
9.4 Construction
9.4.1 Overview
9.4.2 Construction: North America Direct Reduced Iron Market – Revenue and Forecast to 2028 (US$ Million)
10. Direct Reduced Iron Market – Geographic Analysis
10.1 North America: Direct Reduced Iron Market
10.1.1 North America: Direct Reduced Iron Market –Volume and Forecast to 2028 (Kilo Tons)
10.1.2 North America: Direct Reduced Iron Market –Revenue and Forecast to 2028 (US$ Million)
10.1.3 North America: Direct Reduced Iron Market, by Key Country
10.1.3.1 US: Direct Reduced Iron Market –Volume and Forecast to 2028 (Kilo Tons)
10.1.3.2 US: Direct Reduced Iron Market –Revenue and Forecast to 2028 (US$ Million)
10.1.3.2.1 US: Direct Reduced Iron Market, by Form
10.1.3.2.2 US: Direct Reduced Iron Market, by Form
10.1.3.2.3 US: Direct Reduced Iron Market, by Production Process
10.1.3.2.4 US: Direct Reduced Iron Market, by Application
10.1.3.3 Canada: Direct Reduced Iron Market–Volume and Forecast to 2028 (Kilo Tons)
10.1.3.4 Canada: Direct Reduced Iron Market–Revenue and Forecast to 2028 (US$ Million)
10.1.3.4.1 Canada: Direct Reduced Iron Market, by Form
10.1.3.4.2 Canada: Direct Reduced Iron Market, by Form
10.1.3.4.3 Canada: Direct Reduced Iron Market, by Production Process
10.1.3.4.4 Canada: Direct Reduced Iron Market, by Application
11. Impact of COVID-19 Pandemic on North America Direct Reduced Iron Market
11.1 Impact of COVID-19 on Direct Reduced Iron Market
11.2 North America: Impact Assessment of COVID-19 Pandemic
12. Industry Landscape
12.1 Overview
12.2 Merger and Acquisition
13. Company Profiles
13.1 Nucor Corp
13.1.1 Key Facts
13.1.2 Business Description
13.1.3 Products and Services
13.1.4 Financial Overview
13.1.5 SWOT Analysis
13.1.6 Key Developments
13.2 Cleveland-Cliffs Inc
13.2.1 Key Facts
13.2.2 Business Description
13.2.3 Products and Services
13.2.4 Financial Overview
13.2.5 SWOT Analysis
13.2.6 Key Developments
13.3 Kobe Steel Ltd
13.3.1 Key Facts
13.3.2 Business Description
13.3.3 Products and Services
13.3.4 Financial Overview
13.3.5 SWOT Analysis
13.3.6 Key Developments
13.4 SMS Group GmbH
13.4.1 Key Facts
13.4.2 Business Description
13.4.3 Products and Services
13.4.4 Financial Overview
13.4.5 SWOT Analysis
13.4.6 Key Developments
13.5 Voestalpine AG
13.5.1 Key Facts
13.5.2 Business Description
13.5.3 Products and Services
13.5.4 Financial Overview
13.5.5 SWOT Analysis
13.5.6 Key Developments
13.6 Ternium SA
13.6.1 Key Facts
13.6.2 Business Description
13.6.3 Products and Services
13.6.4 Financial Overview
13.6.5 SWOT Analysis
13.6.6 Key Developments
13.7 JSW Steel Ltd
13.7.1 Key Facts
13.7.2 Business Description
13.7.3 Products and Services
13.7.4 Financial Overview
13.7.5 SWOT Analysis
13.7.6 Key Developments
13.8 Tenova SpA
13.8.1 Key Facts
13.8.2 Business Description
13.8.3 Products and Services
13.8.4 Financial Overview
13.8.5 SWOT Analysis
13.8.6 Key Developments
13.9 Liberty Steel Group Holdings UK Ltd
13.9.1 Key Facts
13.9.2 Business Description
13.9.3 Products and Services
13.9.4 Financial Overview
13.9.5 SWOT Analysis
13.9.6 Key Developments
13.10 Bharat Engineering Works Pvt Ltd
13.10.1 Key Facts
13.10.2 Business Description
13.10.3 Products and Services
13.10.4 Financial Overview
13.10.5 SWOT Analysis
13.10.6 Key Developments
14. Appendix
14.1 About The Insight Partners
14.2 Word Index
LIST OF TABLES
Table 1. North America Direct Reduced Iron Market, by Form – Volume and Forecast to 2028 (Kilo Tons)
Table 2. North America Direct Reduced Iron Market, by Form – Revenue and Forecast to 2028 (US$ Million)
Table 3. North America Direct Reduced Iron Market, by Production Process – Revenue and Forecast to 2028 (US$ Million)
Table 4. North America Direct Reduced Iron Market, Application – Revenue and Forecast to 2028 (US$ Million)
Table 5. US Direct Reduced Iron Market, by Form – Volume and Forecast to 2028 (Kilo Tons)
Table 6. US Direct Reduced Iron Market, by Form – Revenue and Forecast to 2028 (US$ Million)
Table 7. US Direct Reduced Iron Market, by Production Process – Revenue and Forecast to 2028 (US$ Million)
Table 8. US Direct Reduced Iron Market, by Application – Revenue and Forecast to 2028 (US$ Million)
Table 9. Canada: Direct Reduced Iron Market, by Form – Volume and Forecast to 2028 (Kilo Tons)
Table 10. Canada: Direct Reduced Iron Market, by Form – Revenue and Forecast to 2028 (US$ Million)
Table 11. Canada: Direct Reduced Iron Market, by Production Process – Revenue and Forecast to 2028 (US$ Million)
Table 12. Canada Direct Reduced Iron Market, by Application – Revenue and Forecast to 2028 (US$ Million)
Table 13. List of Abbreviation
LIST OF FIGURES
Figure 1. Direct Reduced Iron Market Segmentation
Figure 2. Direct Reduced Iron Market Segmentation – By Geography
Figure 3. North America Direct Reduced Iron Market Overview
Figure 4. North America Direct Reduced Iron Market
Figure 5. Figure 4. North America Direct Reduced Iron Market, By Country
Figure 6. North America Direct Reduced Iron Market, Key Market Players
Figure 7. Porter’s Five Forces Analysis of Direct reduced Iron Market
Figure 8. North America Direct Reduced Iron Market, Ecosystem
Figure 9. Expert Opinion
Figure 10. North America Direct Reduced Iron Market Impact Analysis of Drivers and Restraints
Figure 11. Geographic Overview of Direct Reduced Iron Market
Figure 12. Key Players: Direct Reduced Iron Market
Figure 13. North America Direct Reduced Iron Market Breakdown, by Form, 2021 & 2028
Figure 14. Lumps: North America Direct Reduced Iron Market – Volume and Forecast To 2028 (Kilo Tons)
Figure 15. Lumps: North America Direct Reduced Iron Market – Revenue and Forecast to 2028 (US$ Million)
Figure 16. Pellets: North America Direct Reduced Iron Market – Volume and Forecast To 2028 (Kilo Tons)
Figure 17. Pellets: North America Direct Reduced Iron Market – Revenue and Forecast to 2028 (US$ Million)
Figure 18. Fine: North America Direct Reduced Iron Market – Volume and Forecast To 2028 (Kilo Tons)
Figure 19. Fine: North America Direct Reduced Iron Market – Revenue and Forecast to 2028 (US$ Million)
Figure 20. North America Direct Reduced Iron Market Breakdown, by Production Process, 2021 & 2028
Figure 21. Coal Based: North America Direct Reduced Iron Market – Revenue and Forecast to 2028 (US$ Million)
Figure 22. Gas Based: North America Direct Reduced Iron Market – Revenue and Forecast to 2028 (US$ Million)
Figure 23. North America Direct Reduced Iron Market Breakdown, by Application, 2021 & 2028
Figure 24. Steel Making: North America Direct Reduced Iron Market – Revenue and Forecast to 2028 (US$ Million)
Figure 25. Construction: North America Direct Reduced Iron Market – Revenue and Forecast to 2028 (US$ Million)
Figure 26. North America: Direct Reduced Iron Market –Volume and Forecast to 2028 (Kilo Tons)
Figure 27. North America: Direct Reduced Iron Market – Revenue and Forecast to 2028 (US$ Million)
Figure 28. North America: Direct Reduced Iron Market Revenue Share, by Key Country (2021 and 2028)
Figure 29. US: Direct Reduced Iron Market –Volume and Forecast to 2028 (Kilo Tons)
Figure 30. US: Direct Reduced Iron Market –Revenue and Forecast to 2028 (US$ Million)
Figure 31. Canada: Direct Reduced Iron Market–Volume and Forecast to 2028 (Kilo Tons)
Figure 32. Canada: Direct Reduced Iron Market–Revenue and Forecast to 2028 (US$ Million)
Figure 33. Impact of COVID-19 Pandemic on North America Direct Reduced Iron Market
The List of Companies - North America Direct Reduced Iron (DRI) Market
- Nucor Corp
- Cleveland-Cliffs Inc
- Kobe Steel Ltd
- Voestalpine AG
- Ternium SA
- SMS Group GmbH
- JSW Steel Ltd
- Tenova SpA
- Liberty Steel Group Holdings UK Ltd
- Bharat Engineering Works Pvt Ltd
The Insight Partners performs research in 4 major stages: Data Collection & Secondary Research, Primary Research, Data Analysis and Data Triangulation & Final Review.
- Data Collection and Secondary Research:
As a market research and consulting firm operating from a decade, we have published many reports and advised several clients across the globe. First step for any study will start with an assessment of currently available data and insights from existing reports. Further, historical and current market information is collected from Investor Presentations, Annual Reports, SEC Filings, etc., and other information related to company’s performance and market positioning are gathered from Paid Databases (Factiva, Hoovers, and Reuters) and various other publications available in public domain.
Several associations trade associates, technical forums, institutes, societies and organizations are accessed to gain technical as well as market related insights through their publications such as research papers, blogs and press releases related to the studies are referred to get cues about the market. Further, white papers, journals, magazines, and other news articles published in the last 3 years are scrutinized and analyzed to understand the current market trends.
- Primary Research:
The primarily interview analysis comprise of data obtained from industry participants interview and answers to survey questions gathered by in-house primary team.
For primary research, interviews are conducted with industry experts/CEOs/Marketing Managers/Sales Managers/VPs/Subject Matter Experts from both demand and supply side to get a 360-degree view of the market. The primary team conducts several interviews based on the complexity of the markets to understand the various market trends and dynamics which makes research more credible and precise.
A typical research interview fulfils the following functions:
- Provides first-hand information on the market size, market trends, growth trends, competitive landscape, and outlook
- Validates and strengthens in-house secondary research findings
- Develops the analysis team’s expertise and market understanding
Primary research involves email interactions and telephone interviews for each market, category, segment, and sub-segment across geographies. The participants who typically take part in such a process include, but are not limited to:
- Industry participants: VPs, business development managers, market intelligence managers and national sales managers
- Outside experts: Valuation experts, research analysts and key opinion leaders specializing in the electronics and semiconductor industry.
Below is the breakup of our primary respondents by company, designation, and region:

Once we receive the confirmation from primary research sources or primary respondents, we finalize the base year market estimation and forecast the data as per the macroeconomic and microeconomic factors assessed during data collection.
- Data Analysis:
Once data is validated through both secondary as well as primary respondents, we finalize the market estimations by hypothesis formulation and factor analysis at regional and country level.
- 3.1 Macro-Economic Factor Analysis:
We analyse macroeconomic indicators such the gross domestic product (GDP), increase in the demand for goods and services across industries, technological advancement, regional economic growth, governmental policies, the influence of COVID-19, PEST analysis, and other aspects. This analysis aids in setting benchmarks for various nations/regions and approximating market splits. Additionally, the general trend of the aforementioned components aid in determining the market's development possibilities.
- 3.2 Country Level Data:
Various factors that are especially aligned to the country are taken into account to determine the market size for a certain area and country, including the presence of vendors, such as headquarters and offices, the country's GDP, demand patterns, and industry growth. To comprehend the market dynamics for the nation, a number of growth variables, inhibitors, application areas, and current market trends are researched. The aforementioned elements aid in determining the country's overall market's growth potential.
- 3.3 Company Profile:
The “Table of Contents” is formulated by listing and analyzing more than 25 - 30 companies operating in the market ecosystem across geographies. However, we profile only 10 companies as a standard practice in our syndicate reports. These 10 companies comprise leading, emerging, and regional players. Nonetheless, our analysis is not restricted to the 10 listed companies, we also analyze other companies present in the market to develop a holistic view and understand the prevailing trends. The “Company Profiles” section in the report covers key facts, business description, products & services, financial information, SWOT analysis, and key developments. The financial information presented is extracted from the annual reports and official documents of the publicly listed companies. Upon collecting the information for the sections of respective companies, we verify them via various primary sources and then compile the data in respective company profiles. The company level information helps us in deriving the base number as well as in forecasting the market size.
- 3.4 Developing Base Number:
Aggregation of sales statistics (2020-2022) and macro-economic factor, and other secondary and primary research insights are utilized to arrive at base number and related market shares for 2022. The data gaps are identified in this step and relevant market data is analyzed, collected from paid primary interviews or databases. On finalizing the base year market size, forecasts are developed on the basis of macro-economic, industry and market growth factors and company level analysis.
- Data Triangulation and Final Review:
The market findings and base year market size calculations are validated from supply as well as demand side. Demand side validations are based on macro-economic factor analysis and benchmarks for respective regions and countries. In case of supply side validations, revenues of major companies are estimated (in case not available) based on industry benchmark, approximate number of employees, product portfolio, and primary interviews revenues are gathered. Further revenue from target product/service segment is assessed to avoid overshooting of market statistics. In case of heavy deviations between supply and demand side values, all thes steps are repeated to achieve synchronization.
We follow an iterative model, wherein we share our research findings with Subject Matter Experts (SME’s) and Key Opinion Leaders (KOLs) until consensus view of the market is not formulated – this model negates any drastic deviation in the opinions of experts. Only validated and universally acceptable research findings are quoted in our reports.
We have important check points that we use to validate our research findings – which we call – data triangulation, where we validate the information, we generate from secondary sources with primary interviews and then we re-validate with our internal data bases and Subject matter experts. This comprehensive model enables us to deliver high quality, reliable data in shortest possible time.
 Get Free Sample For