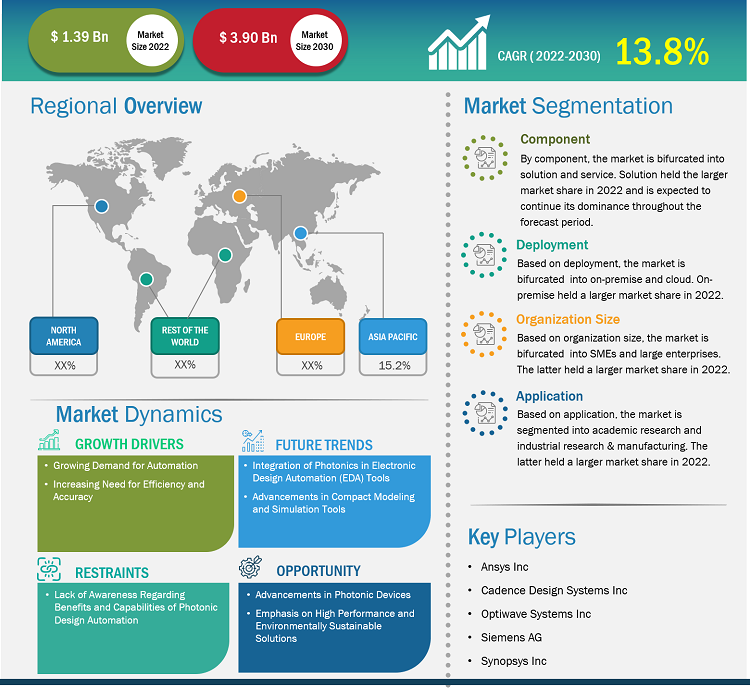
The photonic design automation market size is projected to reach US$ 3.90 billion by 2030 from US$ 1.39 billion in 2022. The market is expected to register a CAGR of 13.8% during 2022–2030. Integration of photonics in electronic design automation (EDA) tools is likely to remain a key trends in the market.
Photonic Design Automation Market Analysis
Collaboration between organizations for developing new innovative photonics design automation and increasing need for efficiency and accuracy are driving the market. The market is projected to expand at a significant pace during the forecast period, due to the growing demand for automation. Moreover, government investment in the development and expansion of semiconductor and photonics industries and emphasis on high-performance and environmentally sustainable solutions are creating lucrative opportunities for the market.
Photonic Design Automation Market Overview
Photonic design automation requires software tools and automation techniques that facilitate the designing and development of photonic devices and systems by successfully converting complex designs into functional chips or devices. Photonic design automation, like electrical design automation (EDA) in the electronics industry, seeks to expedite and simplify the design process for photonic components and systems. It provides designers with software tools and automated ways for creating schematics, layouts, and other design components. Photonic design automation aims to improve efficiency, accuracy, and productivity in the design and development of photonic devices and systems. Automating certain activities and delivering comprehensive simulation and analysis capabilities helps designers explore multiple design options, maximize performance, and minimize time-to-market. The market is expanding in response to the growing demand for automation in a variety of industries, including manufacturing. Automation is in high demand due to the benefits of using photonic design automation, such as increased productivity, simpler design processes, and faster time-to-market.
Customize Research To Suit Your Requirement
We can optimize and tailor the analysis and scope which is unmet through our standard offerings. This flexibility will help you gain the exact information needed for your business planning and decision making.
Photonic Design Automation Market: Strategic Insights
Market Size Value in US$ 1.39 billion in 2022 Market Size Value by US$ 3.90 billion by 2030 Growth rate CAGR of 13.8% from 2022 to 2030 Forecast Period 2022-2030 Base Year 2022

Naveen
Have a question?
Naveen will walk you through a 15-minute call to present the report’s content and answer all queries if you have any.
 Speak to Analyst
Customize Research To Suit Your Requirement
We can optimize and tailor the analysis and scope which is unmet through our standard offerings. This flexibility will help you gain the exact information needed for your business planning and decision making.
Photonic Design Automation Market: Strategic Insights
| Market Size Value in | US$ 1.39 billion in 2022 |
| Market Size Value by | US$ 3.90 billion by 2030 |
| Growth rate | CAGR of 13.8% from 2022 to 2030 |
| Forecast Period | 2022-2030 |
| Base Year | 2022 |
Naveen
Have a question?
Naveen will walk you through a 15-minute call to present the report’s content and answer all queries if you have any.
Speak to Analyst
Photonic Design Automation Market Drivers and Opportunities
Collaboration Between Organizations for Developing New Innovative Photonics Design Automation to Favor Market
The government, industry, and academia collaborate in developing photonics design automation through organizations such as the American Institute for Manufacturing Photonics (AIM Photonics). AIM Photonics aims to advance the photonics industry by fostering partnerships and innovation in electronic photonic design automation (EPDA). For instance, in May 2023, AIM Photonics unveiled its latest offering: Opto-electronic Testing Services. This new service suite provides a comprehensive range of cutting-edge tools and capabilities for testing both photonic integrated circuits (PICs) and conventional electronic integrated circuits (ICs). The Opto-electronic Testing Services by AIM Photonics cater to the growing demand for advanced testing solutions in the field of integrated circuits. These services enable the thorough evaluation and validation of the performance, reliability, and functionality of both photonic and electronic ICs.
The growth of the photonics design automation market can be attributed to the evolution of the electronic design automation (EDA) industry. EDA tools were initially focused on the design and verification of electronic integrated circuits (ICs) but have expanded to include photonics design capabilities.
Government Investment in the Development and Expansion of Semiconductor and Photonics Industries
The photonics design automation market is a dynamic sector that supports the development of photonic technologies. The Canadian government has supported initiatives such as the development of a global photonics design automation industry and the provision of leading products in the field. For instance, in February 2022, the Canadian government announced a substantial investment of US$ 240 million for the semiconductor and photonics industries. This strategic move aims to bolster the growth and competitiveness of these sectors, positioning Canada as a global leader in enhanced manufacturing and technology innovation. The investment will support the development of cutting-edge technologies, research and development initiatives, and the expansion of manufacturing capabilities in semiconductor and photonics industries across the country. It will foster collaboration between industry, academia, and government, driving innovation and creating new job opportunities.
Photonic Report Segmentation Analysis
Key segments that contributed to the derivation of the photonic analysis are component, deployment, organization size, and application.
- Based on component, the photonic design automation market is divided into solution and service. The solution segment held a larger market share in 2022.
- By deployment, the market is bifurcated into on-premise and cloud. The on-premise segment held a larger market share in 2022.
- In terms of organization size, the market is divided into SMEs and large enterprises. The large enterprises segment held a larger market share in 2022.
- On the basis of application, the photonic design automation market is segmented into academic research and industrial research & manufacturing. The industrial research & manufacturing segment held a larger market share in 2022.
Photonic Design Automation Market Share Analysis by Geography
The geographic scope of the photonic design automation market report is mainly divided into five regions: North America, Asia Pacific, Europe, Middle East & Africa, and South & Central America.
The market in Asia Pacific is projected to expand during the forecast period, due to the presence of photonics industries in China, South Korea, Japan, and India. South Korea has a strong presence in the photonics industry and is known for its technological advancements in information and communication technology. This has contributed to the growth of the photonics design automation market in the country. Technological advancements, collaborations, and investments in research and development drive the market in South Korea. Implementing automation in the manufacturing sector also plays a role in driving the market. Photonics design automation is crucial for various applications in South Korea, including telecommunications, data centers, healthcare, and sensing. It enables efficient manipulation of guided electromagnetic waves and contributes to the development of advanced photonic devices.
Photonic Design Automation Market Report Scope
Photonic Design Automation Market News and Recent Developments
The photonic design automation market is evaluated by gathering qualitative and quantitative data post primary and secondary research, which includes important corporate publications, association data, and databases. A few of the developments in the photonic design automation market are listed below:
- Luceda Photonics announced a collaboration with Aluvia Photonics, the world's first Al2O3 foundry for integrated photonics applications. This collaboration offers designers an advanced Process Design Kit (PDK) within the Luceda Photonics Design Platform, enabling access to the upcoming Multi-Project Wafer (MPW) runs at Aluvia Photonics. (Source: Luceda Photonics, Company Website, August 2023).
- AIM Photonics announced the launch of its new Opto-electronic Testing Services, which feature a full suite of advanced tools for testing both photonic integrated circuits (PICs) as well as conventional electronic ICs. (Source: AIM Photonics Inc, Company Website, May 2023).
Photonic Design Automation Market Report Coverage and Deliverables
The “Photonic Design Automation Market Size and Forecast (2020–2030)” report provides a detailed analysis of the market covering below areas:
- Photonic design automation market size and forecast at global, regional, and country levels for all the key market segments covered under the scope
- Photonic design automation market trends as well as market dynamics such as drivers, restraints, and key opportunities
- Detailed PEST/Porter’s Five Forces and SWOT analysis
- Photonic design automation market analysis covering key market trends, global and regional framework, major players, regulations, and recent market developments
- Industry landscape and competition analysis covering market concentration, heat map analysis, prominent players, and recent developments for the photonic design automation market
- Detailed company profiles

Report Coverage
Revenue forecast, Company Analysis, Industry landscape, Growth factors, and Trends

Segment Covered
Component, Deployment, Organization Size, and Application

Regional Scope
North America, Europe, Asia Pacific, Middle East & Africa, South & Central America

Country Scope
This text is related
to country scope.
Frequently Asked Questions
The global photonic design automation market is estimated to register a CAGR of 13.8% during the forecast period 2022–2030.
North America dominated the photonic design automation market in 2022.
Collaboration between organizations for developing new innovative photonics design automation and increasing need for efficiency and accuracy are the major factors that propel the global photonic design automation market.
The global photonic design automation market is expected to reach US$ 3.90 billion by 2030.
Integration of photonics in electronic design automation (EDA) tools to play a significant role in the global photonic design automation market in the coming years.
The key players holding majority shares in the global photonic design automation market are Ansys Inc, LioniX International BV, VPlphotonics GmbH, Optiwave Systems Inc, Luceda Photonics, Cadence Design Systems Inc, Siemens AG, Synopsys Inc, AIM Photonics Inc, and SystemLab Inc.
1. Introduction
1.1 The Insight Partners Research Report Guidance
1.2 Market Segmentation
2. Executive Summary
2.1 Key Insights
2.2 Market Attractiveness
3. Research Methodology
3.1 Coverage
3.2 Secondary Research
3.3 Primary Research
4. Photonic Design Automation Market Landscape
4.1 Overview
4.2 PEST Analysis
4.3 Ecosystem Analysis
4.3.1 List of Vendors in the Value Chain:
5. Photonic Design Automation Market - Key Market Dynamics
5.1 Photonic Design Automation Market - Key Market Dynamics
5.2 Market Drivers
5.2.1 Growing Demand for Automation
5.2.2 Increasing Need for Efficiency and Accuracy
5.3 Market Restraints
5.3.1 Lack of Awareness Regarding Benefits and Capabilities of Photonic Design Automation
5.4 Market Opportunities
5.4.1 Advancements in Photonic Devices
5.4.2 Emphasis on High Performance and Environmentally Sustainable Solutions
5.5 Future Trends
5.5.1 Integration of Photonics in Electronic Design Automation (EDA) Tools
5.5.2 Advancements in Compact Modelling and Simulation Tools
5.6 Impact of Drivers and Restraints:
6. Photonic Design Automation Market - Global Market Analysis
6.1 Photonic Design Automation Market Revenue (US$ Million), 2022 – 2030
6.2 Photonic Design Automation Market Forecast and Analysis
7. Photonic Design Automation Market Analysis - Component
7.1 Solution
7.1.1 Overview
7.1.2 Solution Market, Revenue and Forecast to 2030 (US$ Million)
7.2 Service
7.2.1 Overview
7.2.2 Service Market, Revenue and Forecast to 2030 (US$ Million)
8. Photonic Design Automation Market Analysis - Deployment
8.1 On-Premise
8.1.1 Overview
8.1.2 On-Premise Market, Revenue and Forecast to 2030 (US$ Million)
8.2 Cloud
8.2.1 Overview
8.2.2 Cloud Market, Revenue and Forecast to 2030 (US$ Million)
9. Photonic Design Automation Market Analysis - Organization Size
9.1 SMEs
9.1.1 Overview
9.1.2 SMEs Market, Revenue and Forecast to 2030 (US$ Million)
9.2 Large Enterprises
9.2.1 Overview
9.2.2 Large Enterprises Market, Revenue and Forecast to 2030 (US$ Million)
10. Photonic Design Automation Market Analysis - Application
10.1 Academic Research
10.1.1 Overview
10.1.2 Academic Research Market, Revenue and Forecast to 2030 (US$ Million)
10.2 Industrial Research & Manufacturing
10.2.1 Overview
10.2.2 Industrial Research & Manufacturing Market, Revenue and Forecast to 2030 (US$ Million)
11. Photonic Design Automation Market - Geographical Analysis
11.1 Overview
11.2 North America
11.2.1 North America Photonic Design Automation Market Overview
11.2.2 North America Photonic Design Automation Market Revenue and Forecasts to 2030 (US$ Mn)
11.2.3 North America Photonic Design Automation Market Breakdown by Component
11.2.3.1 North America Photonic Design Automation Market Revenue and Forecasts and Analysis - By Component
11.2.4 North America Photonic Design Automation Market Breakdown by Deployment
11.2.4.1 North America Photonic Design Automation Market Revenue and Forecasts and Analysis - By Deployment
11.2.5 North America Photonic Design Automation Market Breakdown by Organization Size
11.2.5.1 North America Photonic Design Automation Market Revenue and Forecasts and Analysis - By Organization Size
11.2.6 North America Photonic Design Automation Market Breakdown by Application
11.2.6.1 North America Photonic Design Automation Market Revenue and Forecasts and Analysis - By Application
11.2.7 North America Photonic Design Automation Market Revenue and Forecasts and Analysis - By Country
11.2.7.1 North America Photonic Design Automation Market Revenue and Forecasts and Analysis - By Country
11.2.7.2 US Photonic Design Automation Market Revenue and Forecasts to 2030 (US$ Mn)
11.2.7.2.1 US Photonic Design Automation Market Breakdown, by Component
11.2.7.2.2 US Photonic Design Automation Market Breakdown, by Deployment
11.2.7.2.3 US Photonic Design Automation Market Breakdown, by Organization Size
11.2.7.2.4 US Photonic Design Automation Market Breakdown, by Application
11.2.7.3 Canada Photonic Design Automation Market Revenue and Forecasts to 2030 (US$ Mn)
11.2.7.3.1 Canada Photonic Design Automation Market Breakdown, by Component
11.2.7.3.2 Canada Photonic Design Automation Market Breakdown, by Deployment
11.2.7.3.3 Canada Photonic Design Automation Market Breakdown, by Organization Size
11.2.7.3.4 Canada Photonic Design Automation Market Breakdown, by Application
11.3 Europe
11.3.1 Europe Photonic Design Automation Market Overview
11.3.2 Europe Photonic Design Automation Market Revenue and Forecasts to 2030 (US$ Mn)
11.3.3 Europe Photonic Design Automation Market Breakdown by Component
11.3.3.1 Europe Photonic Design Automation Market Revenue and Forecasts and Analysis - By Component
11.3.4 Europe Photonic Design Automation Market Breakdown by Deployment
11.3.4.1 Europe Photonic Design Automation Market Revenue and Forecasts and Analysis - By Deployment
11.3.5 Europe Photonic Design Automation Market Breakdown by Organization Size
11.3.5.1 Europe Photonic Design Automation Market Revenue and Forecasts and Analysis - By Organization Size
11.3.6 Europe Photonic Design Automation Market Breakdown by Application
11.3.6.1 Europe Photonic Design Automation Market Revenue and Forecasts and Analysis - By Application
11.3.7 Europe Photonic Design Automation Market Revenue and Forecasts and Analysis - By Country
11.3.7.1 Europe Photonic Design Automation Market Revenue and Forecasts and Analysis - By Country
11.3.7.2 Germany Photonic Design Automation Market Revenue and Forecasts to 2030 (US$ Mn)
11.3.7.2.1 Germany Photonic Design Automation Market Breakdown, by Component
11.3.7.2.2 Germany Photonic Design Automation Market Breakdown, by Deployment
11.3.7.2.3 Germany Photonic Design Automation Market Breakdown, by Organization Size
11.3.7.2.4 Germany Photonic Design Automation Market Breakdown, by Application
11.3.7.3 France Photonic Design Automation Market Revenue and Forecasts to 2030 (US$ Mn)
11.3.7.3.1 France Photonic Design Automation Market Breakdown, by Component
11.3.7.3.2 France Photonic Design Automation Market Breakdown, by Deployment
11.3.7.3.3 France Photonic Design Automation Market Breakdown, by Organization Size
11.3.7.3.4 France Photonic Design Automation Market Breakdown, by Application
11.3.7.4 UK Photonic Design Automation Market Revenue and Forecasts to 2030 (US$ Mn)
11.3.7.4.1 UK Photonic Design Automation Market Breakdown, by Component
11.3.7.4.2 UK Photonic Design Automation Market Breakdown, by Deployment
11.3.7.4.3 UK Photonic Design Automation Market Breakdown, by Organization Size
11.3.7.4.4 UK Photonic Design Automation Market Breakdown, by Application
11.3.7.5 Russia Photonic Design Automation Market Revenue and Forecasts to 2030 (US$ Mn)
11.3.7.5.1 Russia Photonic Design Automation Market Breakdown, by Component
11.3.7.5.2 Russia Photonic Design Automation Market Breakdown, by Deployment
11.3.7.5.3 Russia Photonic Design Automation Market Breakdown, by Organization Size
11.3.7.5.4 Russia Photonic Design Automation Market Breakdown, by Application
11.3.7.6 Switzerland Photonic Design Automation Market Revenue and Forecasts to 2030 (US$ Mn)
11.3.7.6.1 Switzerland Photonic Design Automation Market Breakdown, by Component
11.3.7.6.2 Switzerland Photonic Design Automation Market Breakdown, by Deployment
11.3.7.6.3 Switzerland Photonic Design Automation Market Breakdown, by Organization Size
11.3.7.6.4 Switzerland Photonic Design Automation Market Breakdown, by Application
11.3.7.7 Rest of Europe Photonic Design Automation Market Revenue and Forecasts to 2030 (US$ Mn)
11.3.7.7.1 Rest of Europe Photonic Design Automation Market Breakdown, by Component
11.3.7.7.2 Rest of Europe Photonic Design Automation Market Breakdown, by Deployment
11.3.7.7.3 Rest of Europe Photonic Design Automation Market Breakdown, by Organization Size
11.3.7.7.4 Rest of Europe Photonic Design Automation Market Breakdown, by Application
11.4 APAC
11.4.1 APAC Photonic Design Automation Market Overview
11.4.2 APAC Photonic Design Automation Market Revenue and Forecasts to 2030 (US$ Mn)
11.4.3 APAC Photonic Design Automation Market Breakdown by Component
11.4.3.1 APAC Photonic Design Automation Market Revenue and Forecasts and Analysis - By Component
11.4.4 APAC Photonic Design Automation Market Breakdown by Deployment
11.4.4.1 APAC Photonic Design Automation Market Revenue and Forecasts and Analysis - By Deployment
11.4.5 APAC Photonic Design Automation Market Breakdown by Organization Size
11.4.5.1 APAC Photonic Design Automation Market Revenue and Forecasts and Analysis - By Organization Size
11.4.6 APAC Photonic Design Automation Market Breakdown by Application
11.4.6.1 APAC Photonic Design Automation Market Revenue and Forecasts and Analysis - By Application
11.4.7 APAC Photonic Design Automation Market Revenue and Forecasts and Analysis - By Country
11.4.7.1 APAC Photonic Design Automation Market Revenue and Forecasts and Analysis - By Country
11.4.7.2 China Photonic Design Automation Market Revenue and Forecasts to 2030 (US$ Mn)
11.4.7.2.1 China Photonic Design Automation Market Breakdown, by Component
11.4.7.2.2 China Photonic Design Automation Market Breakdown, by Deployment
11.4.7.2.3 China Photonic Design Automation Market Breakdown, by Organization Size
11.4.7.2.4 China Photonic Design Automation Market Breakdown, by Application
11.4.7.3 Japan Photonic Design Automation Market Revenue and Forecasts to 2030 (US$ Mn)
11.4.7.3.1 Japan Photonic Design Automation Market Breakdown, by Component
11.4.7.3.2 Japan Photonic Design Automation Market Breakdown, by Deployment
11.4.7.3.3 Japan Photonic Design Automation Market Breakdown, by Organization Size
11.4.7.3.4 Japan Photonic Design Automation Market Breakdown, by Application
11.4.7.4 South Korea Photonic Design Automation Market Revenue and Forecasts to 2030 (US$ Mn)
11.4.7.4.1 South Korea Photonic Design Automation Market Breakdown, by Component
11.4.7.4.2 South Korea Photonic Design Automation Market Breakdown, by Deployment
11.4.7.4.3 South Korea Photonic Design Automation Market Breakdown, by Organization Size
11.4.7.4.4 South Korea Photonic Design Automation Market Breakdown, by Application
11.4.7.5 Taiwan Photonic Design Automation Market Revenue and Forecasts to 2030 (US$ Mn)
11.4.7.5.1 Taiwan Photonic Design Automation Market Breakdown, by Component
11.4.7.5.2 Taiwan Photonic Design Automation Market Breakdown, by Deployment
11.4.7.5.3 Taiwan Photonic Design Automation Market Breakdown, by Organization Size
11.4.7.5.4 Taiwan Photonic Design Automation Market Breakdown, by Application
11.4.7.6 Rest of APAC Photonic Design Automation Market Revenue and Forecasts to 2030 (US$ Mn)
11.4.7.6.1 Rest of APAC Photonic Design Automation Market Breakdown, by Component
11.4.7.6.2 Rest of APAC Photonic Design Automation Market Breakdown, by Deployment
11.4.7.6.3 Rest of APAC Photonic Design Automation Market Breakdown, by Organization Size
11.4.7.6.4 Rest of APAC Photonic Design Automation Market Breakdown, by Application
11.5 Rest of the World (RoW)
11.5.1 RoW Photonic Design Automation Market Overview
11.5.2 RoW Photonic Design Automation Market Revenue and Forecasts to 2030 (US$ Mn)
11.5.3 RoW Photonic Design Automation Market Breakdown by Component
11.5.3.1 RoW Photonic Design Automation Market Revenue and Forecasts and Analysis - By Component
11.5.4 RoW Photonic Design Automation Market Breakdown by Deployment
11.5.4.1 RoW Photonic Design Automation Market Revenue and Forecasts and Analysis - By Deployment
11.5.5 RoW Photonic Design Automation Market Breakdown by Organization Size
11.5.5.1 RoW Photonic Design Automation Market Revenue and Forecasts and Analysis - By Organization Size
11.5.6 RoW Photonic Design Automation Market Breakdown by Application
11.5.6.1 RoW Photonic Design Automation Market Revenue and Forecasts and Analysis - By Application
11.5.7 RoW Photonic Design Automation Market Revenue and Forecasts and Analysis - By Region
11.5.7.1 RoW Photonic Design Automation Market Revenue and Forecasts and Analysis - By Region
11.5.7.2 MEA Photonic Design Automation Market Revenue and Forecasts to 2030 (US$ Mn)
11.5.7.2.1 MEA Photonic Design Automation Market Breakdown, by Component
11.5.7.2.2 MEA Photonic Design Automation Market Breakdown, by Deployment
11.5.7.2.3 MEA Photonic Design Automation Market Breakdown, by Organization Size
11.5.7.2.4 MEA Photonic Design Automation Market Breakdown, by Application
11.5.7.3 SAM Photonic Design Automation Market Revenue and Forecasts to 2030 (US$ Mn)
11.5.7.3.1 SAM Photonic Design Automation Market Breakdown, by Component
11.5.7.3.2 SAM Photonic Design Automation Market Breakdown, by Deployment
11.5.7.3.3 SAM Photonic Design Automation Market Breakdown, by Organization Size
11.5.7.3.4 SAM Photonic Design Automation Market Breakdown, by Application
12. Photonic Design Automation Market – Impact of COVID-19 Pandemic
12.1 Pre & Post Covid-19 Impact
13. Competitive Landscape
13.1 Heat Map Analysis By Key Players
13.2 Company Positioning & Concentration
14. Industry Landscape
14.1 Overview
14.2 Market Initiative
14.2 New Product Development
14.3 Merger and Acquisition
15. Company Profiles
15.1 Ansys Inc
15.1.1 Key Facts
15.1.2 Business Description
15.1.3 Products and Services
15.1.4 Financial Overview
15.1.5 SWOT Analysis
15.1.6 Key Developments
15.2 LioniX International BV
15.2.1 Key Facts
15.2.2 Business Description
15.2.3 Products and Services
15.2.4 Financial Overview
15.2.5 SWOT Analysis
15.2.6 Key Developments
15.3 VPlphotonics GmbH
15.3.1 Key Facts
15.3.2 Business Description
15.3.3 Products and Services
15.3.4 Financial Overview
15.3.5 SWOT Analysis
15.3.6 Key Developments
15.4 Optiwave Systems Inc
15.4.1 Key Facts
15.4.2 Business Description
15.4.3 Products and Services
15.4.4 Financial Overview
15.4.5 SWOT Analysis
15.4.6 Key Developments
15.5 Luceda Photonics
15.5.1 Key Facts
15.5.2 Business Description
15.5.3 Products and Services
15.5.4 Financial Overview
15.5.5 SWOT Analysis
15.5.6 Key Developments
15.6 Cadence Design Systems Inc
15.6.1 Key Facts
15.6.2 Business Description
15.6.3 Products and Services
15.6.4 Financial Overview
15.6.5 SWOT Analysis
15.6.6 Key Developments
15.7 Siemens AG
15.7.1 Key Facts
15.7.2 Business Description
15.7.3 Products and Services
15.7.4 Financial Overview
15.7.5 SWOT Analysis
15.7.6 Key Developments
15.8 Synopsys Inc
15.8.1 Key Facts
15.8.2 Business Description
15.8.3 Products and Services
15.8.4 Financial Overview
15.8.5 SWOT Analysis
15.8.6 Key Developments
15.9 AIM Photonics Inc
15.9.1 Key Facts
15.9.2 Business Description
15.9.3 Products and Services
15.9.4 Financial Overview
15.9.5 SWOT Analysis
15.9.6 Key Developments
15.10 SystemLab Inc
15.10.1 Key Facts
15.10.2 Business Description
15.10.3 Products and Services
15.10.4 Financial Overview
15.10.5 SWOT Analysis
15.10.6 Key Developments
16. Appendix
16.1 Word Index
List of Tables
Table 1. Photonic Design Automation Market Segmentation
Table 2. Photonic Design Automation Market Revenue and Forecasts To 2030 (US$ Million)
Table 3. Photonic Design Automation Market Revenue and Forecasts To 2030 (US$ Million) – Component
Table 4. Photonic Design Automation Market Revenue and Forecasts To 2030 (US$ Million) – Deployment
Table 5. Photonic Design Automation Market Revenue and Forecasts To 2030 (US$ Million) – Organization Size
Table 6. Photonic Design Automation Market Revenue and Forecasts To 2030 (US$ Million) – Application
Table 7. North America Photonic Design Automation Market Revenue and Forecasts To 2030 (US$ Mn) – By Component
Table 8. North America Photonic Design Automation Market Revenue and Forecasts To 2030 (US$ Mn) – By Deployment
Table 9. North America Photonic Design Automation Market Revenue and Forecasts To 2030 (US$ Mn) – By Organization Size
Table 10. North America Photonic Design Automation Market Revenue and Forecasts To 2030 (US$ Mn) – By Application
Table 11. North America Photonic Design Automation Market Revenue and Forecasts To 2030 (US$ Mn) – By Country
Table 12. US Photonic Design Automation Market Revenue and Forecasts To 2030 (US$ Mn) – By Component
Table 13. US Photonic Design Automation Market Revenue and Forecasts To 2030 (US$ Mn) – By Deployment
Table 14. US Photonic Design Automation Market Revenue and Forecasts To 2030 (US$ Mn) – By Organization Size
Table 15. US Photonic Design Automation Market Revenue and Forecasts To 2030 (US$ Mn) – By Application
Table 16. Canada Photonic Design Automation Market Revenue and Forecasts To 2030 (US$ Mn) – By Component
Table 17. Canada Photonic Design Automation Market Revenue and Forecasts To 2030 (US$ Mn) – By Deployment
Table 18. Canada Photonic Design Automation Market Revenue and Forecasts To 2030 (US$ Mn) – By Organization Size
Table 19. Canada Photonic Design Automation Market Revenue and Forecasts To 2030 (US$ Mn) – By Application
Table 20. Europe Photonic Design Automation Market Revenue and Forecasts To 2030 (US$ Mn) – By Component
Table 21. Europe Photonic Design Automation Market Revenue and Forecasts To 2030 (US$ Mn) – By Deployment
Table 22. Europe Photonic Design Automation Market Revenue and Forecasts To 2030 (US$ Mn) – By Organization Size
Table 23. Europe Photonic Design Automation Market Revenue and Forecasts To 2030 (US$ Mn) – By Application
Table 24. Europe Photonic Design Automation Market Revenue and Forecasts To 2030 (US$ Mn) – By Country
Table 25. Germany Photonic Design Automation Market Revenue and Forecasts To 2030 (US$ Mn) – By Component
Table 26. Germany Photonic Design Automation Market Revenue and Forecasts To 2030 (US$ Mn) – By Deployment
Table 27. Germany Photonic Design Automation Market Revenue and Forecasts To 2030 (US$ Mn) – By Organization Size
Table 28. Germany Photonic Design Automation Market Revenue and Forecasts To 2030 (US$ Mn) – By Application
Table 29. France Photonic Design Automation Market Revenue and Forecasts To 2030 (US$ Mn) – By Component
Table 30. France Photonic Design Automation Market Revenue and Forecasts To 2030 (US$ Mn) – By Deployment
Table 31. France Photonic Design Automation Market Revenue and Forecasts To 2030 (US$ Mn) – By Organization Size
Table 32. France Photonic Design Automation Market Revenue and Forecasts To 2030 (US$ Mn) – By Application
Table 33. UK Photonic Design Automation Market Revenue and Forecasts To 2030 (US$ Mn) – By Component
Table 34. UK Photonic Design Automation Market Revenue and Forecasts To 2030 (US$ Mn) – By Deployment
Table 35. UK Photonic Design Automation Market Revenue and Forecasts To 2030 (US$ Mn) – By Organization Size
Table 36. UK Photonic Design Automation Market Revenue and Forecasts To 2030 (US$ Mn) – By Application
Table 37. Russia Photonic Design Automation Market Revenue and Forecasts To 2030 (US$ Mn) – By Component
Table 38. Russia Photonic Design Automation Market Revenue and Forecasts To 2030 (US$ Mn) – By Deployment
Table 39. Russia Photonic Design Automation Market Revenue and Forecasts To 2030 (US$ Mn) – By Organization Size
Table 40. Russia Photonic Design Automation Market Revenue and Forecasts To 2030 (US$ Mn) – By Application
Table 41. Switzerland Photonic Design Automation Market Revenue and Forecasts To 2030 (US$ Mn) – By Component
Table 42. Switzerland Photonic Design Automation Market Revenue and Forecasts To 2030 (US$ Mn) – By Deployment
Table 43. Switzerland Photonic Design Automation Market Revenue and Forecasts To 2030 (US$ Mn) – By Organization Size
Table 44. Switzerland Photonic Design Automation Market Revenue and Forecasts To 2030 (US$ Mn) – By Application
Table 45. Rest of Europe Photonic Design Automation Market Revenue and Forecasts To 2030 (US$ Mn) – By Component
Table 46. Rest of Europe Photonic Design Automation Market Revenue and Forecasts To 2030 (US$ Mn) – By Deployment
Table 47. Rest of Europe Photonic Design Automation Market Revenue and Forecasts To 2030 (US$ Mn) – By Organization Size
Table 48. Rest of Europe Photonic Design Automation Market Revenue and Forecasts To 2030 (US$ Mn) – By Application
Table 49. APAC Photonic Design Automation Market Revenue and Forecasts To 2030 (US$ Mn) – By Component
Table 50. APAC Photonic Design Automation Market Revenue and Forecasts To 2030 (US$ Mn) – By Deployment
Table 51. APAC Photonic Design Automation Market Revenue and Forecasts To 2030 (US$ Mn) – By Organization Size
Table 52. APAC Photonic Design Automation Market Revenue and Forecasts To 2030 (US$ Mn) – By Application
Table 53. APAC Photonic Design Automation Market Revenue and Forecasts To 2030 (US$ Mn) – By Country
Table 54. China Photonic Design Automation Market Revenue and Forecasts To 2030 (US$ Mn) – By Component
Table 55. China Photonic Design Automation Market Revenue and Forecasts To 2030 (US$ Mn) – By Deployment
Table 56. China Photonic Design Automation Market Revenue and Forecasts To 2030 (US$ Mn) – By Organization Size
Table 57. China Photonic Design Automation Market Revenue and Forecasts To 2030 (US$ Mn) – By Application
Table 58. Japan Photonic Design Automation Market Revenue and Forecasts To 2030 (US$ Mn) – By Component
Table 59. Japan Photonic Design Automation Market Revenue and Forecasts To 2030 (US$ Mn) – By Deployment
Table 60. Japan Photonic Design Automation Market Revenue and Forecasts To 2030 (US$ Mn) – By Organization Size
Table 61. Japan Photonic Design Automation Market Revenue and Forecasts To 2030 (US$ Mn) – By Application
Table 62. South Korea Photonic Design Automation Market Revenue and Forecasts To 2030 (US$ Mn) – By Component
Table 63. South Korea Photonic Design Automation Market Revenue and Forecasts To 2030 (US$ Mn) – By Deployment
Table 64. South Korea Photonic Design Automation Market Revenue and Forecasts To 2030 (US$ Mn) – By Organization Size
Table 65. South Korea Photonic Design Automation Market Revenue and Forecasts To 2030 (US$ Mn) – By Application
Table 66. Taiwan Photonic Design Automation Market Revenue and Forecasts To 2030 (US$ Mn) – By Component
Table 67. Taiwan Photonic Design Automation Market Revenue and Forecasts To 2030 (US$ Mn) – By Deployment
Table 68. Taiwan Photonic Design Automation Market Revenue and Forecasts To 2030 (US$ Mn) – By Organization Size
Table 69. Taiwan Photonic Design Automation Market Revenue and Forecasts To 2030 (US$ Mn) – By Application
Table 70. Rest of APAC Photonic Design Automation Market Revenue and Forecasts To 2030 (US$ Mn) – By Component
Table 71. Rest of APAC Photonic Design Automation Market Revenue and Forecasts To 2030 (US$ Mn) – By Deployment
Table 72. Rest of APAC Photonic Design Automation Market Revenue and Forecasts To 2030 (US$ Mn) – By Organization Size
Table 73. Rest of APAC Photonic Design Automation Market Revenue and Forecasts To 2030 (US$ Mn) – By Application
Table 74. RoW Photonic Design Automation Market Revenue and Forecasts To 2030 (US$ Mn) – By Component
Table 75. RoW Photonic Design Automation Market Revenue and Forecasts To 2030 (US$ Mn) – By Deployment
Table 76. RoW Photonic Design Automation Market Revenue and Forecasts To 2030 (US$ Mn) – By Organization Size
Table 77. RoW Photonic Design Automation Market Revenue and Forecasts To 2030 (US$ Mn) – By Application
Table 78. RoW Photonic Design Automation Market Revenue and Forecasts To 2030 (US$ Mn) – By Region
Table 79. MEA Photonic Design Automation Market Revenue and Forecasts To 2030 (US$ Mn) – By Component
Table 80. MEA Photonic Design Automation Market Revenue and Forecasts To 2030 (US$ Mn) – By Deployment
Table 81. MEA Photonic Design Automation Market Revenue and Forecasts To 2030 (US$ Mn) – By Organization Size
Table 82. MEA Photonic Design Automation Market Revenue and Forecasts To 2030 (US$ Mn) – By Application
Table 83. SAM Photonic Design Automation Market Revenue and Forecasts To 2030 (US$ Mn) – By Component
Table 84. SAM Photonic Design Automation Market Revenue and Forecasts To 2030 (US$ Mn) – By Deployment
Table 85. SAM Photonic Design Automation Market Revenue and Forecasts To 2030 (US$ Mn) – By Organization Size
Table 86. SAM Photonic Design Automation Market Revenue and Forecasts To 2030 (US$ Mn) – By Application
Table 87. Heat Map Analysis By Key Players
Table 88. List of Abbreviation
List of Figures
Figure 1. Photonic Design Automation Market Segmentation, By Geography
Figure 2. PEST Analysis
Figure 3. Ecosystem: Photonic Design Automation Market
Figure 4. Impact Analysis of Drivers and Restraints
Figure 5. Photonic Design Automation Market Breakdown by Geography, 2022 and 2030 (%)
Figure 6. Photonic Design Automation Market Revenue (US$ Million), 2022 – 2030
Figure 7. Photonic Design Automation Market Share (%) – Component, 2022 and 2030
Figure 8. Solution Market Revenue and Forecasts To 2030 (US$ Million)
Figure 9. Service Market Revenue and Forecasts To 2030 (US$ Million)
Figure 10. Photonic Design Automation Market Share (%) – Deployment, 2022 and 2030
Figure 11. On-Premise Market Revenue and Forecasts To 2030 (US$ Million)
Figure 12. Cloud Market Revenue and Forecasts To 2030 (US$ Million)
Figure 13. Photonic Design Automation Market Share (%) – Organization Size, 2022 and 2030
Figure 14. SMEs Market Revenue and Forecasts To 2030 (US$ Million)
Figure 15. Large Enterprises Market Revenue and Forecasts To 2030 (US$ Million)
Figure 16. Photonic Design Automation Market Share (%) – Application, 2022 and 2030
Figure 17. Academic Research Market Revenue and Forecasts To 2030 (US$ Million)
Figure 18. Industrial Research & Manufacturing Market Revenue and Forecasts To 2030 (US$ Million)
Figure 19. Photonic Design Automation Market Breakdown by Region, 2022 and 2030 (%)
Figure 20. North America Photonic Design Automation Market Revenue and Forecasts To 2030 (US$ Mn)
Figure 21. North America Photonic Design Automation Market Breakdown by Component (2022 and 2030)
Figure 22. North America Photonic Design Automation Market Breakdown by Deployment (2022 and 2030)
Figure 23. North America Photonic Design Automation Market Breakdown by Organization Size (2022 and 2030)
Figure 24. North America Photonic Design Automation Market Breakdown by Application (2022 and 2030)
Figure 25. North America Photonic Design Automation Market Breakdown by Key Countries, 2022 and 2030 (%)
Figure 26. US Photonic Design Automation Market Revenue and Forecasts To 2030 (US$ Mn)
Figure 27. Canada Photonic Design Automation Market Revenue and Forecasts To 2030 (US$ Mn)
Figure 28. Europe Photonic Design Automation Market Revenue and Forecasts To 2030 (US$ Mn)
Figure 29. Europe Photonic Design Automation Market Breakdown by Component (2022 and 2030)
Figure 30. Europe Photonic Design Automation Market Breakdown by Deployment (2022 and 2030)
Figure 31. Europe Photonic Design Automation Market Breakdown by Organization Size (2022 and 2030)
Figure 32. Europe Photonic Design Automation Market Breakdown by Application (2022 and 2030)
Figure 33. Europe Photonic Design Automation Market Breakdown by Key Countries, 2022 and 2030 (%)
Figure 34. Germany Photonic Design Automation Market Revenue and Forecasts To 2030 (US$ Mn)
Figure 35. France Photonic Design Automation Market Revenue and Forecasts To 2030 (US$ Mn)
Figure 36. UK Photonic Design Automation Market Revenue and Forecasts To 2030 (US$ Mn)
Figure 37. Russia Photonic Design Automation Market Revenue and Forecasts To 2030 (US$ Mn)
Figure 38. Switzerland Photonic Design Automation Market Revenue and Forecasts To 2030 (US$ Mn)
Figure 39. Rest of Europe Photonic Design Automation Market Revenue and Forecasts To 2030 (US$ Mn)
Figure 40. APAC Photonic Design Automation Market Revenue and Forecasts To 2030 (US$ Mn)
Figure 41. APAC Photonic Design Automation Market Breakdown by Component (2022 and 2030)
Figure 42. APAC Photonic Design Automation Market Breakdown by Deployment (2022 and 2030)
Figure 43. APAC Photonic Design Automation Market Breakdown by Organization Size (2022 and 2030)
Figure 44. APAC Photonic Design Automation Market Breakdown by Application (2022 and 2030)
Figure 45. APAC Photonic Design Automation Market Breakdown by Key Countries, 2022 and 2030 (%)
Figure 46. China Photonic Design Automation Market Revenue and Forecasts To 2030 (US$ Mn)
Figure 47. Japan Photonic Design Automation Market Revenue and Forecasts To 2030 (US$ Mn)
Figure 48. South Korea Photonic Design Automation Market Revenue and Forecasts To 2030 (US$ Mn)
Figure 49. Taiwan Photonic Design Automation Market Revenue and Forecasts To 2030 (US$ Mn)
Figure 50. Rest of APAC Photonic Design Automation Market Revenue and Forecasts To 2030 (US$ Mn)
Figure 51. RoW Photonic Design Automation Market Revenue and Forecasts To 2030 (US$ Mn)
Figure 52. RoW Photonic Design Automation Market Breakdown by Component (2022 and 2030)
Figure 53. RoW Photonic Design Automation Market Breakdown by Deployment (2022 and 2030)
Figure 54. RoW Photonic Design Automation Market Breakdown by Organization Size (2022 and 2030)
Figure 55. RoW Photonic Design Automation Market Breakdown by Application (2022 and 2030)
Figure 56. RoW Photonic Design Automation Market Breakdown by Key Regions, 2022 and 2030 (%)
Figure 57. MEA Photonic Design Automation Market Revenue and Forecasts To 2030 (US$ Mn)
Figure 58. SAM Photonic Design Automation Market Revenue and Forecasts To 2030 (US$ Mn)
Figure 59. Company Positioning & Concentration
The List of Companies - Photonic Design Automation Market
- AIM Photonics
- Ansys Inc
- Cadence Design Systems Inc
- LioniX International BV
- Luceda Photonics
- Optiwave Systems Inc
- Siemens AG
- Synopsys Inc
- SystemLab Inc
- VPIphotonics GmbH
The Insight Partners performs research in 4 major stages: Data Collection & Secondary Research, Primary Research, Data Analysis and Data Triangulation & Final Review.
- Data Collection and Secondary Research:
As a market research and consulting firm operating from a decade, we have published many reports and advised several clients across the globe. First step for any study will start with an assessment of currently available data and insights from existing reports. Further, historical and current market information is collected from Investor Presentations, Annual Reports, SEC Filings, etc., and other information related to company’s performance and market positioning are gathered from Paid Databases (Factiva, Hoovers, and Reuters) and various other publications available in public domain.
Several associations trade associates, technical forums, institutes, societies and organizations are accessed to gain technical as well as market related insights through their publications such as research papers, blogs and press releases related to the studies are referred to get cues about the market. Further, white papers, journals, magazines, and other news articles published in the last 3 years are scrutinized and analyzed to understand the current market trends.
- Primary Research:
The primarily interview analysis comprise of data obtained from industry participants interview and answers to survey questions gathered by in-house primary team.
For primary research, interviews are conducted with industry experts/CEOs/Marketing Managers/Sales Managers/VPs/Subject Matter Experts from both demand and supply side to get a 360-degree view of the market. The primary team conducts several interviews based on the complexity of the markets to understand the various market trends and dynamics which makes research more credible and precise.
A typical research interview fulfils the following functions:
- Provides first-hand information on the market size, market trends, growth trends, competitive landscape, and outlook
- Validates and strengthens in-house secondary research findings
- Develops the analysis team’s expertise and market understanding
Primary research involves email interactions and telephone interviews for each market, category, segment, and sub-segment across geographies. The participants who typically take part in such a process include, but are not limited to:
- Industry participants: VPs, business development managers, market intelligence managers and national sales managers
- Outside experts: Valuation experts, research analysts and key opinion leaders specializing in the electronics and semiconductor industry.
Below is the breakup of our primary respondents by company, designation, and region:

Once we receive the confirmation from primary research sources or primary respondents, we finalize the base year market estimation and forecast the data as per the macroeconomic and microeconomic factors assessed during data collection.
- Data Analysis:
Once data is validated through both secondary as well as primary respondents, we finalize the market estimations by hypothesis formulation and factor analysis at regional and country level.
- 3.1 Macro-Economic Factor Analysis:
We analyse macroeconomic indicators such the gross domestic product (GDP), increase in the demand for goods and services across industries, technological advancement, regional economic growth, governmental policies, the influence of COVID-19, PEST analysis, and other aspects. This analysis aids in setting benchmarks for various nations/regions and approximating market splits. Additionally, the general trend of the aforementioned components aid in determining the market's development possibilities.
- 3.2 Country Level Data:
Various factors that are especially aligned to the country are taken into account to determine the market size for a certain area and country, including the presence of vendors, such as headquarters and offices, the country's GDP, demand patterns, and industry growth. To comprehend the market dynamics for the nation, a number of growth variables, inhibitors, application areas, and current market trends are researched. The aforementioned elements aid in determining the country's overall market's growth potential.
- 3.3 Company Profile:
The “Table of Contents” is formulated by listing and analyzing more than 25 - 30 companies operating in the market ecosystem across geographies. However, we profile only 10 companies as a standard practice in our syndicate reports. These 10 companies comprise leading, emerging, and regional players. Nonetheless, our analysis is not restricted to the 10 listed companies, we also analyze other companies present in the market to develop a holistic view and understand the prevailing trends. The “Company Profiles” section in the report covers key facts, business description, products & services, financial information, SWOT analysis, and key developments. The financial information presented is extracted from the annual reports and official documents of the publicly listed companies. Upon collecting the information for the sections of respective companies, we verify them via various primary sources and then compile the data in respective company profiles. The company level information helps us in deriving the base number as well as in forecasting the market size.
- 3.4 Developing Base Number:
Aggregation of sales statistics (2020-2022) and macro-economic factor, and other secondary and primary research insights are utilized to arrive at base number and related market shares for 2022. The data gaps are identified in this step and relevant market data is analyzed, collected from paid primary interviews or databases. On finalizing the base year market size, forecasts are developed on the basis of macro-economic, industry and market growth factors and company level analysis.
- Data Triangulation and Final Review:
The market findings and base year market size calculations are validated from supply as well as demand side. Demand side validations are based on macro-economic factor analysis and benchmarks for respective regions and countries. In case of supply side validations, revenues of major companies are estimated (in case not available) based on industry benchmark, approximate number of employees, product portfolio, and primary interviews revenues are gathered. Further revenue from target product/service segment is assessed to avoid overshooting of market statistics. In case of heavy deviations between supply and demand side values, all thes steps are repeated to achieve synchronization.
We follow an iterative model, wherein we share our research findings with Subject Matter Experts (SME’s) and Key Opinion Leaders (KOLs) until consensus view of the market is not formulated – this model negates any drastic deviation in the opinions of experts. Only validated and universally acceptable research findings are quoted in our reports.
We have important check points that we use to validate our research findings – which we call – data triangulation, where we validate the information, we generate from secondary sources with primary interviews and then we re-validate with our internal data bases and Subject matter experts. This comprehensive model enables us to deliver high quality, reliable data in shortest possible time.
 Get Free Sample For