The playout automation and channel-in-a-box market size was valued US$ 20.6 billion in 2023 and is expected to reach US$ 63.3 billion by 2031; it is estimated to record a CAGR of 15.1% from 2023 to 2031. Implementation of unified solution is likely to remain a key trend in the market.
Playout Automation and Channel-In-a-Box Market Analysis
The market will continue to experience technological advancements, such as the integration of high-definition (HD) and ultra-high-definition (UHD) content, which will enhance the quality of channel presentation and viewer experience. There is a growing demand for highly customizable playout automation and channel-in-a-box solutions. Broadcasters are seeking solutions that can be tailored to their specific requirements, allowing them to deliver unique and personalized content to their audiences. The increasing popularity of OTT services, such as streaming platforms, is driving the demand for playout automation and channel-in-a-box solutions that can efficiently deliver content to these platforms. The playout automation and channel-in-a-box market size is likely to surge owing to the increasing demand for video content across various industries, including entertainment, news, sports, and lifestyle, presenting opportunities for playout automation and channel-in-a-box solutions providers to cater to this demand.
Playout Automation and Channel-In-a-Box Market Overview
Playout Automation refers to the automation of broadcasting processes, equipment, and software required to convert and play source media and channel content to an external on-air environment. It involves the scheduling, management, and delivery of content to viewers. Playout automation systems can handle tasks such as content ingest, storage, playlist management, graphics insertion, and transmission control. These systems aim to improve efficiency, reduce human error, and ensure smooth and uninterrupted broadcasting. The channel-in-a-box (CiaB) concept integrates multiple functions required to generate a channel signal into a single piece of equipment. It combines video playout servers, automation software, graphics, and other necessary components into a unified system. Channel-in-a-box systems are designed to simplify the broadcasting workflow by providing an all-in-one solution for channel creation and playout. They offer features such as content scheduling, graphics insertion, logo branding, and signal processing, all within a single device.
One of the key factors driving the adoption of playout automation and channel-in-a-box services is the increasing presence and availability of global brands in the broadcasting industry. As more broadcasters and content providers seek to expand their reach and deliver high-quality content, the demand for solutions facilitating efficient and cost-effective operations, such as playout automation and channel-in-a-box systems, has grown in the last few decades. These technologies offer numerous benefits, including streamlined operations, reduced hardware requirements, improved scalability, and enhanced flexibility in content management. They enable broadcasters to automate repetitive tasks, optimize resource utilization, and deliver content to viewers more efficiently and reliably.
Customize Research To Suit Your Requirement
We can optimize and tailor the analysis and scope which is unmet through our standard offerings. This flexibility will help you gain the exact information needed for your business planning and decision making.
Playout Automation and Channel-In-a-Box Market: Strategic Insights
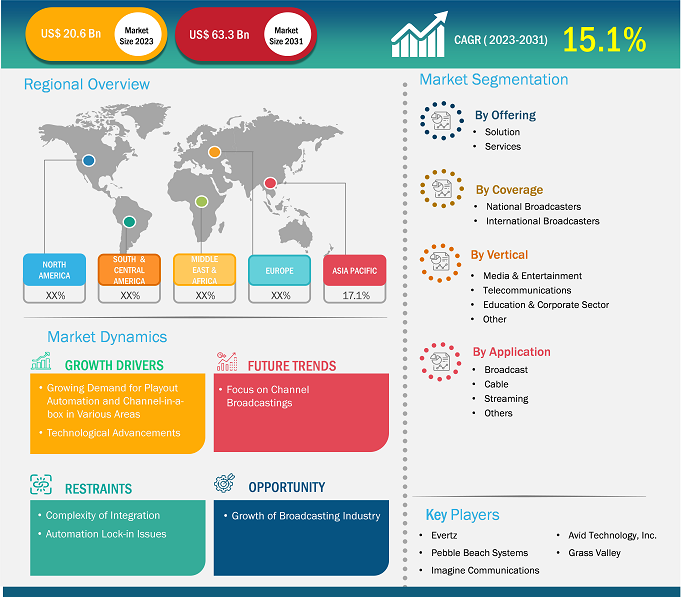
Market Size Value in US$ 20.6 billion in 2023 Market Size Value by US$ 63.3 billion by 2031 Growth rate CAGR of 15.1% from 2023 to 2031 Forecast Period 2023-2031 Base Year 2023

Naveen
Have a question?
Naveen will walk you through a 15-minute call to present the report’s content and answer all queries if you have any.
 Speak to Analyst
Customize Research To Suit Your Requirement
We can optimize and tailor the analysis and scope which is unmet through our standard offerings. This flexibility will help you gain the exact information needed for your business planning and decision making.
Playout Automation and Channel-In-a-Box Market: Strategic Insights
| Market Size Value in | US$ 20.6 billion in 2023 |
| Market Size Value by | US$ 63.3 billion by 2031 |
| Growth rate | CAGR of 15.1% from 2023 to 2031 |
| Forecast Period | 2023-2031 |
| Base Year | 2023 |
Naveen
Have a question?
Naveen will walk you through a 15-minute call to present the report’s content and answer all queries if you have any.
Speak to Analyst
Playout Automation and Channel-In-a-Box Market Drivers and Opportunities
Integration of AI and ML Technologies
The integration of artificial intelligence (AI) and machine learning (ML) technologies into tools, solutions, or processes employed in the broadcasting industry can have a positive impact on workflow flexibility and efficiency. AI has been used in closed captioning systems, where the system is trained to become proficient at accurately captioning words that people say, even those that are typically hard for some people to understand. AI systems translate inflections, accents, and pronunciations for their conversion into a readable text. Thus, various AI implementations have the potential to enhance workflow in the media and broadcasting industry.
The 2023 NAB Show exhibitors showcased ways to improve accuracy and efficiency in the broadcasting industry by using various AI and ML-based solutions. Further, TV broadcasters can find ways to economize operations while maintaining the quality of services provided to their customers. The AI and ML implementation in the playout automation and channel-in-a-box can help companies understand and predict viewer preferences that can maximize audience engagement. Moreover, ML models can help market players with efficient scheduling by learning from the historical data of customers or audiences. Thus, the adoption of AI and ML technologies can help the playout automation and channel-in-a-box market players gain more customers, thereby creating growth opportunities in the coming years.
Playout Automation and Channel-In-a-Box Market Report Segmentation Analysis
Key segments that contributed to the derivation of the playout automation and channel-in-a-box market analysis are offering, coverage, vertical, and application.
- Based on offering, the playout automation and channel-in-a-box market is divided into solutions and services. The solutions segment held the largest market share in 2023. Playout automation and channel-in-box solutions are essential for modern broadcasting, offering and streamlined and efficient approach to managing and broadcasting content. Hardware components of playout automation and channel-in-box systems include servers, graphics engines, capture cards, and networking and equipment.
- In terms of coverage, the market is segmented into national broadcasters and international broadcasters. The national broadcasters segment held a larger share of the market in 2023. National broadcasters serve a crucial role in the dissemination of information, entertainment, and cultural content to large audiences. In the rapidly evolving broadcasting landscape that demands 24/7 broadcasting, national broadcasters utilize playout automation and channel-in-box solutions to streamline operations and ensure broadcast continuity.
- In terms of vertical, the market is segmented into media & entertainment, telecommunications, education and corporate sector, and others. The media & entertainment segment held a larger share of the market in 2023. Playout automation channel-in-box solutions are great options for media and entertainment content broadcasters to get the best content. The solutions provide an efficient way to store, manage, and distribute media files, making it easier to reach more viewers. Broadcasters or content owners can offload much of the work associated with media management to external playout automation service providers, which helps them reduce overhead costs and gives them more control over how and when their media is used.
- In terms of application, the market is segmented into broadcast, cable, streaming, and others. The streaming segment held the largest market share in 2023. Playout automation systems are used to schedule and control the transmission of television programs, commercials, and other content. This automation is beneficial for live-streaming events, news channels, and linear streaming services that mimic traditional TV broadcasts. Automation facilitates dynamic ad insertion (DAI), which enables the delivery of targeted advertisements based on viewer data.
Playout Automation and Channel-In-a-Box Market Share Analysis by Geography
The geographic scope of the playout automation and channel-in-a-box market report is mainly divided into five regions: North America, Asia Pacific, Europe, the Middle East & Africa, and South & Central America.
The market in Asia Pacific region is experiencing considerable growth. The playout automation and channel-in-box market in Asia Pacific (APAC) is segmented into Australia, India, China, Japan, South Korea, and the Rest of APAC. It is a diverse region with a large population and a growing digital economy. APAC has witnessed a significant increase in internet penetration rates, leading to a surge in data consumption. According to the GSM Association, the IT industry has been instrumental in extending connectivity across the world. In 2021, APAC had ~59% of the total internet subscribers of the world, with the number further projected to reach up to 62% by 2025. Moreover, the rollout of 5G networks is expected to increase internet usage by enabling faster data speed, lower latency, and higher data device density. According to the GSM Association, APAC had ~8% of 5G users in 2021, and the share is projected to surge up to 25% by 2025. Therefore, the internet penetration and 5G rollout in broadcasting indicate the need for seamless, high-quality content. As more people gain access to the internet, the demand for OTT content and live streaming by consumers is increasing in the region, which compels broadcasters to use various solutions that amplify their efficiency to deliver their content seamlessly with enhanced scheduling. This factor fosters the adoption of playout automation and the channel-in-a-box in APAC.
According to the information on the World Football Summit (WFS) website, improved video quality, advanced cloud technologies, and global internet consumption are the major factors driving developments in the broadcasting landscape and over-the-top (OTT) streaming services in APAC. Moreover, the growing craze of football in APAC countries such as India and China underlines the requirement of broadcasting channels in these countries. According to BB Media, APAC is the region with the highest viewing of live sports content, and football is the sport with the highest sports content consumption. Thus, the flourishing broadcasting industry catalyzes the playout automation and channel-in-a-box market in APAC.
Playout Automation and Channel-In-a-Box Market Report Scope
Playout Automation and Channel-In-a-Box Market News and Recent Developments
The playout automation and channel-in-a-box market is evaluated by gathering qualitative and quantitative data post primary and secondary research, which includes important corporate publications, association data, and databases. A few of the developments in the playout automation and channel-in-a-box market are listed below:
- Imagine Communications is making it easier for media companies to efficiently operate channels everywhere with the launch of Aviator Automation. This ground-breaking automation solution enables multisite and multimodal channel origination in a unified on-prem and cloud ecosystem. Aviator Automation provides a common control system for playout, master control and live integration — regardless of where the resources to run those channels are located — and seamless operational coordination across linear and connected TV (CTV) channels. (Source: Imagine Communications, Press Release, March 2024)
Playout Automation and Channel-In-a-Box Market Report Coverage and Deliverables
The “Playout Automation and Channel-In-a-Box Market Size and Forecast (2021–2031)” report provides a detailed analysis of the market covering below areas:
- Playout automation and channel-in-a-box market size and forecast at global, regional, and country levels for all the key market segments covered under the scope
- Playout automation and channel-in-a-box market trends, as well as market dynamics such as drivers, restraints, and key opportunities
- Detailed PEST/Porter’s Five Forces and SWOT analysis
- Playout automation and channel-in-a-box market analysis covering key market trends, global and regional framework, major players, regulations, and recent market developments
- Industry landscape and competition analysis covering market concentration, heat map analysis, prominent players, and recent developments for the playout automation and channel-in-a-box market
- Detailed company profiles

Report Coverage
Revenue forecast, Company Analysis, Industry landscape, Growth factors, and Trends

Segment Covered
Offering, Coverage, Vertical, and Application

Regional Scope
North America, Europe, Asia Pacific, Middle East & Africa, South & Central America

Country Scope
This text is related
to country scope.
Frequently Asked Questions
Flourishing broadcasting industry; surging online education and e-learning practice; and technological advancements enabling immersive experience and easy integration are driving the market growth.
The market is expected to reach a value of US$ 63.3 billion by 2031.
Implementation of unified solution is a key trend in the market.
Evertz; Pebble Beach Systems; Imagine Communications; Avid Technology, Inc.; and Grass Valley are major players operating in the market.
Asia Pacific dominated the playout automation and channel-in-a-box market in 2023.
The market is anticipated to expand at a CAGR of 15.1% during 2023–2031.
1. Introduction
1.1 The Insight Partners Research Report Guidance
1.2 Market Segmentation
2. Executive Summary
2.1 Key Insights
2.2 Market Attractiveness
3. Research Methodology
3.1 Secondary Research
3.2 Primary Research
3.2.1 Hypothesis formulation:
3.2.2 Macro-economic factor analysis:
3.2.3 Developing base number:
3.2.4 Data Triangulation:
3.2.5 Country level data:
4. Playout Automation and Channel-in-a-Box Market Landscape
4.1 Overview
4.2 PEST Analysis
4.3 Ecosystem Analysis
4.3.1 List of Vendors in the Value Chain
5. Playout Automation and Channel-in-a-Box Market – Key Market Dynamics
5.1 Playout Automation and Channel-in-a-Box Market – Key Market Dynamics
5.2 Market Drivers
5.2.1 Flourishing Broadcasting Industry
5.2.2 Surging Online Education and E-Learning Practice
5.2.3 Technological Advancements Enabling Immersive Experience and Easy Integration
5.3 Market Restraints
5.3.1 Network Limitations
5.4 Market Opportunities
5.4.1 Integration with AI and ML
5.5 Future Trends
5.5.1 Implementation of Unified Solution
5.6 Impact of Drivers and Restraints:
6. Playout Automation and Channel-in-a-Box Market – Global Market Analysis
6.1 Playout Automation and Channel-in-a-Box Market Revenue (US$ Million), 2021–2031
6.2 Playout Automation and Channel-in-a-Box Market Forecast Analysis
7. Playout Automation and Channel-in-a-Box Market Analysis – by Offering
7.1 Solution
7.1.1 Overview
7.1.2 Solution: Playout Automation and Channel-in-a-Box Market – Revenue and Forecast to 2031 (US$ Million)
7.2 Services
7.2.1 Overview
7.2.2 Services: Playout Automation and Channel-in-a-Box Market – Revenue and Forecast to 2031 (US$ Million)
8. Playout Automation and Channel-in-a-Box Market Analysis – by Coverage
8.1 National Broadcasters
8.1.1 Overview
8.1.2 National Broadcasters: Playout Automation and Channel-in-a-Box Market – Revenue and Forecast to 2031 (US$ Million)
8.2 International Broadcasters
8.2.1 Overview
8.2.2 International Broadcasters: Playout Automation and Channel-in-a-Box Market – Revenue and Forecast to 2031 (US$ Million)
9. Playout Automation and Channel-in-a-Box Market Analysis – by Vertical
9.1 Media and Entertainment
9.1.1 Overview
9.1.2 Media and Entertainment: Playout Automation and Channel-in-a-Box Market – Revenue and Forecast to 2031 (US$ Million)
9.2 Telecommunications
9.2.1 Overview
9.2.2 Telecommunications: Playout Automation and Channel-in-a-Box Market – Revenue and Forecast to 2031 (US$ Million)
9.3 Education and Corporate Sector
9.3.1 Overview
9.3.2 Education and Corporate Sector: Playout Automation and Channel-in-a-Box Market – Revenue and Forecast to 2031 (US$ Million)
9.4 Others
9.4.1 Overview
9.4.2 Others: Playout Automation and Channel-in-a-Box Market – Revenue and Forecast to 2031 (US$ Million)
10. Playout Automation and Channel-in-a-Box Market Analysis – by Application
10.1 Broadcast
10.1.1 Overview
10.1.2 Broadcast: Playout Automation and Channel-in-a-Box Market – Revenue and Forecast to 2031 (US$ Million)
10.2 Cable
10.2.1 Overview
10.2.2 Cable: Playout Automation and Channel-in-a-Box Market – Revenue and Forecast to 2031 (US$ Million)
10.3 Streaming
10.3.1 Overview
10.3.2 Streaming: Playout Automation and Channel-in-a-Box Market – Revenue and Forecast to 2031 (US$ Million)
10.4 Others
10.4.1 Overview
10.4.2 Others: Playout Automation and Channel-in-a-Box Market – Revenue and Forecast to 2031 (US$ Million)
11. Playout Automation and Channel-in-a-Box Market – Geographical Analysis
11.1 Overview
11.2 North America
11.2.1 North America Playout Automation and Channel-in-a-Box Market Overview
11.2.2 North America: Playout Automation and Channel-in-a-Box Market – Revenue and Forecast to 2031 (US$ Million)
11.2.3 North America: Playout Automation and Channel-in-a-Box Market Breakdown, by Offering
11.2.3.1 North America: Playout Automation and Channel-in-a-Box Market – Revenue and Forecast Analysis – by Offering
11.2.4 North America: Playout Automation and Channel-in-a-Box Market Breakdown, by Coverage
11.2.4.1 North America: Playout Automation and Channel-in-a-Box Market – Revenue and Forecast Analysis – by Coverage
11.2.5 North America: Playout Automation and Channel-in-a-Box Market Breakdown, by Vertical
11.2.5.1 North America: Playout Automation and Channel-in-a-Box Market – Revenue and Forecast Analysis – by Vertical
11.2.6 North America: Playout Automation and Channel-in-a-Box Market Breakdown, by Application
11.2.6.1 North America: Playout Automation and Channel-in-a-Box Market – Revenue and Forecast Analysis – by Application
11.2.7 North America: Playout Automation and Channel-in-a-Box Market – Revenue and Forecast Analysis – by Country
11.2.7.1 North America: Playout Automation and Channel-in-a-Box Market – Revenue and Forecast Analysis – by Country
11.2.7.2 United States: Playout Automation and Channel-in-a-Box Market – Revenue and Forecast to 2031 (US$ Million)
11.2.7.2.1 United States: Playout Automation and Channel-in-a-Box Market Breakdown, by Offering
11.2.7.2.2 United States: Playout Automation and Channel-in-a-Box Market Breakdown, by Coverage
11.2.7.2.3 United States: Playout Automation and Channel-in-a-Box Market Breakdown, by Vertical
11.2.7.2.4 United States: Playout Automation and Channel-in-a-Box Market Breakdown, by Application
11.2.7.3 Canada: Playout Automation and Channel-in-a-Box Market – Revenue and Forecast to 2031 (US$ Million)
11.2.7.3.1 Canada: Playout Automation and Channel-in-a-Box Market Breakdown, by Offering
11.2.7.3.2 Canada: Playout Automation and Channel-in-a-Box Market Breakdown, by Coverage
11.2.7.3.3 Canada: Playout Automation and Channel-in-a-Box Market Breakdown, by Vertical
11.2.7.3.4 Canada: Playout Automation and Channel-in-a-Box Market Breakdown, by Application
11.2.7.4 Mexico: Playout Automation and Channel-in-a-Box Market – Revenue and Forecast to 2031 (US$ Million)
11.2.7.4.1 Mexico: Playout Automation and Channel-in-a-Box Market Breakdown, by Offering
11.2.7.4.2 Mexico: Playout Automation and Channel-in-a-Box Market Breakdown, by Coverage
11.2.7.4.3 Mexico: Playout Automation and Channel-in-a-Box Market Breakdown, by Vertical
11.2.7.4.4 Mexico: Playout Automation and Channel-in-a-Box Market Breakdown, by Application
11.3 Europe
11.3.1 Europe Playout Automation and Channel-in-a-Box Market Overview
11.3.2 Europe: Playout Automation and Channel-in-a-Box Market – Revenue and Forecast to 2031 (US$ Million)
11.3.3 Europe: Playout Automation and Channel-in-a-Box Market Breakdown, by Offering
11.3.3.1 Europe: Playout Automation and Channel-in-a-Box Market – Revenue and Forecast Analysis – by Offering
11.3.4 Europe: Playout Automation and Channel-in-a-Box Market Breakdown, by Coverage
11.3.4.1 Europe: Playout Automation and Channel-in-a-Box Market – Revenue and Forecast Analysis – by Coverage
11.3.5 Europe: Playout Automation and Channel-in-a-Box Market Breakdown, by Vertical
11.3.5.1 Europe: Playout Automation and Channel-in-a-Box Market – Revenue and Forecast Analysis – by Vertical
11.3.6 Europe: Playout Automation and Channel-in-a-Box Market Breakdown, by Application
11.3.6.1 Europe: Playout Automation and Channel-in-a-Box Market – Revenue and Forecast Analysis – by Application
11.3.7 Europe: Playout Automation and Channel-in-a-Box Market – Revenue and Forecast Analysis – by Country
11.3.7.1 Europe: Playout Automation and Channel-in-a-Box Market – Revenue and Forecast Analysis – by Country
11.3.7.2 Germany: Playout Automation and Channel-in-a-Box Market – Revenue and Forecast to 2031 (US$ Million)
11.3.7.2.1 Germany: Playout Automation and Channel-in-a-Box Market Breakdown, by Offering
11.3.7.2.2 Germany: Playout Automation and Channel-in-a-Box Market Breakdown, by Coverage
11.3.7.2.3 Germany: Playout Automation and Channel-in-a-Box Market Breakdown, by Vertical
11.3.7.2.4 Germany: Playout Automation and Channel-in-a-Box Market Breakdown, by Application
11.3.7.3 United Kingdom: Playout Automation and Channel-in-a-Box Market – Revenue and Forecast to 2031 (US$ Million)
11.3.7.3.1 United Kingdom: Playout Automation and Channel-in-a-Box Market Breakdown, by Offering
11.3.7.3.2 United Kingdom: Playout Automation and Channel-in-a-Box Market Breakdown, by Coverage
11.3.7.3.3 United Kingdom: Playout Automation and Channel-in-a-Box Market Breakdown, by Vertical
11.3.7.3.4 United Kingdom: Playout Automation and Channel-in-a-Box Market Breakdown, by Application
11.3.7.4 France: Playout Automation and Channel-in-a-Box Market – Revenue and Forecast to 2031 (US$ Million)
11.3.7.4.1 France: Playout Automation and Channel-in-a-Box Market Breakdown, by Offering
11.3.7.4.2 France: Playout Automation and Channel-in-a-Box Market Breakdown, by Coverage
11.3.7.4.3 France: Playout Automation and Channel-in-a-Box Market Breakdown, by Vertical
11.3.7.4.4 France: Playout Automation and Channel-in-a-Box Market Breakdown, by Application
11.3.7.5 Italy: Playout Automation and Channel-in-a-Box Market – Revenue and Forecast to 2031 (US$ Million)
11.3.7.5.1 Italy: Playout Automation and Channel-in-a-Box Market Breakdown, by Offering
11.3.7.5.2 Italy: Playout Automation and Channel-in-a-Box Market Breakdown, by Coverage
11.3.7.5.3 Italy: Playout Automation and Channel-in-a-Box Market Breakdown, by Vertical
11.3.7.5.4 Italy: Playout Automation and Channel-in-a-Box Market Breakdown, by Application
11.3.7.6 Russia: Playout Automation and Channel-in-a-Box Market – Revenue and Forecast to 2031 (US$ Million)
11.3.7.6.1 Russia: Playout Automation and Channel-in-a-Box Market Breakdown, by Offering
11.3.7.6.2 Russia: Playout Automation and Channel-in-a-Box Market Breakdown, by Coverage
11.3.7.6.3 Russia: Playout Automation and Channel-in-a-Box Market Breakdown, by Vertical
11.3.7.6.4 Russia: Playout Automation and Channel-in-a-Box Market Breakdown, by Application
11.3.7.7 Rest of Europe: Playout Automation and Channel-in-a-Box Market – Revenue and Forecast to 2031 (US$ Million)
11.3.7.7.1 Rest of Europe: Playout Automation and Channel-in-a-Box Market Breakdown, by Offering
11.3.7.7.2 Rest of Europe: Playout Automation and Channel-in-a-Box Market Breakdown, by Coverage
11.3.7.7.3 Rest of Europe: Playout Automation and Channel-in-a-Box Market Breakdown, by Vertical
11.3.7.7.4 Rest of Europe: Playout Automation and Channel-in-a-Box Market Breakdown, by Application
11.4 Asia Pacific
11.4.1 Asia Pacific Playout Automation and Channel-in-a-Box Market Overview
11.4.2 Asia Pacific: Playout Automation and Channel-in-a-Box Market – Revenue and Forecast to 2031 (US$ Million)
11.4.3 Asia Pacific: Playout Automation and Channel-in-a-Box Market Breakdown, by Offering
11.4.3.1 Asia Pacific: Playout Automation and Channel-in-a-Box Market – Revenue and Forecast Analysis – by Offering
11.4.4 Asia Pacific: Playout Automation and Channel-in-a-Box Market Breakdown, by Coverage
11.4.4.1 Asia Pacific: Playout Automation and Channel-in-a-Box Market – Revenue and Forecast Analysis – by Coverage
11.4.5 Asia Pacific: Playout Automation and Channel-in-a-Box Market Breakdown, by Vertical
11.4.5.1 Asia Pacific: Playout Automation and Channel-in-a-Box Market – Revenue and Forecast Analysis – by Vertical
11.4.6 Asia Pacific: Playout Automation and Channel-in-a-Box Market Breakdown, by Application
11.4.6.1 Asia Pacific: Playout Automation and Channel-in-a-Box Market – Revenue and Forecast Analysis – by Application
11.4.7 Asia Pacific: Playout Automation and Channel-in-a-Box Market – Revenue and Forecast Analysis – by Country
11.4.7.1 Asia Pacific: Playout Automation and Channel-in-a-Box Market – Revenue and Forecast Analysis – by Country
11.4.7.2 Australia: Playout Automation and Channel-in-a-Box Market – Revenue and Forecast to 2031 (US$ Million)
11.4.7.2.1 Australia: Playout Automation and Channel-in-a-Box Market Breakdown, by Offering
11.4.7.2.2 Australia: Playout Automation and Channel-in-a-Box Market Breakdown, by Coverage
11.4.7.2.3 Australia: Playout Automation and Channel-in-a-Box Market Breakdown, by Vertical
11.4.7.2.4 Australia: Playout Automation and Channel-in-a-Box Market Breakdown, by Application
11.4.7.3 India: Playout Automation and Channel-in-a-Box Market – Revenue and Forecast to 2031 (US$ Million)
11.4.7.3.1 India: Playout Automation and Channel-in-a-Box Market Breakdown, by Offering
11.4.7.3.2 India: Playout Automation and Channel-in-a-Box Market Breakdown, by Coverage
11.4.7.3.3 India: Playout Automation and Channel-in-a-Box Market Breakdown, by Vertical
11.4.7.3.4 India: Playout Automation and Channel-in-a-Box Market Breakdown, by Application
11.4.7.4 China: Playout Automation and Channel-in-a-Box Market – Revenue and Forecast to 2031 (US$ Million)
11.4.7.4.1 China: Playout Automation and Channel-in-a-Box Market Breakdown, by Offering
11.4.7.4.2 China: Playout Automation and Channel-in-a-Box Market Breakdown, by Coverage
11.4.7.4.3 China: Playout Automation and Channel-in-a-Box Market Breakdown, by Vertical
11.4.7.4.4 China: Playout Automation and Channel-in-a-Box Market Breakdown, by Application
11.4.7.5 Japan: Playout Automation and Channel-in-a-Box Market – Revenue and Forecast to 2031 (US$ Million)
11.4.7.5.1 Japan: Playout Automation and Channel-in-a-Box Market Breakdown, by Offering
11.4.7.5.2 Japan: Playout Automation and Channel-in-a-Box Market Breakdown, by Coverage
11.4.7.5.3 Japan: Playout Automation and Channel-in-a-Box Market Breakdown, by Vertical
11.4.7.5.4 Japan: Playout Automation and Channel-in-a-Box Market Breakdown, by Application
11.4.7.6 South Korea: Playout Automation and Channel-in-a-Box Market – Revenue and Forecast to 2031 (US$ Million)
11.4.7.6.1 South Korea: Playout Automation and Channel-in-a-Box Market Breakdown, by Offering
11.4.7.6.2 South Korea: Playout Automation and Channel-in-a-Box Market Breakdown, by Coverage
11.4.7.6.3 South Korea: Playout Automation and Channel-in-a-Box Market Breakdown, by Vertical
11.4.7.6.4 South Korea: Playout Automation and Channel-in-a-Box Market Breakdown, by Application
11.4.7.7 Rest of APAC: Playout Automation and Channel-in-a-Box Market – Revenue and Forecast to 2031 (US$ Million)
11.4.7.7.1 Rest of APAC: Playout Automation and Channel-in-a-Box Market Breakdown, by Offering
11.4.7.7.2 Rest of APAC: Playout Automation and Channel-in-a-Box Market Breakdown, by Coverage
11.4.7.7.3 Rest of APAC: Playout Automation and Channel-in-a-Box Market Breakdown, by Vertical
11.4.7.7.4 Rest of APAC: Playout Automation and Channel-in-a-Box Market Breakdown, by Application
11.5 Middle East and Africa
11.5.1 Middle East and Africa Playout Automation and Channel-in-a-Box Market Overview
11.5.2 Middle East and Africa: Playout Automation and Channel-in-a-Box Market – Revenue and Forecast to 2031 (US$ Million)
11.5.3 Middle East and Africa: Playout Automation and Channel-in-a-Box Market Breakdown, by Offering
11.5.3.1 Middle East and Africa: Playout Automation and Channel-in-a-Box Market – Revenue and Forecast Analysis – by Offering
11.5.4 Middle East and Africa: Playout Automation and Channel-in-a-Box Market Breakdown, by Coverage
11.5.4.1 Middle East and Africa: Playout Automation and Channel-in-a-Box Market – Revenue and Forecast Analysis – by Coverage
11.5.5 Middle East and Africa: Playout Automation and Channel-in-a-Box Market Breakdown, by Vertical
11.5.5.1 Middle East and Africa: Playout Automation and Channel-in-a-Box Market – Revenue and Forecast Analysis – by Vertical
11.5.6 Middle East and Africa: Playout Automation and Channel-in-a-Box Market Breakdown, by Application
11.5.6.1 Middle East and Africa: Playout Automation and Channel-in-a-Box Market – Revenue and Forecast Analysis – by Application
11.5.7 Middle East and Africa: Playout Automation and Channel-in-a-Box Market – Revenue and Forecast Analysis – by Country
11.5.7.1 Middle East and Africa: Playout Automation and Channel-in-a-Box Market – Revenue and Forecast Analysis – by Country
11.5.7.2 South Africa: Playout Automation and Channel-in-a-Box Market – Revenue and Forecast to 2031 (US$ Million)
11.5.7.2.1 South Africa: Playout Automation and Channel-in-a-Box Market Breakdown, by Offering
11.5.7.2.2 South Africa: Playout Automation and Channel-in-a-Box Market Breakdown, by Coverage
11.5.7.2.3 South Africa: Playout Automation and Channel-in-a-Box Market Breakdown, by Vertical
11.5.7.2.4 South Africa: Playout Automation and Channel-in-a-Box Market Breakdown, by Application
11.5.7.3 Saudi Arabia: Playout Automation and Channel-in-a-Box Market – Revenue and Forecast to 2031 (US$ Million)
11.5.7.3.1 Saudi Arabia: Playout Automation and Channel-in-a-Box Market Breakdown, by Offering
11.5.7.3.2 Saudi Arabia: Playout Automation and Channel-in-a-Box Market Breakdown, by Coverage
11.5.7.3.3 Saudi Arabia: Playout Automation and Channel-in-a-Box Market Breakdown, by Vertical
11.5.7.3.4 Saudi Arabia: Playout Automation and Channel-in-a-Box Market Breakdown, by Application
11.5.7.4 United Arab Emirates: Playout Automation and Channel-in-a-Box Market – Revenue and Forecast to 2031 (US$ Million)
11.5.7.4.1 United Arab Emirates: Playout Automation and Channel-in-a-Box Market Breakdown, by Offering
11.5.7.4.2 United Arab Emirates: Playout Automation and Channel-in-a-Box Market Breakdown, by Coverage
11.5.7.4.3 United Arab Emirates: Playout Automation and Channel-in-a-Box Market Breakdown, by Vertical
11.5.7.4.4 United Arab Emirates: Playout Automation and Channel-in-a-Box Market Breakdown, by Application
11.5.7.5 Rest of Middle East and Africa: Playout Automation and Channel-in-a-Box Market – Revenue and Forecast to 2031 (US$ Million)
11.5.7.5.1 Rest of Middle East and Africa: Playout Automation and Channel-in-a-Box Market Breakdown, by Offering
11.5.7.5.2 Rest of Middle East and Africa: Playout Automation and Channel-in-a-Box Market Breakdown, by Coverage
11.5.7.5.3 Rest of Middle East and Africa: Playout Automation and Channel-in-a-Box Market Breakdown, by Vertical
11.5.7.5.4 Rest of Middle East and Africa: Playout Automation and Channel-in-a-Box Market Breakdown, by Application
11.6 South and Central America
11.6.1 South and Central America Playout Automation and Channel-in-a-Box Market Overview
11.6.2 South and Central America: Playout Automation and Channel-in-a-Box Market – Revenue and Forecast to 2031 (US$ Million)
11.6.3 South and Central America: Playout Automation and Channel-in-a-Box Market Breakdown, by Offering
11.6.3.1 South and Central America: Playout Automation and Channel-in-a-Box Market – Revenue and Forecast Analysis – by Offering
11.6.4 South and Central America: Playout Automation and Channel-in-a-Box Market Breakdown, by Coverage
11.6.4.1 South and Central America: Playout Automation and Channel-in-a-Box Market – Revenue and Forecast Analysis – by Coverage
11.6.5 South and Central America: Playout Automation and Channel-in-a-Box Market Breakdown, by Vertical
11.6.5.1 South and Central America: Playout Automation and Channel-in-a-Box Market – Revenue and Forecast Analysis – by Vertical
11.6.6 South and Central America: Playout Automation and Channel-in-a-Box Market Breakdown, by Application
11.6.6.1 South and Central America: Playout Automation and Channel-in-a-Box Market – Revenue and Forecast Analysis – by Application
11.6.7 South and Central America: Playout Automation and Channel-in-a-Box Market – Revenue and Forecast Analysis – by Country
11.6.7.1 South and Central America: Playout Automation and Channel-in-a-Box Market – Revenue and Forecast Analysis – by Country
11.6.7.2 Brazil: Playout Automation and Channel-in-a-Box Market – Revenue and Forecast to 2031 (US$ Million)
11.6.7.2.1 Brazil: Playout Automation and Channel-in-a-Box Market Breakdown, by Offering
11.6.7.2.2 Brazil: Playout Automation and Channel-in-a-Box Market Breakdown, by Coverage
11.6.7.2.3 Brazil: Playout Automation and Channel-in-a-Box Market Breakdown, by Vertical
11.6.7.2.4 Brazil: Playout Automation and Channel-in-a-Box Market Breakdown, by Application
11.6.7.3 Argentina: Playout Automation and Channel-in-a-Box Market – Revenue and Forecast to 2031 (US$ Million)
11.6.7.3.1 Argentina: Playout Automation and Channel-in-a-Box Market Breakdown, by Offering
11.6.7.3.2 Argentina: Playout Automation and Channel-in-a-Box Market Breakdown, by Coverage
11.6.7.3.3 Argentina: Playout Automation and Channel-in-a-Box Market Breakdown, by Vertical
11.6.7.3.4 Argentina: Playout Automation and Channel-in-a-Box Market Breakdown, by Application
11.6.7.4 Rest of South and Central America: Playout Automation and Channel-in-a-Box Market – Revenue and Forecast to 2031 (US$ Million)
11.6.7.4.1 Rest of South and Central America: Playout Automation and Channel-in-a-Box Market Breakdown, by Offering
11.6.7.4.2 Rest of South and Central America: Playout Automation and Channel-in-a-Box Market Breakdown, by Coverage
11.6.7.4.3 Rest of South and Central America: Playout Automation and Channel-in-a-Box Market Breakdown, by Vertical
11.6.7.4.4 Rest of South and Central America: Playout Automation and Channel-in-a-Box Market Breakdown, by Application
12. Competitive Landscape
12.1 Heat Map Analysis by Key Players
12.2 Company Positioning & Concentration
13. Industry Landscape
13.1 Overview
13.2 Market Initiative
13.3 Product Development
13.4 Mergers & Acquisitions
14. Company Profiles
14.1 Evertz Technologies Ltd
14.1.1 Key Facts
14.1.2 Business Description
14.1.3 Products and Services
14.1.4 Financial Overview
14.1.5 SWOT Analysis
14.1.6 Key Developments
14.2 Harmonic Inc
14.2.1 Key Facts
14.2.2 Business Description
14.2.3 Products and Services
14.2.4 Financial Overview
14.2.5 SWOT Analysis
14.2.6 Key Developments
14.3 Pebble Beach Systems
14.3.1 Key Facts
14.3.2 Business Description
14.3.3 Products and Services
14.3.4 Financial Overview
14.3.5 SWOT Analysis
14.3.6 Key Developments
14.4 Grass Valley Canada
14.4.1 Key Facts
14.4.2 Business Description
14.4.3 Products and Services
14.4.4 Financial Overview
14.4.5 SWOT Analysis
14.4.6 Key Developments
14.5 Avid Technology, Inc.
14.5.1 Key Facts
14.5.2 Business Description
14.5.3 Products and Services
14.5.4 Financial Overview
14.5.5 SWOT Analysis
14.5.6 Key Developments
14.6 Imagine Communications
14.6.1 Key Facts
14.6.2 Business Description
14.6.3 Products and Services
14.6.4 Financial Overview
14.6.5 SWOT Analysis
14.6.6 Key Developments
14.7 Amagi
14.7.1 Key Facts
14.7.2 Business Description
14.7.3 Products and Services
14.7.4 Financial Overview
14.7.5 SWOT Analysis
14.7.6 Key Developments
14.8 Playbox Technology
14.8.1 Key Facts
14.8.2 Business Description
14.8.3 Products and Services
14.8.4 Financial Overview
14.8.5 SWOT Analysis
14.8.6 Key Developments
14.9 Aveco s.r.o.
14.9.1 Key Facts
14.9.2 Business Description
14.9.3 Products and Services
14.9.4 Financial Overview
14.9.5 SWOT Analysis
14.9.6 Key Developments
14.10 ENCO Systems, Inc.
14.10.1 Key Facts
14.10.2 Business Description
14.10.3 Products and Services
14.10.4 Financial Overview
14.10.5 SWOT Analysis
14.10.6 Key Developments
15. Appendix
15.1 Word Index
15.2 About The Insight Partners
List of Tables
Table 1. Playout Automation and Channel-in-a-Box Market Segmentation
Table 2. List of Vendors
Table 3. Playout Automation and Channel-in-a-Box Market – Revenue and Forecast to 2031 (US$ Million)
Table 4. Playout Automation and Channel-in-a-Box Market – Revenue and Forecast to 2031 (US$ Million) – by Offering
Table 5. Playout Automation and Channel-in-a-Box Market – Revenue and Forecast to 2031 (US$ Million) – by Coverage
Table 6. Playout Automation and Channel-in-a-Box Market – Revenue and Forecast to 2031 (US$ Million) – by Vertical
Table 7. Playout Automation and Channel-in-a-Box Market – Revenue and Forecast to 2031 (US$ Million) – by Application
Table 8. North America: Playout Automation and Channel-in-a-Box Market – Revenue and Forecast to 2031(US$ Million) – by Offering
Table 9. North America: Playout Automation and Channel-in-a-Box Market – Revenue and Forecast to 2031(US$ Million) – by Coverage
Table 10. North America: Playout Automation and Channel-in-a-Box Market – Revenue and Forecast to 2031(US$ Million) – by Vertical
Table 11. North America: Playout Automation and Channel-in-a-Box Market – Revenue and Forecast to 2031(US$ Million) – by Application
Table 12. North America: Playout Automation and Channel-in-a-Box Market – Revenue and Forecast to 2031(US$ Million) – by Country
Table 13. United States: Playout Automation and Channel-in-a-Box Market – Revenue and Forecast to 2031(US$ Million) – by Offering
Table 14. United States: Playout Automation and Channel-in-a-Box Market – Revenue and Forecast to 2031(US$ Million) – by Coverage
Table 15. United States: Playout Automation and Channel-in-a-Box Market – Revenue and Forecast to 2031(US$ Million) – by Vertical
Table 16. United States: Playout Automation and Channel-in-a-Box Market – Revenue and Forecast to 2031(US$ Million) – by Application
Table 17. Canada: Playout Automation and Channel-in-a-Box Market – Revenue and Forecast to 2031(US$ Million) – by Offering
Table 18. Canada: Playout Automation and Channel-in-a-Box Market – Revenue and Forecast to 2031(US$ Million) – by Coverage
Table 19. Canada: Playout Automation and Channel-in-a-Box Market – Revenue and Forecast to 2031(US$ Million) – by Vertical
Table 20. Canada: Playout Automation and Channel-in-a-Box Market – Revenue and Forecast to 2031(US$ Million) – by Application
Table 21. Mexico: Playout Automation and Channel-in-a-Box Market – Revenue and Forecast to 2031(US$ Million) – by Offering
Table 22. Mexico: Playout Automation and Channel-in-a-Box Market – Revenue and Forecast to 2031(US$ Million) – by Coverage
Table 23. Mexico: Playout Automation and Channel-in-a-Box Market – Revenue and Forecast to 2031(US$ Million) – by Vertical
Table 24. Mexico: Playout Automation and Channel-in-a-Box Market – Revenue and Forecast to 2031(US$ Million) – by Application
Table 25. Europe: Playout Automation and Channel-in-a-Box Market – Revenue and Forecast to 2031(US$ Million) – by Offering
Table 26. Europe: Playout Automation and Channel-in-a-Box Market – Revenue and Forecast to 2031(US$ Million) – by Coverage
Table 27. Europe: Playout Automation and Channel-in-a-Box Market – Revenue and Forecast to 2031(US$ Million) – by Vertical
Table 28. Europe: Playout Automation and Channel-in-a-Box Market – Revenue and Forecast to 2031(US$ Million) – by Application
Table 29. Europe: Playout Automation and Channel-in-a-Box Market – Revenue and Forecast to 2031(US$ Million) – by Country
Table 30. Germany: Playout Automation and Channel-in-a-Box Market – Revenue and Forecast to 2031(US$ Million) – by Offering
Table 31. Germany: Playout Automation and Channel-in-a-Box Market – Revenue and Forecast to 2031(US$ Million) – by Coverage
Table 32. Germany: Playout Automation and Channel-in-a-Box Market – Revenue and Forecast to 2031(US$ Million) – by Vertical
Table 33. Germany: Playout Automation and Channel-in-a-Box Market – Revenue and Forecast to 2031(US$ Million) – by Application
Table 34. United Kingdom: Playout Automation and Channel-in-a-Box Market – Revenue and Forecast to 2031(US$ Million) – by Offering
Table 35. United Kingdom: Playout Automation and Channel-in-a-Box Market – Revenue and Forecast to 2031(US$ Million) – by Coverage
Table 36. United Kingdom: Playout Automation and Channel-in-a-Box Market – Revenue and Forecast to 2031 (US$ Million) – by Vertical
Table 37. United Kingdom: Playout Automation and Channel-in-a-Box Market – Revenue and Forecast to 2031 (US$ Million) – by Application
Table 38. France: Playout Automation and Channel-in-a-Box Market – Revenue and Forecast to 2031(US$ Million) – by Offering
Table 39. France: Playout Automation and Channel-in-a-Box Market – Revenue and Forecast to 2031(US$ Million) – by Coverage
Table 40. France: Playout Automation and Channel-in-a-Box Market – Revenue and Forecast to 2031(US$ Million) – by Vertical
Table 41. France: Playout Automation and Channel-in-a-Box Market – Revenue and Forecast to 2031(US$ Million) – by Application
Table 42. Italy: Playout Automation and Channel-in-a-Box Market – Revenue and Forecast to 2031(US$ Million) – by Offering
Table 43. Italy: Playout Automation and Channel-in-a-Box Market – Revenue and Forecast to 2031(US$ Million) – by Coverage
Table 44. Italy: Playout Automation and Channel-in-a-Box Market – Revenue and Forecast to 2031(US$ Million) – by Vertical
Table 45. Italy: Playout Automation and Channel-in-a-Box Market – Revenue and Forecast to 2031(US$ Million) – by Application
Table 46. Russia: Playout Automation and Channel-in-a-Box Market – Revenue and Forecast to 2031(US$ Million) – by Offering
Table 47. Russia: Playout Automation and Channel-in-a-Box Market – Revenue and Forecast to 2031(US$ Million) – by Coverage
Table 48. Russia: Playout Automation and Channel-in-a-Box Market – Revenue and Forecast to 2031(US$ Million) – by Vertical
Table 49. Russia: Playout Automation and Channel-in-a-Box Market – Revenue and Forecast to 2031(US$ Million) – by Application
Table 50. Rest of Europe: Playout Automation and Channel-in-a-Box Market – Revenue and Forecast to 2031(US$ Million) – by Offering
Table 51. Rest of Europe: Playout Automation and Channel-in-a-Box Market – Revenue and Forecast to 2031(US$ Million) – by Coverage
Table 52. Rest of Europe: Playout Automation and Channel-in-a-Box Market – Revenue and Forecast to 2031(US$ Million) – by Vertical
Table 53. Rest of Europe: Playout Automation and Channel-in-a-Box Market – Revenue and Forecast to 2031(US$ Million) – by Application
Table 54. Asia Pacific: Playout Automation and Channel-in-a-Box Market – Revenue and Forecast to 2031(US$ Million) – by Offering
Table 55. Asia Pacific: Playout Automation and Channel-in-a-Box Market – Revenue and Forecast to 2031(US$ Million) – by Coverage
Table 56. Asia Pacific: Playout Automation and Channel-in-a-Box Market – Revenue and Forecast to 2031(US$ Million) – by Vertical
Table 57. Asia Pacific: Playout Automation and Channel-in-a-Box Market – Revenue and Forecast to 2031(US$ Million) – by Application
Table 58. Asia Pacific: Playout Automation and Channel-in-a-Box Market – Revenue and Forecast to 2031(US$ Million) – by Country
Table 59. Australia: Playout Automation and Channel-in-a-Box Market – Revenue and Forecast to 2031(US$ Million) – by Offering
Table 60. Australia: Playout Automation and Channel-in-a-Box Market – Revenue and Forecast to 2031(US$ Million) – by Coverage
Table 61. Australia: Playout Automation and Channel-in-a-Box Market – Revenue and Forecast to 2031(US$ Million) – by Vertical
Table 62. Australia: Playout Automation and Channel-in-a-Box Market – Revenue and Forecast to 2031(US$ Million) – by Application
Table 63. India: Playout Automation and Channel-in-a-Box Market – Revenue and Forecast to 2031(US$ Million) – by Offering
Table 64. India: Playout Automation and Channel-in-a-Box Market – Revenue and Forecast to 2031(US$ Million) – by Coverage
Table 65. India: Playout Automation and Channel-in-a-Box Market – Revenue and Forecast to 2031(US$ Million) – by Vertical
Table 66. India: Playout Automation and Channel-in-a-Box Market – Revenue and Forecast to 2031(US$ Million) – by Application
Table 67. China: Playout Automation and Channel-in-a-Box Market – Revenue and Forecast to 2031(US$ Million) – by Offering
Table 68. China: Playout Automation and Channel-in-a-Box Market – Revenue and Forecast to 2031(US$ Million) – by Coverage
Table 69. China: Playout Automation and Channel-in-a-Box Market – Revenue and Forecast to 2031(US$ Million) – by Vertical
Table 70. China: Playout Automation and Channel-in-a-Box Market – Revenue and Forecast to 2031(US$ Million) – by Application
Table 71. Japan: Playout Automation and Channel-in-a-Box Market – Revenue and Forecast to 2031(US$ Million) – by Offering
Table 72. Japan: Playout Automation and Channel-in-a-Box Market – Revenue and Forecast to 2031(US$ Million) – by Coverage
Table 73. Japan: Playout Automation and Channel-in-a-Box Market – Revenue and Forecast to 2031(US$ Million) – by Vertical
Table 74. Japan: Playout Automation and Channel-in-a-Box Market – Revenue and Forecast to 2031(US$ Million) – by Application
Table 75. South Korea: Playout Automation and Channel-in-a-Box Market – Revenue and Forecast to 2031(US$ Million) – by Offering
Table 76. South Korea: Playout Automation and Channel-in-a-Box Market – Revenue and Forecast to 2031(US$ Million) – by Coverage
Table 77. South Korea: Playout Automation and Channel-in-a-Box Market – Revenue and Forecast to 2031(US$ Million) – by Vertical
Table 78. South Korea: Playout Automation and Channel-in-a-Box Market – Revenue and Forecast to 2031(US$ Million) – by Application
Table 79. Rest of APAC: Playout Automation and Channel-in-a-Box Market – Revenue and Forecast to 2031(US$ Million) – by Offering
Table 80. Rest of APAC: Playout Automation and Channel-in-a-Box Market – Revenue and Forecast to 2031(US$ Million) – by Coverage
Table 81. Rest of APAC: Playout Automation and Channel-in-a-Box Market – Revenue and Forecast to 2031(US$ Million) – by Vertical
Table 82. Rest of APAC: Playout Automation and Channel-in-a-Box Market – Revenue and Forecast to 2031(US$ Million) – by Application
Table 83. Middle East and Africa: Playout Automation and Channel-in-a-Box Market – Revenue and Forecast to 2031 (US$ Million) – by Offering
Table 84. Middle East and Africa: Playout Automation and Channel-in-a-Box Market – Revenue and Forecast to 2031 (US$ Million) – by Coverage
Table 85. Middle East and Africa: Playout Automation and Channel-in-a-Box Market – Revenue and Forecast to 2031 (US$ Million) – by Vertical
Table 86. Middle East and Africa: Playout Automation and Channel-in-a-Box Market – Revenue and Forecast to 2031 (US$ Million) – by Application
Table 87. Middle East and Africa: Playout Automation and Channel-in-a-Box Market – Revenue and Forecast to 2031 (US$ Million) – by Country
Table 88. South Africa: Playout Automation and Channel-in-a-Box Market – Revenue and Forecast to 2031(US$ Million) – by Offering
Table 89. South Africa: Playout Automation and Channel-in-a-Box Market – Revenue and Forecast to 2031(US$ Million) – by Coverage
Table 90. South Africa: Playout Automation and Channel-in-a-Box Market – Revenue and Forecast to 2031(US$ Million) – by Vertical
Table 91. South Africa: Playout Automation and Channel-in-a-Box Market – Revenue and Forecast to 2031(US$ Million) – by Application
Table 92. Saudi Arabia: Playout Automation and Channel-in-a-Box Market – Revenue and Forecast to 2031(US$ Million) – by Offering
Table 93. Saudi Arabia: Playout Automation and Channel-in-a-Box Market – Revenue and Forecast to 2031(US$ Million) – by Coverage
Table 94. Saudi Arabia: Playout Automation and Channel-in-a-Box Market – Revenue and Forecast to 2031(US$ Million) – by Vertical
Table 95. Saudi Arabia: Playout Automation and Channel-in-a-Box Market – Revenue and Forecast to 2031(US$ Million) –by Application
Table 96. United Arab Emirates: Playout Automation and Channel-in-a-Box Market – Revenue and Forecast to 2031(US$ Million) – by Offering
Table 97. United Arab Emirates: Playout Automation and Channel-in-a-Box Market – Revenue and Forecast to 2031(US$ Million) – by Coverage
Table 98. United Arab Emirates: Playout Automation and Channel-in-a-Box Market – Revenue and Forecast to 2031(US$ Million) – by Vertical
Table 99. United Arab Emirates: Playout Automation and Channel-in-a-Box Market – Revenue and Forecast to 2031 (US$ Million) – by Application
Table 100. Rest of Middle East and Africa: Playout Automation and Channel-in-a-Box Market – Revenue and Forecast to 2031(US$ Million) – by Offering
Table 101. Rest of Middle East and Africa: Playout Automation and Channel-in-a-Box Market – Revenue and Forecast to 2031(US$ Million) – by Coverage
Table 102. Rest of Middle East and Africa: Playout Automation and Channel-in-a-Box Market – Revenue and Forecast to 2031(US$ Million) – by Vertical
Table 103. Rest of Middle East and Africa: Playout Automation and Channel-in-a-Box Market – Revenue and Forecast to 2031(US$ Million) – by Application
Table 104. South and Central America: Playout Automation and Channel-in-a-Box Market – Revenue and Forecast to 2031(US$ Million) – by Offering
Table 105. South and Central America: Playout Automation and Channel-in-a-Box Market – Revenue and Forecast to 2031(US$ Million) – by Coverage
Table 106. South and Central America: Playout Automation and Channel-in-a-Box Market – Revenue and Forecast to 2031(US$ Million) – by Vertical
Table 107. South and Central America: Playout Automation and Channel-in-a-Box Market – Revenue and Forecast to 2031(US$ Million) – by Application
Table 108. South and Central America: Playout Automation and Channel-in-a-Box Market – Revenue and Forecast to 2031(US$ Million) – by Country
Table 109. Brazil: Playout Automation and Channel-in-a-Box Market – Revenue and Forecast to 2031(US$ Million) – by Offering
Table 110. Brazil: Playout Automation and Channel-in-a-Box Market – Revenue and Forecast to 2031(US$ Million) – by Coverage
Table 111. Brazil: Playout Automation and Channel-in-a-Box Market – Revenue and Forecast to 2031(US$ Million) – by Vertical
Table 112. Brazil: Playout Automation and Channel-in-a-Box Market – Revenue and Forecast to 2031(US$ Million) – by Application
Table 113. Argentina: Playout Automation and Channel-in-a-Box Market – Revenue and Forecast to 2031(US$ Million) – by Offering
Table 114. Argentina: Playout Automation and Channel-in-a-Box Market – Revenue and Forecast to 2031(US$ Million) – by Coverage
Table 115. Argentina: Playout Automation and Channel-in-a-Box Market – Revenue and Forecast to 2031(US$ Million) – by Vertical
Table 116. Argentina: Playout Automation and Channel-in-a-Box Market – Revenue and Forecast to 2031(US$ Million) – by Application
Table 117. Rest of South and Central America: Playout Automation and Channel-in-a-Box Market – Revenue and Forecast to 2031(US$ Million) – by Offering
Table 118. Rest of South and Central America: Playout Automation and Channel-in-a-Box Market – Revenue and Forecast to 2031(US$ Million) – by Coverage
Table 119. Rest of South and Central America: Playout Automation and Channel-in-a-Box Market – Revenue and Forecast to 2031(US$ Million) – by Vertical
Table 120. Rest of South and Central America: Playout Automation and Channel-in-a-Box Market – Revenue and Forecast to 2031(US$ Million) – by Application
Table 121. Company Positioning & Concentration
Table 122. List of Abbreviation
List of Figures
Figure 1. Playout Automation and Channel-in-a-Box Market Segmentation, by Geography
Figure 2. PEST Analysis
Figure 3. Ecosystem Analysis
Figure 4. Impact Analysis of Drivers and Restraints
Figure 5. Playout Automation and Channel-in-a-Box Market Revenue (US$ Million), 2021–2031
Figure 6. Playout Automation and Channel-in-a-Box Market Share (%) – by Offering (2023 and 2031)
Figure 7. Solution: Playout Automation and Channel-in-a-Box Market – Revenue and Forecast to 2031 (US$ Million)
Figure 8. Services: Playout Automation and Channel-in-a-Box Market – Revenue and Forecast to 2031 (US$ Million)
Figure 9. Playout Automation and Channel-in-a-Box Market Share (%) – by Coverage (2023 and 2031)
Figure 10. National Broadcasters: Playout Automation and Channel-in-a-Box Market – Revenue and Forecast to 2031 (US$ Million)
Figure 11. International Broadcasters: Playout Automation and Channel-in-a-Box Market – Revenue and Forecast to 2031 (US$ Million)
Figure 12. Playout Automation and Channel-in-a-Box Market Share (%) – by Vertical (2023 and 2031)
Figure 13. Media and Entertainment: Playout Automation and Channel-in-a-Box Market – Revenue and Forecast to 2031 (US$ Million)
Figure 14. Telecommunications: Playout Automation and Channel-in-a-Box Market – Revenue and Forecast to 2031 (US$ Million)
Figure 15. Education and Corporate Sector: Playout Automation and Channel-in-a-Box Market – Revenue and Forecast to 2031 (US$ Million)
Figure 16. Others: Playout Automation and Channel-in-a-Box Market – Revenue and Forecast to 2031 (US$ Million)
Figure 17. Playout Automation and Channel-in-a-Box Market Share (%) – by Application (2023 and 2031)
Figure 18. Broadcast: Playout Automation and Channel-in-a-Box Market – Revenue and Forecast to 2031 (US$ Million)
Figure 19. Cable: Playout Automation and Channel-in-a-Box Market – Revenue and Forecast to 2031 (US$ Million)
Figure 20. Streaming: Playout Automation and Channel-in-a-Box Market – Revenue and Forecast to 2031 (US$ Million)
Figure 21. Others: Playout Automation and Channel-in-a-Box Market – Revenue and Forecast to 2031 (US$ Million)
Figure 22. Playout Automation and Channel-in-a-Box Market Breakdown by Region, 2023 and 2031 (%)
Figure 23. North America: Playout Automation and Channel-in-a-Box Market – Revenue and Forecast to 2031(US$ Million)
Figure 24. North America: Playout Automation and Channel-in-a-Box Market Breakdown, by Offering (2023 and 2031)
Figure 25. North America: Playout Automation and Channel-in-a-Box Market Breakdown, by Coverage (2023 and 2031)
Figure 26. North America: Playout Automation and Channel-in-a-Box Market Breakdown, by Vertical (2023 and 2031)
Figure 27. North America: Playout Automation and Channel-in-a-Box Market Breakdown, by Application (2023 and 2031)
Figure 28. North America: Playout Automation and Channel-in-a-Box Market Breakdown, by Key Countries, 2023 and 2031 (%)
Figure 29. United States: Playout Automation and Channel-in-a-Box Market – Revenue and Forecast to 2031(US$ Million)
Figure 30. Canada: Playout Automation and Channel-in-a-Box Market – Revenue and Forecast to 2031(US$ Million)
Figure 31. Mexico: Playout Automation and Channel-in-a-Box Market – Revenue and Forecast to 2031(US$ Million)
Figure 32. Europe: Playout Automation and Channel-in-a-Box Market – Revenue and Forecast to 2031(US$ Million)
Figure 33. Europe: Playout Automation and Channel-in-a-Box Market Breakdown, by Offering (2023 and 2031)
Figure 34. Europe: Playout Automation and Channel-in-a-Box Market Breakdown, by Coverage (2023 and 2031)
Figure 35. Europe: Playout Automation and Channel-in-a-Box Market Breakdown, by Vertical (2023 and 2031)
Figure 36. Europe: Playout Automation and Channel-in-a-Box Market Breakdown, by Application (2023 and 2031)
Figure 37. Europe: Playout Automation and Channel-in-a-Box Market Breakdown, by Key Countries, 2023 and 2031 (%)
Figure 38. Germany: Playout Automation and Channel-in-a-Box Market – Revenue and Forecast to 2031(US$ Million)
Figure 39. United Kingdom: Playout Automation and Channel-in-a-Box Market – Revenue and Forecast to 2031 (US$ Million)
Figure 40. France: Playout Automation and Channel-in-a-Box Market – Revenue and Forecast to 2031(US$ Million)
Figure 41. Italy: Playout Automation and Channel-in-a-Box Market – Revenue and Forecast to 2031(US$ Million)
Figure 42. Russia: Playout Automation and Channel-in-a-Box Market – Revenue and Forecast to 2031(US$ Million)
Figure 43. Rest of Europe: Playout Automation and Channel-in-a-Box Market – Revenue and Forecast to 2031(US$ Million)
Figure 44. Asia Pacific: Playout Automation and Channel-in-a-Box Market – Revenue and Forecast to 2031(US$ Million)
Figure 45. Asia Pacific: Playout Automation and Channel-in-a-Box Market Breakdown, by Offering (2023 and 2031)
Figure 46. Asia Pacific: Playout Automation and Channel-in-a-Box Market Breakdown, by Coverage (2023 and 2031)
Figure 47. Asia Pacific: Playout Automation and Channel-in-a-Box Market Breakdown, by Vertical (2023 and 2031)
Figure 48. Asia Pacific: Playout Automation and Channel-in-a-Box Market Breakdown, by Application (2023 and 2031)
Figure 49. Asia Pacific: Playout Automation and Channel-in-a-Box Market Breakdown, by Key Countries, 2023 and 2031 (%)
Figure 50. Australia: Playout Automation and Channel-in-a-Box Market – Revenue and Forecast to 2031(US$ Million)
Figure 51. India: Playout Automation and Channel-in-a-Box Market – Revenue and Forecast to 2031(US$ Million)
Figure 52. China: Playout Automation and Channel-in-a-Box Market – Revenue and Forecast to 2031(US$ Million)
Figure 53. Japan: Playout Automation and Channel-in-a-Box Market – Revenue and Forecast to 2031(US$ Million)
Figure 54. South Korea: Playout Automation and Channel-in-a-Box Market – Revenue and Forecast to 2031(US$ Million)
Figure 55. Rest of APAC: Playout Automation and Channel-in-a-Box Market – Revenue and Forecast to 2031(US$ Million)
Figure 56. Middle East and Africa: Playout Automation and Channel-in-a-Box Market – Revenue and Forecast to 2031 (US$ Million)
Figure 57. Middle East and Africa: Playout Automation and Channel-in-a-Box Market Breakdown, by Offering (2023 and 2031)
Figure 58. Middle East and Africa: Playout Automation and Channel-in-a-Box Market Breakdown, by Coverage (2023 and 2031)
Figure 59. Middle East and Africa: Playout Automation and Channel-in-a-Box Market Breakdown, by Vertical (2023 and 2031)
Figure 60. Middle East and Africa: Playout Automation and Channel-in-a-Box Market Breakdown, by Application (2023 and 2031)
Figure 61. Middle East and Africa: Playout Automation and Channel-in-a-Box Market Breakdown, by Key Countries, 2023 and 2031 (%)
Figure 62. South Africa: Playout Automation and Channel-in-a-Box Market – Revenue and Forecast to 2031(US$ Million)
Figure 63. Saudi Arabia: Playout Automation and Channel-in-a-Box Market – Revenue and Forecast to 2031(US$ Million)
Figure 64. United Arab Emirates: Playout Automation and Channel-in-a-Box Market – Revenue and Forecast to 2031 (US$ Million)
Figure 65. Rest of Middle East and Africa: Playout Automation and Channel-in-a-Box Market – Revenue and Forecast to 2031(US$ Million)
Figure 66. South and Central America: Playout Automation and Channel-in-a-Box Market – Revenue and Forecast to 2031(US$ Million)
Figure 67. South and Central America: Playout Automation and Channel-in-a-Box Market Breakdown, by Offering (2023 and 2031)
Figure 68. South and Central America: Playout Automation and Channel-in-a-Box Market Breakdown, by Coverage (2023 and 2031)
Figure 69. South and Central America: Playout Automation and Channel-in-a-Box Market Breakdown, by Vertical (2023 and 2031)
Figure 70. South and Central America: Playout Automation and Channel-in-a-Box Market Breakdown, by Application (2023 and 2031)
Figure 71. South and Central America: Playout Automation and Channel-in-a-Box Market Breakdown, by Key Countries, 2023 and 2031 (%)
Figure 72. Brazil: Playout Automation and Channel-in-a-Box Market – Revenue and Forecast to 2031(US$ Million)
Figure 73. Argentina: Playout Automation and Channel-in-a-Box Market – Revenue and Forecast to 2031(US$ Million)
Figure 74. Rest of South and Central America: Playout Automation and Channel-in-a-Box Market – Revenue and Forecast to 2031(US$ Million)
Figure 75. Heat Map Analysis by Key Players
The List of Companies -Playout Automation & Channel-in-a-Box Market
- Evertz Technologies Ltd
- Harmonic Inc
- Pebble Beach Systems
- Grass Valley Canada
- Avid Technology, Inc.
- Imagine Communications
- Amagi
- Playbox Technology
- Aveco s.r.o.
- ENCO Systems, Inc.
The Insight Partners performs research in 4 major stages: Data Collection & Secondary Research, Primary Research, Data Analysis and Data Triangulation & Final Review.
- Data Collection and Secondary Research:
As a market research and consulting firm operating from a decade, we have published many reports and advised several clients across the globe. First step for any study will start with an assessment of currently available data and insights from existing reports. Further, historical and current market information is collected from Investor Presentations, Annual Reports, SEC Filings, etc., and other information related to company’s performance and market positioning are gathered from Paid Databases (Factiva, Hoovers, and Reuters) and various other publications available in public domain.
Several associations trade associates, technical forums, institutes, societies and organizations are accessed to gain technical as well as market related insights through their publications such as research papers, blogs and press releases related to the studies are referred to get cues about the market. Further, white papers, journals, magazines, and other news articles published in the last 3 years are scrutinized and analyzed to understand the current market trends.
- Primary Research:
The primarily interview analysis comprise of data obtained from industry participants interview and answers to survey questions gathered by in-house primary team.
For primary research, interviews are conducted with industry experts/CEOs/Marketing Managers/Sales Managers/VPs/Subject Matter Experts from both demand and supply side to get a 360-degree view of the market. The primary team conducts several interviews based on the complexity of the markets to understand the various market trends and dynamics which makes research more credible and precise.
A typical research interview fulfils the following functions:
- Provides first-hand information on the market size, market trends, growth trends, competitive landscape, and outlook
- Validates and strengthens in-house secondary research findings
- Develops the analysis team’s expertise and market understanding
Primary research involves email interactions and telephone interviews for each market, category, segment, and sub-segment across geographies. The participants who typically take part in such a process include, but are not limited to:
- Industry participants: VPs, business development managers, market intelligence managers and national sales managers
- Outside experts: Valuation experts, research analysts and key opinion leaders specializing in the electronics and semiconductor industry.
Below is the breakup of our primary respondents by company, designation, and region:

Once we receive the confirmation from primary research sources or primary respondents, we finalize the base year market estimation and forecast the data as per the macroeconomic and microeconomic factors assessed during data collection.
- Data Analysis:
Once data is validated through both secondary as well as primary respondents, we finalize the market estimations by hypothesis formulation and factor analysis at regional and country level.
- 3.1 Macro-Economic Factor Analysis:
We analyse macroeconomic indicators such the gross domestic product (GDP), increase in the demand for goods and services across industries, technological advancement, regional economic growth, governmental policies, the influence of COVID-19, PEST analysis, and other aspects. This analysis aids in setting benchmarks for various nations/regions and approximating market splits. Additionally, the general trend of the aforementioned components aid in determining the market's development possibilities.
- 3.2 Country Level Data:
Various factors that are especially aligned to the country are taken into account to determine the market size for a certain area and country, including the presence of vendors, such as headquarters and offices, the country's GDP, demand patterns, and industry growth. To comprehend the market dynamics for the nation, a number of growth variables, inhibitors, application areas, and current market trends are researched. The aforementioned elements aid in determining the country's overall market's growth potential.
- 3.3 Company Profile:
The “Table of Contents” is formulated by listing and analyzing more than 25 - 30 companies operating in the market ecosystem across geographies. However, we profile only 10 companies as a standard practice in our syndicate reports. These 10 companies comprise leading, emerging, and regional players. Nonetheless, our analysis is not restricted to the 10 listed companies, we also analyze other companies present in the market to develop a holistic view and understand the prevailing trends. The “Company Profiles” section in the report covers key facts, business description, products & services, financial information, SWOT analysis, and key developments. The financial information presented is extracted from the annual reports and official documents of the publicly listed companies. Upon collecting the information for the sections of respective companies, we verify them via various primary sources and then compile the data in respective company profiles. The company level information helps us in deriving the base number as well as in forecasting the market size.
- 3.4 Developing Base Number:
Aggregation of sales statistics (2020-2022) and macro-economic factor, and other secondary and primary research insights are utilized to arrive at base number and related market shares for 2022. The data gaps are identified in this step and relevant market data is analyzed, collected from paid primary interviews or databases. On finalizing the base year market size, forecasts are developed on the basis of macro-economic, industry and market growth factors and company level analysis.
- Data Triangulation and Final Review:
The market findings and base year market size calculations are validated from supply as well as demand side. Demand side validations are based on macro-economic factor analysis and benchmarks for respective regions and countries. In case of supply side validations, revenues of major companies are estimated (in case not available) based on industry benchmark, approximate number of employees, product portfolio, and primary interviews revenues are gathered. Further revenue from target product/service segment is assessed to avoid overshooting of market statistics. In case of heavy deviations between supply and demand side values, all thes steps are repeated to achieve synchronization.
We follow an iterative model, wherein we share our research findings with Subject Matter Experts (SME’s) and Key Opinion Leaders (KOLs) until consensus view of the market is not formulated – this model negates any drastic deviation in the opinions of experts. Only validated and universally acceptable research findings are quoted in our reports.
We have important check points that we use to validate our research findings – which we call – data triangulation, where we validate the information, we generate from secondary sources with primary interviews and then we re-validate with our internal data bases and Subject matter experts. This comprehensive model enables us to deliver high quality, reliable data in shortest possible time.
 Get Free Sample For