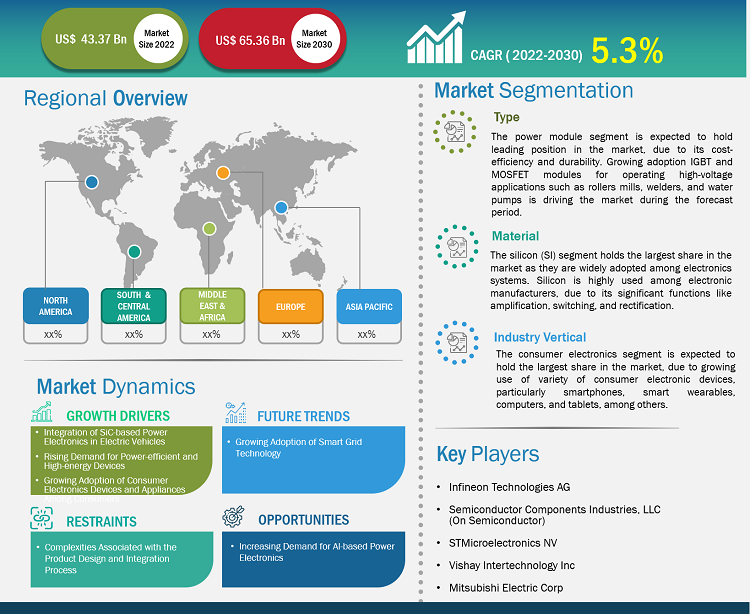
The power electronics market is projected to grow from US$ 43.37 billion in 2022 to US$ 65.36 billion by 2030; it is expected to expand at a CAGR of 5.30% from 2022 to 2030. Rapid development of electric vehicles is expected to be a key trend in the market.
Power Electronics Market Analysis
Rising electrical energy consumption across the globe is driving the power electronics market. More than 50% of total energy consumption is predicted to be transformed into electricity, which must be produced, distributed, and used as effectively as feasible. Furthermore, rising climate change encourages manufacturers to develop sustainable solutions is fueling the power electronics market. Under such changing conditions, two major technologies that are likely to play critical roles in resolving future problems include a shift in electrical power production from conventional, fossil (and short-term) based energy sources to renewable energy sources, as well as the use of highly efficient power electronics in power transmission/distribution, power generation, and end-user application, which is driving the power electronics market.
Power Electronics Market Industry Overview
Power electronics is a device with a circuit that distributes power from a source to a load in a sturdy, efficient, compact, and substantial manner for easy use. Power electronics play a major part in electrified vehicle applications by supplying small and high-efficiency power conversion systems.
The device uses diodes, transistors, and thyristors to control the transfer of electric power from one form to another. Power electronics devices, which have a faster switching rate and higher efficiency, can be utilized to execute operations efficiently at high current or high voltage. Furthermore, depending on the application, power electronics can regulate both unidirectional and bidirectional energy flow, and regenerated energy can be returned for utility. Power electronics devices are projected to be significant technologies in the future, helping to improve system efficiency and performance in automotive and energy-saving applications. These factors are anticipated to fuel the power electronics market.
Customize Research To Suit Your Requirement
We can optimize and tailor the analysis and scope which is unmet through our standard offerings. This flexibility will help you gain the exact information needed for your business planning and decision making.
Power Electronics Market: Strategic Insights
Market Size Value in US$ 43.37 billion in 2022 Market Size Value by US$ 65.36 billion by 2030 Growth rate CAGR of 5.3% from 2022 to 2030 Forecast Period 2022-2030 Base Year 2022

Naveen
Have a question?
Naveen will walk you through a 15-minute call to present the report’s content and answer all queries if you have any.
 Speak to Analyst
Customize Research To Suit Your Requirement
We can optimize and tailor the analysis and scope which is unmet through our standard offerings. This flexibility will help you gain the exact information needed for your business planning and decision making.
Power Electronics Market: Strategic Insights
| Market Size Value in | US$ 43.37 billion in 2022 |
| Market Size Value by | US$ 65.36 billion by 2030 |
| Growth rate | CAGR of 5.3% from 2022 to 2030 |
| Forecast Period | 2022-2030 |
| Base Year | 2022 |
Naveen
Have a question?
Naveen will walk you through a 15-minute call to present the report’s content and answer all queries if you have any.
Speak to Analyst
Power Electronics Market Driver and Opportunities
Rising Demand for Power-efficient and High-energy Devices to Favor Market Growth
Industrial appliances such as motor drives, power converters, UPSs, and server power supplies consume a large amount of power. Consequently, any improvement in industrial power supply efficiency will result in a significant drop in operating expenses for a business. The demand for high-efficiency power supplies is increasing across the globe due to their improved thermal performance and higher power density. Currently, uninterruptible power supplies are one of the most widely used applications for power semiconductors. Numerous hardware such as computers, communications equipment, data centers, and other electrical equipment are integrated with power semiconductors that protect them against unplanned power outages. The system used for uninterruptible power supplies typically consists of batteries and an IGBT (insulated-gate bipolar transistor) inverter, which have high voltage capabilities. This increases its adoption in high-current-density applications.
High-efficiency power sources are becoming increasingly necessary worldwide. Growing awareness related to efficient energy usage is creating demand for power semiconductors among consumers. Power semiconductors are also becoming an essential component to reduce the carbon footprint of society worldwide. Power semiconductors such as diodes, thyristors, and transistors are highly used for regulating electricity in automotive, consumer electronics, power, energy, ICT, and other industries. Thus, the rising demand for power-efficient and high-energy devices drives the power electronics market.
Emergence of Wide-Bandgap Semiconductor Materials
Technologies based on wide-bandgap semiconductors meet all of the industry's current requirements. As the name implies, they have a bigger bandgap, which allows various electrical devices to operate at high voltages, temperature, and frequency. Wide-bandgap semiconductors have the advantages of increased power efficiency and cheaper cost. For instance, GaN and SiC can improve the performance of power electronics and produce more efficient outputs than typical silicon devices. Further, wide-bandgap materials have a 3eV+ wide-bandgap, which is a critical feature for carrying out high-voltage activities. Thus, the emergence of wide-bandwidth semiconductor materials is expected to supplement the growth of the power electronics market during the forecast period.
Power Electronics Market Report Segmentation Analysis
The key segments that contributed to the derivation of the power electronics market analysis are installation and end user.
- By Type, the market is divided into power discrete, power module, and power IC.
- By material, the market is divided into Silicon (SI), Silicon Carbide (SIC), Gallium Nitride (GAN), and Others.
- By industry vertical, the market is divided into ICT, automotive & transportation, consumer electronics, industrial, energy & power, and others.
- Based on type, the power electronics market is segmented into power discrete, power module, and power IC. The power module segment held the largest power electronics market share in 2022 and is anticipated to grow during the forecast period.
Power Electronics Market Share Analysis By Geography
Based on region, the market is segmented into North America, Europe, Asia Pacific, Middle East & Africa, and South & Central America.
Asia Pacific held the largest power electronics market share in 2022. The significant presence of consumer electronics can be linked to the market's expansion in Asia Pacific. The rising demand for power generation, as well as government attempts to support power generation in several Asia Pacific countries, are boosting the cost of power generation. Renewable energy infrastructure development is a critical factor driving the power electronics market. Moreover, the expanding population in developing countries, particularly China and India, which is increasing the deployment of communication infrastructure, is expected to fuel the market expansion for power electronics in the region during the forecast period. The presence of well-established power electronics market players such as Renesas Electronics Corporation, Mitsubishi Electric Corporation, Fuji Electric Co., and Toshiba Corporation in Asia Pacific boosts the market growth. Furthermore, the development of Chinese firms such as BYO, Huawei, CRRC, and Sungrow is strengthening the domestic power electronics sector in the country. All these factors are driving the growth of the Asia Pacific power electronics market.
China remains the world's largest automobile sector in terms of yearly sales as well as manufacturing output, with domestic output estimated to exceed 35 million vehicles by 2025. According to Ministry of Industry and Information Technology figures, over 26 million vehicles were sold in 2021, including 21.48 million passenger vehicles—representing a 7.1% increase over 2020. Commercial vehicle sales totaled 4.79 million units, a 6.6% decrease from 2020. Moreover, China is witnessing increased demand for EVs. For instance, in 2022, more than 5.92 million new passenger plug-in electric cars were recorded in China (83% more than in 2021), registering a new record. Thus, there is an increased need to control automobile engines in the field of automotive electronics for proper control and conversion, thereby increasing the importance of power electronics. The growth of the power electronics market in China is expected to create several opportunities for businesses and individuals that develop and manufacture power electronics products and services.
Power Electronics Market Report Scope
Power Electronics Market News and Recent Developments
The power electronics market is evaluated by gathering qualitative and quantitative data post primary and secondary research, which includes important corporate publications, association data, and databases. A few of the developments in the Power Electronics Market are listed below:
- In August 2023, Vishay Intertechnology introduced a new 650V E Series power MOSFET of the fourth generation that provides high efficiency and power density for telecom, industrial, and computing applications. The Vishay Siliconix n-channel SiHP054N65E reduces on-resistance by 48.2%. It offers a 59% reduction in resistance times gate charge, a key figure of merit (FOM) for 650V MOSFETs used in power conversion applications. (Source: Vishay Intertechnology, Press Release, August 2023)
Power Electronics Market Report Coverage & Deliverables
The power electronics market forecast is estimated based on various secondary and primary research findings, such as key company publications, association data, and databases. The market report "Power Electronics Market Size and Forecast (2020–2030)" provides a detailed analysis of the market covering below areas-
- Power electronics market size and forecast at global, regional, and country levels for all the key market segments covered under the scope
- Power electronics market trends, as well as market dynamics such as drivers, restraints, and key opportunities
- Detailed PEST/Porter’s Five Forces and SWOT analysis
- Power electronics market analysis covering key market trends, global and regional framework, major players, regulations, and recent market developments
- Industry landscape and competition analysis covering market concentration, heat map analysis, prominent players, and recent developments in the Power Electronics Market
- Detailed company profiles.

Report Coverage
Revenue forecast, Company Analysis, Industry landscape, Growth factors, and Trends

Segment Covered
Type, Material, and Industry Vertical

Regional Scope
North America, Europe, Asia Pacific, Middle East & Africa, South & Central America

Country Scope
This text is related
to country scope.
Frequently Asked Questions
The power electronics market size is projected to reach US$ 65.36 billion by 2030.
Asia Pacific is expected to dominate the power electronics market with the highest market share in 2022.
The global power electronics market was estimated to grow at a CAGR of 5.3% during 2022 - 2030.
Rising demand for power-efficient& high-energy devices and growing adoption of renewable energy sources are the major factors that drive the global power electronics market.
Rapid development of electric vehicles is a major trend in the market.
Infineon Technologies AG, Semiconductor Components Industries, L.L.C. (On Semiconductor), STMicroelectronics NV, Mitsubishi Electric Corp, Fuji Electric Co Ltd, ROHM Co Ltd, Renesas Electronics Corp, Littelfuse, Inc., and Toshiba Electronic Devices & Storage Corp are the major market players.
1. Introduction
1.1 The Insight Partners Research Report Guidance
1.2 Market Segmentation
2. Executive Summary
2.1 Key Insights
2.2 Market Attractiveness
3. Research Methodology
3.1 Coverage
3.2 Secondary Research
3.3 Primary Research
4. Power Electronics Market Landscape
4.1 Overview
4.2 PEST Analysis
4.3 Ecosystem Analysis
4.3.1 List of Vendors in Value Chain:
5. Power Electronics Market - Key Industry Dynamics
5.1 Drivers
5.1.1 Integration of SiC-based Power Electronics in Electric Vehicles
5.1.2 Rising Demand for Power-efficient and High-energy Devices
5.2 Market Restraints
5.2.1 Complexities Associated with the Product Design and Integration Process
5.3 Market Opportunities
5.3.1 Increasing Demand for AI-based Power Electronics
5.4 Future Trends
5.4.1 Growing Adoption of Smart Grid Technology
5.5 Impact of Drivers and Restraints:
6. Power Electronics Market - Global Market Analysis
6.1 Power Electronics Market Overview
6.2 Power Electronics Market Revenue (US$ Million), 2022 – 2030
6.3 Power Electronics Market Forecast and Analysis
7. Power Electronics Market Analysis – Type
7.1 Power Discrete
7.1.1 Overview
7.1.2 Power Discrete Market Revenue and Forecasts To 2030 (US$ Million)
7.2 Power Module
7.2.1 Overview
7.2.2 Power Module Market Revenue and Forecasts To 2030 (US$ Million)
7.3 Power IC
7.3.1 Overview
7.3.2 Power IC Market Revenue and Forecasts To 2030 (US$ Million)
8. Power Electronics Market Analysis – Material
8.1 Silicon (SI)
8.1.1 Overview
8.1.2 Silicon (SI) Market Revenue and Forecasts To 2030 (US$ Million)
8.2 Silicon Carbide (SIC)
8.2.1 Overview
8.2.2 Silicon Carbide (SIC) Market Revenue and Forecasts To 2030 (US$ Million)
8.3 Gallium Nitride (GAN)
8.3.1 Overview
8.3.2 Gallium Nitride (GAN) Market Revenue and Forecasts To 2030 (US$ Million)
8.4 Others
8.4.1 Overview
8.4.2 Others Market Revenue and Forecasts To 2030 (US$ Million)
9. Power Electronics Market Analysis – Industry Vertical
9.1 ICT
9.1.1 Overview
9.1.2 ICT Market Revenue and Forecasts To 2030 (US$ Million)
9.2 Automotive and Transportation
9.2.1 Overview
9.2.2 Automotive and Transportation Market Revenue and Forecasts To 2030 (US$ Million)
9.3 Consumer Electronics
9.3.1 Overview
9.3.2 Consumer Electronics Market Revenue and Forecasts To 2030 (US$ Million)
9.4 Industrial
9.4.1 Overview
9.4.2 Industrial Market Revenue and Forecasts To 2030 (US$ Million)
9.5 Energy and Power
9.5.1 Overview
9.5.2 Energy and Power Market Revenue and Forecasts To 2030 (US$ Million)
9.6 Others
9.6.1 Overview
9.6.2 Others Market Revenue and Forecasts To 2030 (US$ Million)
10. Power Electronics Market - Geographical Analysis
10.1 North America
10.1.1 North America Power Electronics Market Overview
10.1.2 North America Power Electronics Market Revenue and Forecasts to 2030 (US$ Mn)
10.1.3 North America Power Electronics Market Breakdown by Type
10.1.3.1 North America Power Electronics Market Revenue and Forecasts To 2030 (US$ Mn) – By Type
10.1.4 North America Power Electronics Market Breakdown by Material
10.1.4.1 North America Power Electronics Market Revenue and Forecasts To 2030 (US$ Mn) – By Material
10.1.5 North America Power Electronics Market Breakdown by Industry Vertical
10.1.5.1 North America Power Electronics Market Revenue and Forecasts To 2030 (US$ Mn) – By Industry Vertical
10.1.6 North America Power Electronics Market Revenue and Forecasts and Analysis - By Countries
10.1.6.1 US Power Electronics Market Revenue and Forecasts to 2030 (US$ Mn)
10.1.6.1.1 US Power Electronics Market Breakdown by Type
10.1.6.1.2 US Power Electronics Market Breakdown by Material
10.1.6.1.3 US Power Electronics Market Breakdown by Industry Vertical
10.1.6.2 Canada Power Electronics Market Revenue and Forecasts to 2030 (US$ Mn)
10.1.6.2.1 Canada Power Electronics Market Breakdown by Type
10.1.6.2.2 Canada Power Electronics Market Breakdown by Material
10.1.6.2.3 Canada Power Electronics Market Breakdown by Industry Vertical
10.1.6.3 Mexico Power Electronics Market Revenue and Forecasts to 2030 (US$ Mn)
10.1.6.3.1 Mexico Power Electronics Market Breakdown by Type
10.1.6.3.2 Mexico Power Electronics Market Breakdown by Material
10.1.6.3.3 Mexico Power Electronics Market Breakdown by Industry Vertical
10.2 Europe
10.2.1 Europe Power Electronics Market Overview
10.2.2 Europe Power Electronics Market Revenue and Forecasts to 2030 (US$ Mn)
10.2.3 Europe Power Electronics Market Breakdown by Type
10.2.3.1 Europe Power Electronics Market Revenue and Forecasts and Analysis - By Type
10.2.4 Europe Power Electronics Market Breakdown by Material
10.2.4.1 Europe Power Electronics Market Revenue and Forecasts and Analysis - By Material
10.2.5 Europe Power Electronics Market Breakdown by Industry Vertical
10.2.5.1 Europe Power Electronics Market Revenue and Forecasts and Analysis - By Industry Vertical
10.2.6 Europe Power Electronics Market Revenue and Forecasts and Analysis - By Countries
10.2.6.1 Germany Power Electronics Market Revenue and Forecasts to 2030 (US$ Mn)
10.2.6.1.1 Germany Power Electronics Market Breakdown by Type
10.2.6.1.2 Germany Power Electronics Market Breakdown by Material
10.2.6.1.3 Germany Power Electronics Market Breakdown by Industry Vertical
10.2.6.2 France Power Electronics Market Revenue and Forecasts to 2030 (US$ Mn)
10.2.6.2.1 France Power Electronics Market Breakdown by Type
10.2.6.2.2 France Power Electronics Market Breakdown by Material
10.2.6.2.3 France Power Electronics Market Breakdown by Industry Vertical
10.2.6.3 Italy Power Electronics Market Revenue and Forecasts to 2030 (US$ Mn)
10.2.6.3.1 Italy Power Electronics Market Breakdown by Type
10.2.6.3.2 Italy Power Electronics Market Breakdown by Material
10.2.6.3.3 Italy Power Electronics Market Breakdown by Industry Vertical
10.2.6.4 UK Power Electronics Market Revenue and Forecasts to 2030 (US$ Mn)
10.2.6.4.1 UK Power Electronics Market Breakdown by Type
10.2.6.4.2 UK Power Electronics Market Breakdown by Material
10.2.6.4.3 UK Power Electronics Market Breakdown by Industry Vertical
10.2.6.5 Russia Power Electronics Market Revenue and Forecasts to 2030 (US$ Mn)
10.2.6.5.1 Russia Power Electronics Market Breakdown by Type
10.2.6.5.2 Russia Power Electronics Market Breakdown by Material
10.2.6.5.3 Russia Power Electronics Market Breakdown by Industry Vertical
10.2.6.6 Rest of Europe Power Electronics Market Revenue and Forecasts to 2030 (US$ Mn)
10.2.6.6.1 Rest of Europe Power Electronics Market Breakdown by Type
10.2.6.6.2 Rest of Europe Power Electronics Market Breakdown by Material
10.2.6.6.3 Rest of Europe Power Electronics Market Breakdown by Industry Vertical
10.3 Asia Pacific Power Electronics Market
10.3.1 Overview
10.3.2 Asia Pacific Power Electronics Market Revenue and Forecasts To 2030 (US$ Million)
10.3.3 Asia Pacific Power Electronics Market Breakdown by Type
10.3.3.1 Asia Pacific Power Electronics Market Revenue and Forecasts and Analysis - By Type
10.3.4 Asia Pacific Power Electronics Market Breakdown by Material
10.3.4.1 Asia Pacific Power Electronics Market Revenue and Forecasts and Analysis - By Material
10.3.5 Asia Pacific Power Electronics Market Breakdown by Industry Vertical
10.3.5.1 Asia Pacific Power Electronics Market Revenue and Forecasts and Analysis - By Industry Vertical
10.3.6 Power Electronics Market Breakdown by Countries
10.3.6.1 Australia Power Electronics Market Revenue and Forecasts to 2030 (US$ Mn)
10.3.6.1.1 Australia Power Electronics Market Breakdown by Type
10.3.6.1.2 Australia Power Electronics Market Breakdown by Material
10.3.6.1.3 Australia Power Electronics Market Breakdown by Industry Vertical
10.3.6.2 China Power Electronics Market Revenue and Forecasts to 2030 (US$ Mn)
10.3.6.2.1 China Power Electronics Market Breakdown by Type
10.3.6.2.2 China Power Electronics Market Breakdown by Material
10.3.6.2.3 China Power Electronics Market Breakdown by Industry Vertical
10.3.6.3 Japan Power Electronics Market Revenue and Forecasts to 2030 (US$ Mn)
10.3.6.3.1 Japan Power Electronics Market Breakdown by Type
10.3.6.3.2 Japan Power Electronics Market Breakdown by Material
10.3.6.3.3 Japan Power Electronics Market Breakdown by Industry Vertical
10.3.6.4 India Power Electronics Market Revenue and Forecasts to 2030 (US$ Mn)
10.3.6.4.1 India Power Electronics Market Breakdown by Type
10.3.6.4.2 India Power Electronics Market Breakdown by Material
10.3.6.4.3 India Power Electronics Market Breakdown by Industry Vertical
10.3.6.5 South Korea Power Electronics Market Revenue and Forecasts to 2030 (US$ Mn)
10.3.6.5.1 South Korea Power Electronics Market Breakdown by Type
10.3.6.5.2 South Korea Power Electronics Market Breakdown by Material
10.3.6.5.3 South Korea Power Electronics Market Breakdown by Industry Vertical
10.3.6.6 Rest of Asia Pacific Power Electronics Market Revenue and Forecasts to 2030 (US$ Mn)
10.3.6.6.1 Rest of Asia Pacific Power Electronics Market Breakdown by Type
10.3.6.6.2 Rest of Asia Pacific Power Electronics Market Breakdown by Material
10.3.6.6.3 Rest of Asia Pacific Power Electronics Market Breakdown by Industry Vertical
10.4 Middle East & Africa
10.4.1 Middle East & Africa Power Electronics Market Overview
10.4.2 Middle East & Africa Power Electronics Market Revenue and Forecasts to 2030 (US$ Million)
10.4.3 Middle East & Africa Power Electronics Market Breakdown by Type
10.4.3.1 Middle East & Africa Power Electronics Market and Forecasts and Analysis - By Type
10.4.4 Middle East & Africa Power Electronics Market Breakdown by Material
10.4.4.1 Middle East & Africa Power Electronics Market and Forecasts and Analysis - By Material
10.4.5 Middle East & Africa Power Electronics Market Breakdown by Industry Vertical
10.4.5.1 Middle East & Africa Power Electronics Market and Forecasts and Analysis - By Industry Vertical
10.4.6 Middle East & Africa Power Electronics Market Revenue and Forecasts and Analysis - By Countries
10.4.6.1 South Africa Power Electronics Market Revenue and Forecasts to 2030 (US$ Mn)
10.4.6.1.1 South Africa Power Electronics Market Breakdown by Type
10.4.6.1.2 South Africa Power Electronics Market Breakdown by Material
10.4.6.1.3 South Africa Power Electronics Market Breakdown by Industry Vertical
10.4.6.2 Saudi Arabia Power Electronics Market Revenue and Forecasts to 2030 (US$ Mn)
10.4.6.2.1 Saudi Arabia Power Electronics Market Breakdown by Type
10.4.6.2.2 Saudi Arabia Power Electronics Market Breakdown by Material
10.4.6.2.3 Saudi Arabia Power Electronics Market Breakdown by Industry Vertical
10.4.6.3 UAE Power Electronics Market Revenue and Forecasts to 2030 (US$ Mn)
10.4.6.3.1 UAE Power Electronics Market Breakdown by Type
10.4.6.3.2 UAE Power Electronics Market Breakdown by Material
10.4.6.3.3 UAE Power Electronics Market Breakdown by Industry Vertical
10.4.6.4 Rest of Middle East & Africa Power Electronics Market Revenue and Forecasts to 2030 (US$ Mn)
10.4.6.4.1 Rest of Middle East & Africa Power Electronics Market Breakdown by Type
10.4.6.4.2 Rest of Middle East & Africa Power Electronics Market Breakdown by Material
10.4.6.4.3 Rest of Middle East & Africa Power Electronics Market Breakdown by Industry Vertical
10.5 South & Central America
10.5.1 South & Central America Power Electronics Market Overview
10.5.2 South & Central America Power Electronics Market Revenue and Forecasts to 2030 (US$ Million)
10.5.3 South & Central America Power Electronics Market Breakdown by Type
10.5.3.1 South & Central America Power Electronics Market and Forecasts and Analysis - By Type
10.5.4 South & Central America Power Electronics Market Breakdown by Material
10.5.4.1 South & Central America Power Electronics Market and Forecasts and Analysis - By Material
10.5.5 South & Central America Power Electronics Market Breakdown by Industry Vertical
10.5.5.1 South & Central America Power Electronics Market Revenue and Forecasts and Analysis - By Industry Vertical
10.5.6 South & Central America Power Electronics Market Revenue and Forecasts and Analysis - By Countries
10.5.6.1 Brazil Power Electronics Market Revenue and Forecasts to 2030 (US$ Mn)
10.5.6.1.1 Brazil Power Electronics Market Breakdown by Type
10.5.6.1.2 Brazil Power Electronics Market Breakdown by Material
10.5.6.1.3 Brazil Power Electronics Market Breakdown by Industry Vertical
10.5.6.2 Argentina Power Electronics Market Revenue and Forecasts to 2030 (US$ Mn)
10.5.6.2.1 Argentina Power Electronics Market Breakdown by Type
10.5.6.2.2 Argentina Power Electronics Market Breakdown by Material
10.5.6.2.3 Argentina Power Electronics Market Breakdown by Industry Vertical
10.5.6.3 Rest of South & Central America Power Electronics Market Revenue and Forecasts to 2030 (US$ Mn)
10.5.6.3.1 Rest of South & Central America Power Electronics Market Breakdown by Type
10.5.6.3.2 Rest of South & Central America Power Electronics Market Breakdown by Material
10.5.6.3.3 Rest of South & Central America Power Electronics Market Breakdown by Industry Vertical
11. Power Electronics Market – Impact of COVID-19 Pandemic
11.1 Pre & Post Covid-19 Impact
12. Competitive Landscape
12.1 Heat Map Analysis By Key Players
12.2 Company Positioning & Concentration
13. Industry Landscape
13.1 Overview
13.2 Market Initiative
13.3 New Product Development
13.4 Merger and Acquisition
14. Company Profiles
14.1 Infineon Technologies AG
14.1.1 Key Facts
14.1.2 Business Description
14.1.3 Products and Services
14.1.4 Financial Overview
14.1.5 SWOT Analysis
14.1.6 Key Developments
14.2 Semiconductor Components Industries, L.L.C. (On Semiconductor)
14.2.1 Key Facts
14.2.2 Business Description
14.2.3 Products and Services
14.2.4 Financial Overview
14.2.5 SWOT Analysis
14.2.6 Key Developments
14.3 STMicroelectronics NV
14.3.1 Key Facts
14.3.2 Business Description
14.3.3 Products and Services
14.3.4 Financial Overview
14.3.5 SWOT Analysis
14.3.6 Key Developments
14.4 Mitsubishi Electric Corp
14.4.1 Key Facts
14.4.2 Business Description
14.4.3 Products and Services
14.4.4 Financial Overview
14.4.5 SWOT Analysis
14.4.6 Key Developments
14.5 Fuji Electric Co Ltd
14.5.1 Key Facts
14.5.2 Business Description
14.5.3 Products and Services
14.5.4 Financial Overview
14.5.5 SWOT Analysis
14.5.6 Key Developments
14.6 ROHM Co Ltd
14.6.1 Key Facts
14.6.2 Business Description
14.6.3 Products and Services
14.6.4 Financial Overview
14.6.5 SWOT Analysis
14.6.6 Key Developments
14.7 Renesas Electronics Corp
14.7.1 Key Facts
14.7.2 Business Description
14.7.3 Products and Services
14.7.4 Financial Overview
14.7.5 SWOT Analysis
14.7.6 Key Developments
14.8 Littelfuse, Inc
14.8.1 Key Facts
14.8.2 Business Description
14.8.3 Products and Services
14.8.4 Financial Overview
14.8.5 SWOT Analysis
14.8.6 Key Developments
14.9 Toshiba Electronic Devices & Storage Corp
14.9.1 Key Facts
14.9.2 Business Description
14.9.3 Products and Services
14.9.4 Financial Overview
14.9.5 SWOT Analysis
14.9.6 Key Developments
14.10 Vishay Intertechnology Inc
14.10.1 Key Facts
14.10.2 Business Description
14.10.3 Products and Services
14.10.4 Financial Overview
14.10.5 SWOT Analysis
14.10.6 Key Developments
15. Appendix
15.1 Word Index
List of Tables
Table 1. Power Electronics Market Segmentation
Table 2. Power Electronics Market Revenue and Forecasts To 2030 (US$ Million)
Table 3. Power Electronics Market Revenue and Forecasts To 2030 (US$ Million) – Type
Table 4. Power Electronics Market Revenue and Forecasts To 2030 (US$ Million) – Material
Table 5. Power Electronics Market Revenue and Forecasts To 2030 (US$ Million) – Industry Vertical
Table 6. North America Power Electronics Market Revenue and Forecasts To 2030 (US$ Mn) – By Type
Table 7. North America Power Electronics Market Revenue and Forecasts To 2030 (US$ Mn) – By Material
Table 8. North America Power Electronics Market Revenue and Forecasts To 2030 (US$ Mn) – By Industry Vertical
Table 9. North America Power Electronics Market, by Country – Revenue and Forecast to 2030 (USD Million)
Table 10. US Power Electronics Market Revenue and Forecasts To 2030 (US$ Mn) – By Type
Table 11. US Power Electronics Market Revenue and Forecasts To 2030 (US$ Mn) – By Material
Table 12. US Power Electronics Market Revenue and Forecasts To 2030 (US$ Mn) – By Industry Vertical
Table 13. Canada Power Electronics Market Revenue and Forecasts To 2030 (US$ Mn) – By Type
Table 14. Canada Power Electronics Market Revenue and Forecasts To 2030 (US$ Mn) – By Material
Table 15. Canada Power Electronics Market Revenue and Forecasts To 2030 (US$ Mn) – By Industry Vertical
Table 16. Mexico Power Electronics Market Revenue and Forecasts To 2030 (US$ Mn) – By Type
Table 17. Mexico Power Electronics Market Revenue and Forecasts To 2030 (US$ Mn) – By Material
Table 18. Mexico Power Electronics Market Revenue and Forecasts To 2030 (US$ Mn) – By Industry Vertical
Table 19. Europe Power Electronics Market Revenue and Forecasts To 2030 (US$ Mn) – By Type
Table 20. Europe Power Electronics Market Revenue and Forecasts To 2030 (US$ Mn) – By Material
Table 21. Europe Power Electronics Market Revenue and Forecasts To 2030 (US$ Mn) – By Industry Vertical
Table 22. Europe Power Electronics Market, by Country – Revenue and Forecast to 2030 (USD Million)
Table 23. Germany Power Electronics Market Revenue and Forecasts To 2030 (US$ Mn) – By Type
Table 24. Germany Power Electronics Market Revenue and Forecasts To 2030 (US$ Mn) – By Material
Table 25. Germany Power Electronics Market Revenue and Forecasts To 2030 (US$ Mn) – By Industry Vertical
Table 26. France Power Electronics Market Revenue and Forecasts To 2030 (US$ Mn) – By Type
Table 27. France Power Electronics Market Revenue and Forecasts To 2030 (US$ Mn) – By Material
Table 28. France Power Electronics Market Revenue and Forecasts To 2030 (US$ Mn) – By Industry Vertical
Table 29. Italy Power Electronics Market Revenue and Forecasts To 2030 (US$ Mn) – By Type
Table 30. Italy Power Electronics Market Revenue and Forecasts To 2030 (US$ Mn) – By Material
Table 31. Italy Power Electronics Market Revenue and Forecasts To 2030 (US$ Mn) – By Industry Vertical
Table 32. UK Power Electronics Market Revenue and Forecasts To 2030 (US$ Mn) – By Type
Table 33. UK Power Electronics Market Revenue and Forecasts To 2030 (US$ Mn) – By Material
Table 34. UK Power Electronics Market Revenue and Forecasts To 2030 (US$ Mn) – By Industry Vertical
Table 35. Russia Power Electronics Market Revenue and Forecasts To 2030 (US$ Mn) – By Type
Table 36. Russia Power Electronics Market Revenue and Forecasts To 2030 (US$ Mn) – By Material
Table 37. Russia Power Electronics Market Revenue and Forecasts To 2030 (US$ Mn) – By Industry Vertical
Table 38. Rest of Europe Power Electronics Market Revenue and Forecasts To 2030 (US$ Mn) – By Type
Table 39. Rest of Europe Power Electronics Market Revenue and Forecasts To 2030 (US$ Mn) – By Material
Table 40. Rest of Europe Power Electronics Market Revenue and Forecasts To 2030 (US$ Mn) – By Industry Vertical
Table 41. Asia Pacific Power Electronics Market Revenue And Forecasts To 2030 (US$ Million) – Type
Table 42. Asia Pacific Power Electronics Market Revenue And Forecasts To 2030 (US$ Million) – Material
Table 43. Asia Pacific Power Electronics Market Revenue And Forecasts To 2030 (US$ Million) – Industry Vertical
Table 44. Asia Pacific Power Electronics Market, by Country – Revenue and Forecast to 2030 (USD Million)
Table 45. Australia Power Electronics Market Revenue and Forecasts To 2030 (US$ Mn) – By Type
Table 46. Australia Power Electronics Market Revenue and Forecasts To 2030 (US$ Mn) – By Material
Table 47. Australia Power Electronics Market Revenue and Forecasts To 2030 (US$ Mn) – By Industry Vertical
Table 48. China Power Electronics Market Revenue and Forecasts To 2030 (US$ Mn) – By Type
Table 49. China Power Electronics Market Revenue and Forecasts To 2030 (US$ Mn) – By Material
Table 50. China Power Electronics Market Revenue and Forecasts To 2030 (US$ Mn) – By Industry Vertical
Table 51. Japan Power Electronics Market Revenue and Forecasts To 2030 (US$ Mn) – By Type
Table 52. Japan Power Electronics Market Revenue and Forecasts To 2030 (US$ Mn) – By Material
Table 53. Japan Power Electronics Market Revenue and Forecasts To 2030 (US$ Mn) – By Industry Vertical
Table 54. India Power Electronics Market Revenue and Forecasts To 2030 (US$ Mn) – By Type
Table 55. India Power Electronics Market Revenue and Forecasts To 2030 (US$ Mn) – By Material
Table 56. India Power Electronics Market Revenue and Forecasts To 2030 (US$ Mn) – By Industry Vertical
Table 57. South Korea Power Electronics Market Revenue and Forecasts To 2030 (US$ Mn) – By Type
Table 58. South Korea Power Electronics Market Revenue and Forecasts To 2030 (US$ Mn) – By Material
Table 59. South Korea Power Electronics Market Revenue and Forecasts To 2030 (US$ Mn) – By Industry Vertical
Table 60. Rest of Asia Pacific Power Electronics Market Revenue and Forecasts To 2030 (US$ Mn) – By Type
Table 61. Rest of Asia Pacific Power Electronics Market Revenue and Forecasts To 2030 (US$ Mn) – By Material
Table 62. Rest of Asia Pacific Power Electronics Market Revenue and Forecasts To 2030 (US$ Mn) – By Industry Vertical
Table 63. Middle East & Africa Power Electronics Market Revenue and Forecasts To 2030 (US$ Million) – By Type
Table 64. Middle East & Africa Power Electronics Market Revenue and Forecasts To 2030 (US$ Million) – By Material
Table 65. Middle East & Africa Power Electronics Market Revenue and Forecasts To 2030 (US$ Million) – By Industry Vertical
Table 66. Middle East and Africa Power Electronics Market, by Country – Revenue and Forecast to 2030 (USD Million)
Table 67. South Africa Power Electronics Market Revenue and Forecasts To 2030 (US$ Mn) – By Type
Table 68. South Africa Power Electronics Market Revenue and Forecasts To 2030 (US$ Mn) – By Material
Table 69. South Africa Power Electronics Market Revenue and Forecasts To 2030 (US$ Mn) – By Industry Vertical
Table 70. Saudi Arabia Power Electronics Market Revenue and Forecasts To 2030 (US$ Mn) – By Type
Table 71. Saudi Arabia Power Electronics Market Revenue and Forecasts To 2030 (US$ Mn) – By Material
Table 72. Saudi Arabia Power Electronics Market Revenue and Forecasts To 2030 (US$ Mn) – By Industry Vertical
Table 73. UAE Power Electronics Market Revenue and Forecasts To 2030 (US$ Mn) – By Type
Table 74. UAE Power Electronics Market Revenue and Forecasts To 2030 (US$ Mn) – By Material
Table 75. UAE Power Electronics Market Revenue and Forecasts To 2030 (US$ Mn) – By Industry Vertical
Table 76. Rest of Middle East & Africa Power Electronics Market Revenue and Forecasts To 2030 (US$ Mn) – By Type
Table 77. Rest of Middle East & Africa Power Electronics Market Revenue and Forecasts To 2030 (US$ Mn) – By Material
Table 78. Rest of Middle East & Africa Power Electronics Market Revenue and Forecasts To 2030 (US$ Mn) – By Industry Vertical
Table 79. South & Central America Power Electronics Market Revenue and Forecasts To 2030 (US$ Million) – By Type
Table 80. South & Central America Power Electronics Market Revenue and Forecasts To 2030 (US$ Million) – By Material
Table 81. South & Central America Power Electronics Market Revenue and Forecasts To 2030 (US$ Million) – By Industry Vertical
Table 82. South and Central America Power Electronics Market, by Country – Revenue and Forecast to 2030 (USD Million)
Table 83. Brazil Power Electronics Market Revenue and Forecasts To 2030 (US$ Mn) – By Type
Table 84. Brazil Power Electronics Market Revenue and Forecasts To 2030 (US$ Mn) – By Material
Table 85. Brazil Power Electronics Market Revenue and Forecasts To 2030 (US$ Mn) – By Industry Vertical
Table 86. Argentina Power Electronics Market Revenue and Forecasts To 2030 (US$ Mn) – By Type
Table 87. Argentina Power Electronics Market Revenue and Forecasts To 2030 (US$ Mn) – By Material
Table 88. Argentina Power Electronics Market Revenue and Forecasts To 2030 (US$ Mn) – By Industry Vertical
Table 89. Rest of South & Central America Power Electronics Market Revenue and Forecasts To 2030 (US$ Mn) – By Type
Table 90. Rest of South & Central America Power Electronics Market Revenue and Forecasts To 2030 (US$ Mn) – By Material
Table 91. Rest of South & Central America Power Electronics Market Revenue and Forecasts To 2030 (US$ Mn) – By Industry Vertical
Table 92. Company Positioning & Concentration
Table 93. List of Abbreviation
List of Figures
Figure 1. Power Electronics Market Segmentation, By Geography
Figure 2. Global– PEST Analysis
Figure 3. Ecosystem: Power Electronics Market
Figure 4. Power Electronics Market - Key Industry Dynamics
Figure 5. Impact Analysis of Drivers and Restraints
Figure 6. Power Electronics Market Breakdown by Geography, 2022 and 2030 (%)
Figure 7. Power Electronics Market Revenue (US$ Million), 2022 & 2030
Figure 8. Power Electronics Market Share (%) – Type, 2022 and 2030
Figure 9. Power Discrete Market Revenue and Forecasts To 2030 (US$ Million)
Figure 10. Power Module Market Revenue and Forecasts To 2030 (US$ Million)
Figure 11. Power IC Market Revenue and Forecasts To 2030 (US$ Million)
Figure 12. Power Electronics Market Share (%) – Material, 2022 and 2030
Figure 13. Silicon (SI) Market Revenue and Forecasts To 2030 (US$ Million)
Figure 14. Silicon Carbide (SIC) Market Revenue and Forecasts To 2030 (US$ Million)
Figure 15. Gallium Nitride (GAN) Market Revenue and Forecasts To 2030 (US$ Million)
Figure 16. Others Market Revenue and Forecasts To 2030 (US$ Million)
Figure 17. Power Electronics Market Share (%) – Industry Vertical, 2022 and 2030
Figure 18. ICT Market Revenue and Forecasts To 2030 (US$ Million)
Figure 19. Automotive and Transportation Market Revenue and Forecasts To 2030 (US$ Million)
Figure 20. Consumer Electronics Market Revenue and Forecasts To 2030 (US$ Million)
Figure 21. Industrial Market Revenue and Forecasts To 2030 (US$ Million)
Figure 22. Energy and Power Market Revenue and Forecasts To 2030 (US$ Million)
Figure 23. Others Market Revenue and Forecasts To 2030 (US$ Million)
Figure 24. Power Electronics Market Revenue Share, By Region (2022 & 2030)
Figure 25. Power Electronics Market Revenue and Forecasts To 2030 (US$ Mn)
Figure 26. Power Electronics Market Breakdown by Type (2022 and 2030)
Figure 27. Power Electronics Market Breakdown by Material (2022 and 2030)
Figure 28. Power Electronics Market Breakdown by Industry Vertical, 2022 and 2030 (%)
Figure 29. Power Electronics Market Breakdown by Key Countries, 2022 and 2030 (%)
Figure 30. US Power Electronics Market Revenue and Forecasts To 2030 (US$ Mn)
Figure 31. Canada Power Electronics Market Revenue and Forecasts To 2030 (US$ Mn)
Figure 32. Mexico Power Electronics Market Revenue and Forecasts To 2030 (US$ Mn)
Figure 33. Power Electronics Market Revenue and Forecasts To 2030 (US$ Mn)
Figure 34. Power Electronics Market Breakdown by Type (2022 and 2030)
Figure 35. Power Electronics Market Breakdown by Material (2022 and 2030)
Figure 36. Power Electronics Market Breakdown by Industry Vertical (2022 and 2030)
Figure 37. Power Electronics Market Breakdown by Key Countries, 2022 and 2030 (%)
Figure 38. Germany Power Electronics Market Revenue and Forecasts To 2030 (US$ Mn)
Figure 39. France Power Electronics Market Revenue and Forecasts To 2030 (US$ Mn)
Figure 40. Italy Power Electronics Market Revenue and Forecasts To 2030 (US$ Mn)
Figure 41. UK Power Electronics Market Revenue and Forecasts To 2030 (US$ Mn)
Figure 42. Russia Power Electronics Market Revenue and Forecasts To 2030 (US$ Mn)
Figure 43. Rest of Europe Power Electronics Market Revenue and Forecasts To 2030 (US$ Mn)
Figure 44. Asia Pacific Power Electronics Market Revenue And Forecasts To 2030 (US$ Million)
Figure 45. Asia Pacific Power Electronics Market Breakdown by Type (2022 and 2023)
Figure 46. Asia Pacific Power Electronics Market Breakdown by Material (2022 and 2023)
Figure 47. Asia Pacific Power Electronics Market Breakdown by Industry Vertical (2022 and 2023)
Figure 48. Asia Pacific Power Electronics Market Breakdown By Key Countries, 2022 And 2030 (%)
Figure 49. Australia Power Electronics Market Revenue and Forecasts To 2030 (US$ Mn)
Figure 50. China Power Electronics Market Revenue and Forecasts To 2030 (US$ Mn)
Figure 51. Japan Power Electronics Market Revenue and Forecasts To 2030 (US$ Mn)
Figure 52. India Power Electronics Market Revenue and Forecasts To 2030 (US$ Mn)
Figure 53. South Korea Power Electronics Market Revenue and Forecasts To 2030 (US$ Mn)
Figure 54. Rest of Asia Pacific Power Electronics Market Revenue and Forecasts To 2030 (US$ Mn)
Figure 55. Power Electronics Market Revenue and Forecasts To 2030 (US$ Million)
Figure 56. Middle East & Africa Power Electronics Market Breakdown by Type (2022 and 2023)
Figure 57. Middle East & Africa Power Electronics Market Breakdown by Material (2022 and 2023)
Figure 58. Middle East & Africa Power Electronics Market Breakdown by Industry Vertical (2022 and 2023)
Figure 59. Power Electronics Market Breakdown by Key Countries, 2022 and 2030 (%)
Figure 60. South Africa Power Electronics Market Revenue and Forecasts To 2030 (US$ Mn)
Figure 61. Saudi Arabia Power Electronics Market Revenue and Forecasts To 2030 (US$ Mn)
Figure 62. UAE Power Electronics Market Revenue and Forecasts To 2030 (US$ Mn)
Figure 63. Rest of Middle East & Africa Power Electronics Market Revenue and Forecasts To 2030 (US$ Mn)
Figure 64. Power Electronics Market Revenue and Forecasts To 2030 (US$ Million)
Figure 65. South & Central America Power Electronics Market Breakdown by Type (2022 and 2023)
Figure 66. South & Central America Power Electronics Market Breakdown by Material (2022 and 2023)
Figure 67. South & Central America Power Electronics Market Breakdown by Industry Vertical (2022 and 2023)
Figure 68. Power Electronics Market Breakdown by Key Countries, 2022 and 2030 (%)
Figure 69. Brazil Power Electronics Market Revenue and Forecasts To 2030 (US$ Mn)
Figure 70. Argentina Power Electronics Market Revenue and Forecasts To 2030 (US$ Mn)
Figure 71. Rest of South & Central America Power Electronics Market Revenue and Forecasts To 2030 (US$ Mn)
Figure 72. Heat Map Analysis By Key Players
The List of Companies - Power Electronics Market
- Infineon Technologies AG
- Semiconductor Components Industries, L.L.C. (On Semiconductor)
- STMicroelectronics NV
- Mitsubishi Electric Corp
- Fuji Electric Co Ltd
- ROHM Co Ltd
- Renesas Electronics Corp
- Littelfuse, Inc
- Toshiba Electronic Devices & Storage Corp
- Vishay Intertechnology Inc
The Insight Partners performs research in 4 major stages: Data Collection & Secondary Research, Primary Research, Data Analysis and Data Triangulation & Final Review.
- Data Collection and Secondary Research:
As a market research and consulting firm operating from a decade, we have published many reports and advised several clients across the globe. First step for any study will start with an assessment of currently available data and insights from existing reports. Further, historical and current market information is collected from Investor Presentations, Annual Reports, SEC Filings, etc., and other information related to company’s performance and market positioning are gathered from Paid Databases (Factiva, Hoovers, and Reuters) and various other publications available in public domain.
Several associations trade associates, technical forums, institutes, societies and organizations are accessed to gain technical as well as market related insights through their publications such as research papers, blogs and press releases related to the studies are referred to get cues about the market. Further, white papers, journals, magazines, and other news articles published in the last 3 years are scrutinized and analyzed to understand the current market trends.
- Primary Research:
The primarily interview analysis comprise of data obtained from industry participants interview and answers to survey questions gathered by in-house primary team.
For primary research, interviews are conducted with industry experts/CEOs/Marketing Managers/Sales Managers/VPs/Subject Matter Experts from both demand and supply side to get a 360-degree view of the market. The primary team conducts several interviews based on the complexity of the markets to understand the various market trends and dynamics which makes research more credible and precise.
A typical research interview fulfils the following functions:
- Provides first-hand information on the market size, market trends, growth trends, competitive landscape, and outlook
- Validates and strengthens in-house secondary research findings
- Develops the analysis team’s expertise and market understanding
Primary research involves email interactions and telephone interviews for each market, category, segment, and sub-segment across geographies. The participants who typically take part in such a process include, but are not limited to:
- Industry participants: VPs, business development managers, market intelligence managers and national sales managers
- Outside experts: Valuation experts, research analysts and key opinion leaders specializing in the electronics and semiconductor industry.
Below is the breakup of our primary respondents by company, designation, and region:

Once we receive the confirmation from primary research sources or primary respondents, we finalize the base year market estimation and forecast the data as per the macroeconomic and microeconomic factors assessed during data collection.
- Data Analysis:
Once data is validated through both secondary as well as primary respondents, we finalize the market estimations by hypothesis formulation and factor analysis at regional and country level.
- 3.1 Macro-Economic Factor Analysis:
We analyse macroeconomic indicators such the gross domestic product (GDP), increase in the demand for goods and services across industries, technological advancement, regional economic growth, governmental policies, the influence of COVID-19, PEST analysis, and other aspects. This analysis aids in setting benchmarks for various nations/regions and approximating market splits. Additionally, the general trend of the aforementioned components aid in determining the market's development possibilities.
- 3.2 Country Level Data:
Various factors that are especially aligned to the country are taken into account to determine the market size for a certain area and country, including the presence of vendors, such as headquarters and offices, the country's GDP, demand patterns, and industry growth. To comprehend the market dynamics for the nation, a number of growth variables, inhibitors, application areas, and current market trends are researched. The aforementioned elements aid in determining the country's overall market's growth potential.
- 3.3 Company Profile:
The “Table of Contents” is formulated by listing and analyzing more than 25 - 30 companies operating in the market ecosystem across geographies. However, we profile only 10 companies as a standard practice in our syndicate reports. These 10 companies comprise leading, emerging, and regional players. Nonetheless, our analysis is not restricted to the 10 listed companies, we also analyze other companies present in the market to develop a holistic view and understand the prevailing trends. The “Company Profiles” section in the report covers key facts, business description, products & services, financial information, SWOT analysis, and key developments. The financial information presented is extracted from the annual reports and official documents of the publicly listed companies. Upon collecting the information for the sections of respective companies, we verify them via various primary sources and then compile the data in respective company profiles. The company level information helps us in deriving the base number as well as in forecasting the market size.
- 3.4 Developing Base Number:
Aggregation of sales statistics (2020-2022) and macro-economic factor, and other secondary and primary research insights are utilized to arrive at base number and related market shares for 2022. The data gaps are identified in this step and relevant market data is analyzed, collected from paid primary interviews or databases. On finalizing the base year market size, forecasts are developed on the basis of macro-economic, industry and market growth factors and company level analysis.
- Data Triangulation and Final Review:
The market findings and base year market size calculations are validated from supply as well as demand side. Demand side validations are based on macro-economic factor analysis and benchmarks for respective regions and countries. In case of supply side validations, revenues of major companies are estimated (in case not available) based on industry benchmark, approximate number of employees, product portfolio, and primary interviews revenues are gathered. Further revenue from target product/service segment is assessed to avoid overshooting of market statistics. In case of heavy deviations between supply and demand side values, all thes steps are repeated to achieve synchronization.
We follow an iterative model, wherein we share our research findings with Subject Matter Experts (SME’s) and Key Opinion Leaders (KOLs) until consensus view of the market is not formulated – this model negates any drastic deviation in the opinions of experts. Only validated and universally acceptable research findings are quoted in our reports.
We have important check points that we use to validate our research findings – which we call – data triangulation, where we validate the information, we generate from secondary sources with primary interviews and then we re-validate with our internal data bases and Subject matter experts. This comprehensive model enables us to deliver high quality, reliable data in shortest possible time.
 Get Free Sample For