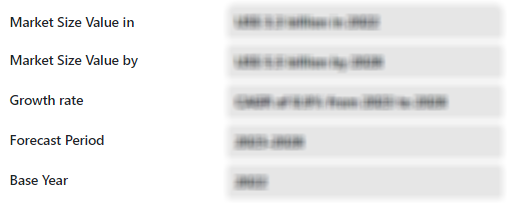
The Pressure Sensitive Labels Market is expected to register a CAGR of 4.9% from 2025 to 2031, with a market size expanding from US$ XX million in 2024 to US$ XX Million by 2031.
The report is segmented by facestock material (paper, polyethylene, polypropylene polyethylene terephthalate, polyvinyl chloride, and others). The report is segmented by adhesive type (solvent-based, water-based, and others). The report further presents an analysis based on the application (food and beverage, food and beverage, pharmaceuticals, cosmetics and personal care, household products, chemicals, and others). The report scope covers five regions: North America, Europe, Asia Pacific, Middle East and Africa, and South and Central America and key countries under each region. The global analysis is further broken down at the regional level and major countries. The Report Offers the Value in USD for the above analysis and segments.
Purpose of the ReportThe report Pressure Sensitive Labels Market by The Insight Partners aims to describe the present landscape and future growth, top driving factors, challenges, and opportunities. This will provide insights to various business stakeholders, such as:
- Technology Providers/Manufacturers: To understand the evolving market dynamics and know the potential growth opportunities, enabling them to make informed strategic decisions.
- Investors: To conduct a comprehensive trend analysis regarding the market growth rate, market financial projections, and opportunities that exist across the value chain.
- Regulatory bodies: To regulate policies and police activities in the market with the aim of minimizing abuse, preserving investor trust and confidence, and upholding the integrity and stability of the market.
Pressure Sensitive Labels Market Segmentation
Facestock Material- Paper
- Polyethylene
- Polypropylene Polyethylene Terephthalate
- Polyvinyl Chloride
- Solvent-Based
- Water-Based
- Food and Beverage
- Food and Beverage
- Pharmaceuticals
- Cosmetics and Personal Care
- Household Products
- Chemicals
- North America
- Europe
- Asia-Pacific
- South and Central America
- Middle East and Africa
Strategic Insights
Pressure Sensitive Labels Market Growth Drivers- Surge in E-commerce Demand: This growth in e-commerce and online retailing has rapidly increased the demand for pressure-sensitive labels. Because companies are selling their products more and more through online media, the demand for packaging that is easy to apply, cost-effective, and that can withstand shipping conditions is increasing. Pressure-sensitive labels are in huge demand in the market because they are mainly used in the identification of the product, promotion of brands, and shipping. It is, therefore, an essential product in the supply chain of the e-commerce industry. Pressure-sensitive labels should, therefore, continue seeing increasing demand fueled by a continued surge in online shopping.
- Customization in Packaging and Labeling: With companies looking to differentiate their products from competitors in a competitive marketplace, the demand for customizable packaging and labeling has skyrocketed. Pressure-sensitive labels are the best fit as they are adaptable to design, size, and functionality. These pressure-sensitive labels provide branding, promotional messages, barcoding, and compliance information on product packaging. Their ability to be easily customized for a wide variety of industries—including food and beverages, cosmetics, and pharmaceuticals—is a significant factor driving the market.
- Technological Advancements: Innovations in materials, adhesives, and printing techniques have dramatically improved the performance and attractiveness of pressure-sensitive labels. New materials with better durability and improved temperature, UV exposure, and moisture resistance have opened further applications for pressure-sensitive labels. The advent of digital printing also made it possible to print high-quality, customized labels in shorter runs at lower cost. Technological advancements, such as the flexibility and cost-effectiveness of pressure-sensitive labels, have reinforced market growth.
- Shift Toward Sustainable and Eco-friendly Labels: Shift toward sustainable and eco-friendly pressure-sensitive labels, which is largely because of the increasing environmental awareness. Manufacturers are more interested in producing labels containing biodegradable adhesives, recyclable or compostable materials, and inks. It is because of the preferences of consumers who prefer products with environmentally responsible qualities and the increasing regulatory requirements of packaging to be more sustainable. Industries such as food and beverages, cosmetics, and personal care are using recycled content or plant-based materials to manufacture pressure-sensitive labels.
- Integration of Smart Technologies (RFID and NFC): Radio Frequency Identification (RFID) and Near Field Communication (NFC) smart technologies are integrated into pressure-sensitive labels. Smarter labels have more features like product tracking, inventory management, and authentication. RFID-enabled pressure-sensitive labels can help the logistics, retail, and pharmaceutical industries manage their supply chains while ensuring authenticity and eliminating counterfeit products. The demand for smart and connected labels is growing as industries turn into data-driven and automated places.
- Rising Demand for Anti-Counterfeit Labels: Concerns about counterfeit products, primarily in the areas of drugs, luxury commodities, and electronics. Hence, increased demand for pressure-sensitive labels against counterfeit products has risen, especially among those who integrate hologram security elements, QR codes, micro texts, or UV-sensitive ink into them. As governments and brands strive to protect consumers and intellectual property, pressure-sensitive labels with anti-counterfeit features are increasingly witnessed in high-value and regulated sectors.
- Opportunities in Emerging Markets: The pressure-sensitive labels market offers significant opportunities in emerging markets such as Asia-Pacific, Latin America, and Africa. These regions are experiencing increased demand for packaged goods, retail products, and consumer goods that require labeling as urbanization and industrialization continue to grow. Further, a surge in middle-class consumers and higher disposable incomes will continue reviving industries like food and beverages, cosmetics, and pharmaceuticals, which require heavy usage of pressure-sensitive packaging labels for packaging and branding.
- Customization and Small-Batch Production: The emerging markets of Asia-Pacific, Latin America, and Africa represent significant opportunities for the pressure-sensitive labels market. With ongoing urbanization and industrialization, packaged goods, retail products, and consumer goods are in greater demand in these regions with labeling requirements. The growth of middle-class consumers and their growing disposable incomes is expected to spur the expansion of food and beverages, cosmetics, and pharmaceuticals, highly dependent on pressure-sensitive labels for packaging and branding.
- Customization and Flexibility in Labeling: Growing demands for special and custom packaging, pressure-sensitive labels can take advantage of this opportunity in small batches or short-run production. Digital printing technologies have advanced to allow producing customized labels in smaller quantities at a reasonable price. This can be highly attractive to small and medium-sized enterprises and businesses that need to try new markets or introduce a limited edition of their products. The ability to offer quick turnarounds, high-quality prints, and customization will provide a competitive edge in the market.
Market Report Scope
Key Selling Points
- Comprehensive Coverage: The report comprehensively covers the analysis of products, services, types, and end users of the Pressure Sensitive Labels Market, providing a holistic landscape.
- Expert Analysis: The report is compiled based on the in-depth understanding of industry experts and analysts.
- Up-to-date Information: The report assures business relevance due to its coverage of recent information and data trends.
- Customization Options: This report can be customized to cater to specific client requirements and suit the business strategies aptly.
The research report on the Pressure Sensitive Labels Market can, therefore, help spearhead the trail of decoding and understanding the industry scenario and growth prospects. Although there can be a few valid concerns, the overall benefits of this report tend to outweigh the disadvantages.
REGIONAL FRAMEWORK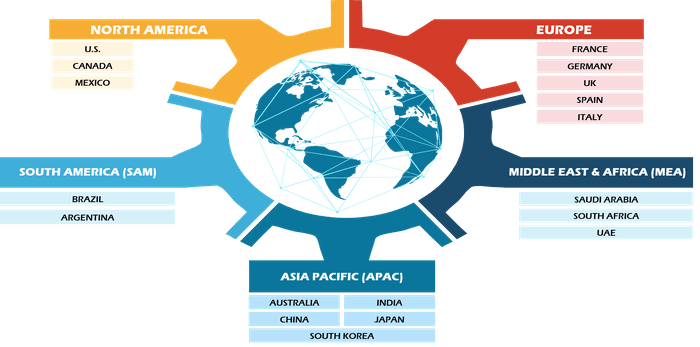
Have a question?

Shejal
Shejal will walk you through a 15-minute call to present the report’s content and answer all queries if you have any.
 Speak to Analyst
- Sample PDF showcases the content structure and the nature of the information with qualitative and quantitative analysis.
- Request discounts available for Start-Ups & Universities

- Sample PDF showcases the content structure and the nature of the information with qualitative and quantitative analysis.
- Request discounts available for Start-Ups & Universities

Report Coverage
Revenue forecast, Company Analysis, Industry landscape, Growth factors, and Trends

Segment Covered
This text is related
to segments covered.

Regional Scope
North America, Europe, Asia Pacific, Middle East & Africa, South & Central America

Country Scope
This text is related
to country scope.
Frequently Asked Questions
Smart labels and RFID integration is expected to be the key market trend.
The report can be delivered in PDF/Word format, we can also share excel data sheet based on request.
On the basis of geography, the pressure sensitive labels market is classified into North America, Europe, Asia Pacific, Middle East and Africa, and South and Central America
Multi-Color Corp, Constantia Flexibles International GmbH, CCL Industries Corp, LINTEC Corp, Inland Label and Marketing Services LLC, Technicote Inc, ATL Corp, Fuji Seal International Inc, 3M Co, and NADCO Tapes and Labels Inc
The major factors driving the reactive pressure sensitive labels
1. Growth in E-commerce and Online Retailing.
2. Rising Demand for Product Customization and Branding.
The Pressure Sensitive Labels Market is estimated to witness a CAGR of 4.9% from 2023 to 2031
TABLE OF CONTENTS
1. INTRODUCTION
1.1. SCOPE OF THE STUDY
1.2. THE INSIGHT PARTNERS RESEARCH REPORT GUIDANCE
1.3. MARKET SEGMENTATION
1.3.1 Pressure Sensitive Labels Market - By Type
1.3.2 Pressure Sensitive Labels Market - By Technology
1.3.3 Pressure Sensitive Labels Market - By Application
1.3.4 Pressure Sensitive Labels Market - By Region
1.3.4.1 By Country
2. KEY TAKEAWAYS
3. RESEARCH METHODOLOGY
4. PRESSURE SENSITIVE LABELS MARKET LANDSCAPE
4.1. OVERVIEW
4.2. PEST ANALYSIS
4.2.1 North America - Pest Analysis
4.2.2 Europe - Pest Analysis
4.2.3 Asia-Pacific - Pest Analysis
4.2.4 Middle East and Africa - Pest Analysis
4.2.5 South and Central America - Pest Analysis
4.3. EXPERT OPINIONS
5. PRESSURE SENSITIVE LABELS MARKET - KEY MARKET DYNAMICS
5.1. KEY MARKET DRIVERS
5.2. KEY MARKET RESTRAINTS
5.3. KEY MARKET OPPORTUNITIES
5.4. FUTURE TRENDS
5.5. IMPACT ANALYSIS OF DRIVERS AND RESTRAINTS
6. PRESSURE SENSITIVE LABELS MARKET - GLOBAL MARKET ANALYSIS
6.1. PRESSURE SENSITIVE LABELS - GLOBAL MARKET OVERVIEW
6.2. PRESSURE SENSITIVE LABELS - GLOBAL MARKET AND FORECAST TO 2028
6.3. MARKET POSITIONING
7. PRESSURE SENSITIVE LABELS MARKET - REVENUE AND FORECASTS TO 2028 - TYPE
7.1. OVERVIEW
7.2. TYPE MARKET FORECASTS AND ANALYSIS
7.3. TOPCOAT
7.3.1. Overview
7.3.2. Topcoat Market Forecast and Analysis
7.4. FACE STOCK
7.4.1. Overview
7.4.2. Face Stock Market Forecast and Analysis
7.5. ADHESIVE
7.5.1. Overview
7.5.2. Adhesive Market Forecast and Analysis
7.6. LINER
7.6.1. Overview
7.6.2. Liner Market Forecast and Analysis
8. PRESSURE SENSITIVE LABELS MARKET - REVENUE AND FORECASTS TO 2028 - TECHNOLOGY
8.1. OVERVIEW
8.2. TECHNOLOGY MARKET FORECASTS AND ANALYSIS
8.3. WATER-BASED
8.3.1. Overview
8.3.2. Water-based Market Forecast and Analysis
8.4. SOLVENT-BASED
8.4.1. Overview
8.4.2. Solvent-based Market Forecast and Analysis
8.5. OTHERS
8.5.1. Overview
8.5.2. Others Market Forecast and Analysis
9. PRESSURE SENSITIVE LABELS MARKET - REVENUE AND FORECASTS TO 2028 - APPLICATION
9.1. OVERVIEW
9.2. APPLICATION MARKET FORECASTS AND ANALYSIS
9.3. FOOD AND BEVERAGES
9.3.1. Overview
9.3.2. Food and Beverages Market Forecast and Analysis
9.4. PHARMACEUTICALS
9.4.1. Overview
9.4.2. Pharmaceuticals Market Forecast and Analysis
9.5. AUTOMOTIVE
9.5.1. Overview
9.5.2. Automotive Market Forecast and Analysis
9.6. OTHER
9.6.1. Overview
9.6.2. Other Market Forecast and Analysis
10. PRESSURE SENSITIVE LABELS MARKET REVENUE AND FORECASTS TO 2028 - GEOGRAPHICAL ANALYSIS
10.1. NORTH AMERICA
10.1.1 North America Pressure Sensitive Labels Market Overview
10.1.2 North America Pressure Sensitive Labels Market Forecasts and Analysis
10.1.3 North America Pressure Sensitive Labels Market Forecasts and Analysis - By Type
10.1.4 North America Pressure Sensitive Labels Market Forecasts and Analysis - By Technology
10.1.5 North America Pressure Sensitive Labels Market Forecasts and Analysis - By Application
10.1.6 North America Pressure Sensitive Labels Market Forecasts and Analysis - By Countries
10.1.6.1 United States Pressure Sensitive Labels Market
10.1.6.1.1 United States Pressure Sensitive Labels Market by Type
10.1.6.1.2 United States Pressure Sensitive Labels Market by Technology
10.1.6.1.3 United States Pressure Sensitive Labels Market by Application
10.1.6.2 Canada Pressure Sensitive Labels Market
10.1.6.2.1 Canada Pressure Sensitive Labels Market by Type
10.1.6.2.2 Canada Pressure Sensitive Labels Market by Technology
10.1.6.2.3 Canada Pressure Sensitive Labels Market by Application
10.1.6.3 Mexico Pressure Sensitive Labels Market
10.1.6.3.1 Mexico Pressure Sensitive Labels Market by Type
10.1.6.3.2 Mexico Pressure Sensitive Labels Market by Technology
10.1.6.3.3 Mexico Pressure Sensitive Labels Market by Application
10.2. EUROPE
10.2.1 Europe Pressure Sensitive Labels Market Overview
10.2.2 Europe Pressure Sensitive Labels Market Forecasts and Analysis
10.2.3 Europe Pressure Sensitive Labels Market Forecasts and Analysis - By Type
10.2.4 Europe Pressure Sensitive Labels Market Forecasts and Analysis - By Technology
10.2.5 Europe Pressure Sensitive Labels Market Forecasts and Analysis - By Application
10.2.6 Europe Pressure Sensitive Labels Market Forecasts and Analysis - By Countries
10.2.6.1 Germany Pressure Sensitive Labels Market
10.2.6.1.1 Germany Pressure Sensitive Labels Market by Type
10.2.6.1.2 Germany Pressure Sensitive Labels Market by Technology
10.2.6.1.3 Germany Pressure Sensitive Labels Market by Application
10.2.6.2 France Pressure Sensitive Labels Market
10.2.6.2.1 France Pressure Sensitive Labels Market by Type
10.2.6.2.2 France Pressure Sensitive Labels Market by Technology
10.2.6.2.3 France Pressure Sensitive Labels Market by Application
10.2.6.3 Italy Pressure Sensitive Labels Market
10.2.6.3.1 Italy Pressure Sensitive Labels Market by Type
10.2.6.3.2 Italy Pressure Sensitive Labels Market by Technology
10.2.6.3.3 Italy Pressure Sensitive Labels Market by Application
10.2.6.4 United Kingdom Pressure Sensitive Labels Market
10.2.6.4.1 United Kingdom Pressure Sensitive Labels Market by Type
10.2.6.4.2 United Kingdom Pressure Sensitive Labels Market by Technology
10.2.6.4.3 United Kingdom Pressure Sensitive Labels Market by Application
10.2.6.5 Russia Pressure Sensitive Labels Market
10.2.6.5.1 Russia Pressure Sensitive Labels Market by Type
10.2.6.5.2 Russia Pressure Sensitive Labels Market by Technology
10.2.6.5.3 Russia Pressure Sensitive Labels Market by Application
10.2.6.6 Rest of Europe Pressure Sensitive Labels Market
10.2.6.6.1 Rest of Europe Pressure Sensitive Labels Market by Type
10.2.6.6.2 Rest of Europe Pressure Sensitive Labels Market by Technology
10.2.6.6.3 Rest of Europe Pressure Sensitive Labels Market by Application
10.3. ASIA-PACIFIC
10.3.1 Asia-Pacific Pressure Sensitive Labels Market Overview
10.3.2 Asia-Pacific Pressure Sensitive Labels Market Forecasts and Analysis
10.3.3 Asia-Pacific Pressure Sensitive Labels Market Forecasts and Analysis - By Type
10.3.4 Asia-Pacific Pressure Sensitive Labels Market Forecasts and Analysis - By Technology
10.3.5 Asia-Pacific Pressure Sensitive Labels Market Forecasts and Analysis - By Application
10.3.6 Asia-Pacific Pressure Sensitive Labels Market Forecasts and Analysis - By Countries
10.3.6.1 Australia Pressure Sensitive Labels Market
10.3.6.1.1 Australia Pressure Sensitive Labels Market by Type
10.3.6.1.2 Australia Pressure Sensitive Labels Market by Technology
10.3.6.1.3 Australia Pressure Sensitive Labels Market by Application
10.3.6.2 China Pressure Sensitive Labels Market
10.3.6.2.1 China Pressure Sensitive Labels Market by Type
10.3.6.2.2 China Pressure Sensitive Labels Market by Technology
10.3.6.2.3 China Pressure Sensitive Labels Market by Application
10.3.6.3 India Pressure Sensitive Labels Market
10.3.6.3.1 India Pressure Sensitive Labels Market by Type
10.3.6.3.2 India Pressure Sensitive Labels Market by Technology
10.3.6.3.3 India Pressure Sensitive Labels Market by Application
10.3.6.4 Japan Pressure Sensitive Labels Market
10.3.6.4.1 Japan Pressure Sensitive Labels Market by Type
10.3.6.4.2 Japan Pressure Sensitive Labels Market by Technology
10.3.6.4.3 Japan Pressure Sensitive Labels Market by Application
10.3.6.5 South Korea Pressure Sensitive Labels Market
10.3.6.5.1 South Korea Pressure Sensitive Labels Market by Type
10.3.6.5.2 South Korea Pressure Sensitive Labels Market by Technology
10.3.6.5.3 South Korea Pressure Sensitive Labels Market by Application
10.3.6.6 Rest of Asia-Pacific Pressure Sensitive Labels Market
10.3.6.6.1 Rest of Asia-Pacific Pressure Sensitive Labels Market by Type
10.3.6.6.2 Rest of Asia-Pacific Pressure Sensitive Labels Market by Technology
10.3.6.6.3 Rest of Asia-Pacific Pressure Sensitive Labels Market by Application
10.4. MIDDLE EAST AND AFRICA
10.4.1 Middle East and Africa Pressure Sensitive Labels Market Overview
10.4.2 Middle East and Africa Pressure Sensitive Labels Market Forecasts and Analysis
10.4.3 Middle East and Africa Pressure Sensitive Labels Market Forecasts and Analysis - By Type
10.4.4 Middle East and Africa Pressure Sensitive Labels Market Forecasts and Analysis - By Technology
10.4.5 Middle East and Africa Pressure Sensitive Labels Market Forecasts and Analysis - By Application
10.4.6 Middle East and Africa Pressure Sensitive Labels Market Forecasts and Analysis - By Countries
10.4.6.1 South Africa Pressure Sensitive Labels Market
10.4.6.1.1 South Africa Pressure Sensitive Labels Market by Type
10.4.6.1.2 South Africa Pressure Sensitive Labels Market by Technology
10.4.6.1.3 South Africa Pressure Sensitive Labels Market by Application
10.4.6.2 Saudi Arabia Pressure Sensitive Labels Market
10.4.6.2.1 Saudi Arabia Pressure Sensitive Labels Market by Type
10.4.6.2.2 Saudi Arabia Pressure Sensitive Labels Market by Technology
10.4.6.2.3 Saudi Arabia Pressure Sensitive Labels Market by Application
10.4.6.3 U.A.E Pressure Sensitive Labels Market
10.4.6.3.1 U.A.E Pressure Sensitive Labels Market by Type
10.4.6.3.2 U.A.E Pressure Sensitive Labels Market by Technology
10.4.6.3.3 U.A.E Pressure Sensitive Labels Market by Application
10.4.6.4 Rest of Middle East and Africa Pressure Sensitive Labels Market
10.4.6.4.1 Rest of Middle East and Africa Pressure Sensitive Labels Market by Type
10.4.6.4.2 Rest of Middle East and Africa Pressure Sensitive Labels Market by Technology
10.4.6.4.3 Rest of Middle East and Africa Pressure Sensitive Labels Market by Application
10.5. SOUTH AND CENTRAL AMERICA
10.5.1 South and Central America Pressure Sensitive Labels Market Overview
10.5.2 South and Central America Pressure Sensitive Labels Market Forecasts and Analysis
10.5.3 South and Central America Pressure Sensitive Labels Market Forecasts and Analysis - By Type
10.5.4 South and Central America Pressure Sensitive Labels Market Forecasts and Analysis - By Technology
10.5.5 South and Central America Pressure Sensitive Labels Market Forecasts and Analysis - By Application
10.5.6 South and Central America Pressure Sensitive Labels Market Forecasts and Analysis - By Countries
10.5.6.1 Brazil Pressure Sensitive Labels Market
10.5.6.1.1 Brazil Pressure Sensitive Labels Market by Type
10.5.6.1.2 Brazil Pressure Sensitive Labels Market by Technology
10.5.6.1.3 Brazil Pressure Sensitive Labels Market by Application
10.5.6.2 Argentina Pressure Sensitive Labels Market
10.5.6.2.1 Argentina Pressure Sensitive Labels Market by Type
10.5.6.2.2 Argentina Pressure Sensitive Labels Market by Technology
10.5.6.2.3 Argentina Pressure Sensitive Labels Market by Application
10.5.6.3 Rest of South and Central America Pressure Sensitive Labels Market
10.5.6.3.1 Rest of South and Central America Pressure Sensitive Labels Market by Type
10.5.6.3.2 Rest of South and Central America Pressure Sensitive Labels Market by Technology
10.5.6.3.3 Rest of South and Central America Pressure Sensitive Labels Market by Application
11. INDUSTRY LANDSCAPE
11.1. MERGERS AND ACQUISITIONS
11.2. AGREEMENTS, COLLABORATIONS AND JOIN VENTURES
11.3. NEW PRODUCT LAUNCHES
11.4. EXPANSIONS AND OTHER STRATEGIC DEVELOPMENTS
12. PRESSURE SENSITIVE LABELS MARKET, KEY COMPANY PROFILES
12.1. AVERY DENNISON CORPORATION
12.1.1. Key Facts
12.1.2. Business Description
12.1.3. Products and Services
12.1.4. Financial Overview
12.1.5. SWOT Analysis
12.1.6. Key Developments
12.2. CCL INDUSTRIES
12.2.1. Key Facts
12.2.2. Business Description
12.2.3. Products and Services
12.2.4. Financial Overview
12.2.5. SWOT Analysis
12.2.6. Key Developments
12.3. CONSTANTIA FLEXIBLES GROUP GMBH
12.3.1. Key Facts
12.3.2. Business Description
12.3.3. Products and Services
12.3.4. Financial Overview
12.3.5. SWOT Analysis
12.3.6. Key Developments
12.4. FORT DEARBORN COMPANY
12.4.1. Key Facts
12.4.2. Business Description
12.4.3. Products and Services
12.4.4. Financial Overview
12.4.5. SWOT Analysis
12.4.6. Key Developments
12.5. HENKEL FINLAND OY.
12.5.1. Key Facts
12.5.2. Business Description
12.5.3. Products and Services
12.5.4. Financial Overview
12.5.5. SWOT Analysis
12.5.6. Key Developments
12.6. INLAND
12.6.1. Key Facts
12.6.2. Business Description
12.6.3. Products and Services
12.6.4. Financial Overview
12.6.5. SWOT Analysis
12.6.6. Key Developments
12.7. LINTEC CORPORATION
12.7.1. Key Facts
12.7.2. Business Description
12.7.3. Products and Services
12.7.4. Financial Overview
12.7.5. SWOT Analysis
12.7.6. Key Developments
12.8. MULTI-COLOR CORPORATION
12.8.1. Key Facts
12.8.2. Business Description
12.8.3. Products and Services
12.8.4. Financial Overview
12.8.5. SWOT Analysis
12.8.6. Key Developments
12.9. TECHNICOTE
12.9.1. Key Facts
12.9.2. Business Description
12.9.3. Products and Services
12.9.4. Financial Overview
12.9.5. SWOT Analysis
12.9.6. Key Developments
12.10. UPM
12.10.1. Key Facts
12.10.2. Business Description
12.10.3. Products and Services
12.10.4. Financial Overview
12.10.5. SWOT Analysis
12.10.6. Key Developments
13. APPENDIX
13.1. ABOUT THE INSIGHT PARTNERS
13.2. GLOSSARY OF TERMS
The List of Companies
1. Avery Dennison Corporation
2. CCL Industries
3. Constantia Flexibles Group GmbH
4. Fort Dearborn Company
5. Henkel Finland Oy.
6. Inland
7. LINTEC Corporation
8. Multi-Color Corporation
9. Technicote
10. UPM
The Insight Partners performs research in 4 major stages: Data Collection & Secondary Research, Primary Research, Data Analysis and Data Triangulation & Final Review.
- Data Collection and Secondary Research:
As a market research and consulting firm operating from a decade, we have published many reports and advised several clients across the globe. First step for any study will start with an assessment of currently available data and insights from existing reports. Further, historical and current market information is collected from Investor Presentations, Annual Reports, SEC Filings, etc., and other information related to company’s performance and market positioning are gathered from Paid Databases (Factiva, Hoovers, and Reuters) and various other publications available in public domain.
Several associations trade associates, technical forums, institutes, societies and organizations are accessed to gain technical as well as market related insights through their publications such as research papers, blogs and press releases related to the studies are referred to get cues about the market. Further, white papers, journals, magazines, and other news articles published in the last 3 years are scrutinized and analyzed to understand the current market trends.
- Primary Research:
The primarily interview analysis comprise of data obtained from industry participants interview and answers to survey questions gathered by in-house primary team.
For primary research, interviews are conducted with industry experts/CEOs/Marketing Managers/Sales Managers/VPs/Subject Matter Experts from both demand and supply side to get a 360-degree view of the market. The primary team conducts several interviews based on the complexity of the markets to understand the various market trends and dynamics which makes research more credible and precise.
A typical research interview fulfils the following functions:
- Provides first-hand information on the market size, market trends, growth trends, competitive landscape, and outlook
- Validates and strengthens in-house secondary research findings
- Develops the analysis team’s expertise and market understanding
Primary research involves email interactions and telephone interviews for each market, category, segment, and sub-segment across geographies. The participants who typically take part in such a process include, but are not limited to:
- Industry participants: VPs, business development managers, market intelligence managers and national sales managers
- Outside experts: Valuation experts, research analysts and key opinion leaders specializing in the electronics and semiconductor industry.
Below is the breakup of our primary respondents by company, designation, and region:

Once we receive the confirmation from primary research sources or primary respondents, we finalize the base year market estimation and forecast the data as per the macroeconomic and microeconomic factors assessed during data collection.
- Data Analysis:
Once data is validated through both secondary as well as primary respondents, we finalize the market estimations by hypothesis formulation and factor analysis at regional and country level.
- 3.1 Macro-Economic Factor Analysis:
We analyse macroeconomic indicators such the gross domestic product (GDP), increase in the demand for goods and services across industries, technological advancement, regional economic growth, governmental policies, the influence of COVID-19, PEST analysis, and other aspects. This analysis aids in setting benchmarks for various nations/regions and approximating market splits. Additionally, the general trend of the aforementioned components aid in determining the market's development possibilities.
- 3.2 Country Level Data:
Various factors that are especially aligned to the country are taken into account to determine the market size for a certain area and country, including the presence of vendors, such as headquarters and offices, the country's GDP, demand patterns, and industry growth. To comprehend the market dynamics for the nation, a number of growth variables, inhibitors, application areas, and current market trends are researched. The aforementioned elements aid in determining the country's overall market's growth potential.
- 3.3 Company Profile:
The “Table of Contents” is formulated by listing and analyzing more than 25 - 30 companies operating in the market ecosystem across geographies. However, we profile only 10 companies as a standard practice in our syndicate reports. These 10 companies comprise leading, emerging, and regional players. Nonetheless, our analysis is not restricted to the 10 listed companies, we also analyze other companies present in the market to develop a holistic view and understand the prevailing trends. The “Company Profiles” section in the report covers key facts, business description, products & services, financial information, SWOT analysis, and key developments. The financial information presented is extracted from the annual reports and official documents of the publicly listed companies. Upon collecting the information for the sections of respective companies, we verify them via various primary sources and then compile the data in respective company profiles. The company level information helps us in deriving the base number as well as in forecasting the market size.
- 3.4 Developing Base Number:
Aggregation of sales statistics (2020-2022) and macro-economic factor, and other secondary and primary research insights are utilized to arrive at base number and related market shares for 2022. The data gaps are identified in this step and relevant market data is analyzed, collected from paid primary interviews or databases. On finalizing the base year market size, forecasts are developed on the basis of macro-economic, industry and market growth factors and company level analysis.
- Data Triangulation and Final Review:
The market findings and base year market size calculations are validated from supply as well as demand side. Demand side validations are based on macro-economic factor analysis and benchmarks for respective regions and countries. In case of supply side validations, revenues of major companies are estimated (in case not available) based on industry benchmark, approximate number of employees, product portfolio, and primary interviews revenues are gathered. Further revenue from target product/service segment is assessed to avoid overshooting of market statistics. In case of heavy deviations between supply and demand side values, all thes steps are repeated to achieve synchronization.
We follow an iterative model, wherein we share our research findings with Subject Matter Experts (SME’s) and Key Opinion Leaders (KOLs) until consensus view of the market is not formulated – this model negates any drastic deviation in the opinions of experts. Only validated and universally acceptable research findings are quoted in our reports.
We have important check points that we use to validate our research findings – which we call – data triangulation, where we validate the information, we generate from secondary sources with primary interviews and then we re-validate with our internal data bases and Subject matter experts. This comprehensive model enables us to deliver high quality, reliable data in shortest possible time.
 Get Free Sample For