The privileged access management solutions market size is expected to reach US$ 5.95 billion by 2031 from US$ 2.46 billion in 2023. The privileged access management solutions market is estimated to record a CAGR of 11.7% from 2023 to 2031. The zero trust security model is likely to remain a key market trend.
Privileged Access Management Solutions Market Analysis
The increasing prevalence of cyberattacks targeting privileged accounts and credentials is driving the adoption of privileged access management solutions. Organizations are increasingly becoming aware of the need to safeguard their critical assets from unauthorized access and potential breaches. PAM solutions also play a crucial role in mitigating insider threats by implementing robust controls and monitoring privileged user actions. Furthermore, PAM solutions enable organizations to enforce adaptive access controls considering real-time contextual factors, granting appropriate access privileges based on the specific context. These solutions also assist organizations in meeting complex compliance requirements by offering risk management capabilities, maintaining detailed records of critical infrastructure activities, and facilitating audit-friendly IT environments.
The growing number of security breaches related to privileged access misuse has underscored the significance of robust privileged access management (PAM) solutions. These solutions help organizations reduce the attack surface by limiting privileged account membership and minimizing privileges. They also aid in mitigating insider threats through controls and monitoring privileged user activities. Moreover, PAM solutions enable organizations to enforce context-based access controls and enhance compliance with complex regulations.
Privileged Access Management Solutions Market Overview
Privileged access management (PAM) solutions are advanced security measures designed to safeguard organizations against cyber threats by actively monitoring, detecting, and preventing unauthorized access to critical resources. These solutions primarily focus on protecting privileged accounts, which possess elevated access privileges within an organization's systems and networks, making them prime targets for cybercriminals. PAM solutions utilize a combination of processes and technology to provide comprehensive visibility into the activities of privileged users and their use of privileged accounts.
Customize Research To Suit Your Requirement
We can optimize and tailor the analysis and scope which is unmet through our standard offerings. This flexibility will help you gain the exact information needed for your business planning and decision making.
Privileged Access Management Solutions Market: Strategic Insights
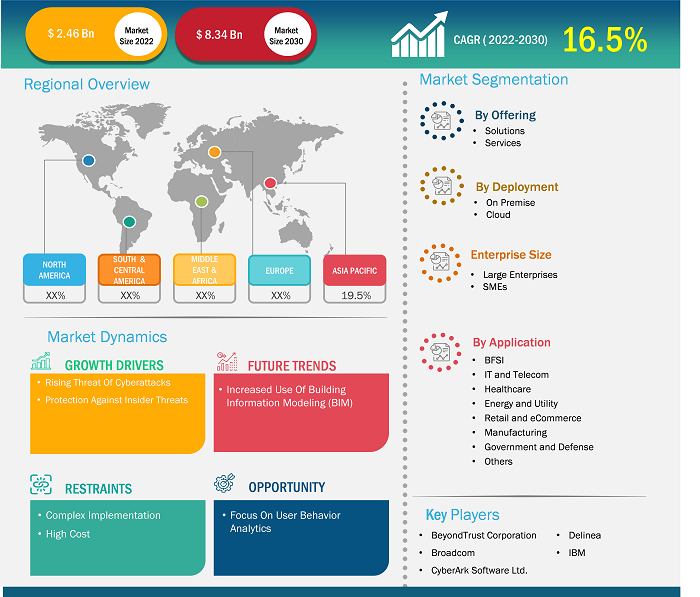
Market Size Value in US$ 2.46 billion in 2022 Market Size Value by US$ 8.34 billion by 2030 Growth rate CAGR of 16.5% from 2022 to 2030 Forecast Period 2022-2030 Base Year 2022

Naveen
Have a question?
Naveen will walk you through a 15-minute call to present the report’s content and answer all queries if you have any.
 Speak to Analyst
Customize Research To Suit Your Requirement
We can optimize and tailor the analysis and scope which is unmet through our standard offerings. This flexibility will help you gain the exact information needed for your business planning and decision making.
Privileged Access Management Solutions Market: Strategic Insights
| Market Size Value in | US$ 2.46 billion in 2022 |
| Market Size Value by | US$ 8.34 billion by 2030 |
| Growth rate | CAGR of 16.5% from 2022 to 2030 |
| Forecast Period | 2022-2030 |
| Base Year | 2022 |
Naveen
Have a question?
Naveen will walk you through a 15-minute call to present the report’s content and answer all queries if you have any.
Speak to Analyst
Privileged Access Management Solutions Market Drivers and Opportunities
Increase in Number of Cyberattacks to Favor Market
In recent years, businesses are facing the continuous threat of cyberattacks. According to Embroker Insurance Services LLC, cyberattacks were considered the fifth top-rated risk in 2020, and cases continue to rise with technological advancements. Computer malware, data breaches, and denial of service (DoS) are a few examples of cyberattacks. During the COVID-19 pandemic, cybercriminals took advantage of misaligned networks as businesses were shifting to remote working environments. According to OneLogin, cybercrime costs more than US$ 1 trillion worldwide, as 37% of organizations were affected by ransomware and 61% were affected by malware attacks in 2020. Between 2019 and 2020, cyberattacks in the US increased by 139% as the country registered 145.2 million cases in Q3 2020. Malware attacks increased by 358% in 2020 compared to 2019. Similarly, according to the Clusit Report, cyberattacks across the globe increased by 10% in 2021 compared to the previous year. For instance, according to AAG, the UK had the highest number of cybercrime victims per million internet users (4,783 users) in 2022, an increase of 40% over 2020 figures. The average cost of a cyber breach was US$ 4.35 million in 2022, and it is predicted that this value is expected to reach US$ 10.5 trillion by 2025.
Cyber threats are considered a major concern as various organizations continue to operate in a digital environment. They have serious consequences for individuals, corporations, and governments. The rise in the number of cyberattacks has increased the importance of cybersecurity to safeguard critical infrastructures and to ensure the safety of individuals and organizations. Organizations are increasingly becoming aware of the need to safeguard their critical assets from unauthorized access and potential breaches. Thus, the increasing number of cyberattacks is a significant factor propelling the growth of the privileged access management (PAM) solutions market.
Emergence of Intelligence-Based Privileged Access Management Solutions
Intelligence-based PAM enables risk-based access control, where access decisions are based on risk assessments. Factors such as user roles, privileges, and contextual information are evaluated to determine the level of risk associated with a specific access request. This allows organizations to implement dynamic access controls that adapt to changing risk profiles. Intelligence-based PAM solutions can automate responses to security incidents or policy violations. For instance, if an unauthorized user attempts to access a privileged account, the solution can automatically block the access attempt and notify the security team. Intelligence-based PAM solutions continuously monitor privileged access activities in real-time. This proactive monitoring helps organizations detect suspicious or unauthorized behavior and respond to potential security threats before they escalate. Intelligence-based PAM also enables adaptive access policies that dynamically adjust based on contextual information. For instance, if a user's behavior indicates a higher risk, the solution can enforce stricter access controls or require additional authentication measures. Thus, the emergence of intelligence-based PAM solutions is anticipated to provide significant growth opportunities to the privileged access management (PAM) solutions market.
Privileged Access Management Solutions Market Report Segmentation Analysis
Key segments that contributed to the derivation of the privileged access management solutions market analysis are offering, deployment, enterprise size, and end-use industry.
- Based on offering, the market is segmented into solutions and services. The solution segment held a larger market share in 2023.
- By deployment, the market is bifurcated into cloud and on premise. The cloud segment dominated the market in 2023.
- In terms of enterprise size, the market is bifurcated into large enterprises and SMEs. The large enterprises segment dominated the market in 2023.
- Based on end-use industry, the market is segmented into BFSI, IT & telecom, healthcare, energy & utility, retail & ecommerce, manufacturing, government & defense, and others. The BFSI segment dominated the market in 2023.
Privileged Access Management Solutions Market Share Analysis by Geography
- The privileged access management solutions market is segmented into five major regions: North America, Europe, Asia Pacific (APAC), the Middle East & Africa (MEA), and South & Central America. North America dominated the market in 2023, followed by Europe and APAC.
- North America is one of the fastest-growing regions in terms of both technological innovations and the adoption of advanced technologies. With the increasing penetration of digitization in various industries, privileged access management solutions have become a vital component for businesses in North America to establish security measures. With the increasing penetration of digitization in various industries, PAM solutions have become a vital component of business. In addition, the region is home to market players such as IBM Corporation, Microsoft, Broadcom Inc., Fortinet Inc., and One Identity.
Privileged Access Management Solutions Market Report Scope
Privileged Access Management Solutions Market News and Recent Developments
The privileged access management solutions market is evaluated by gathering qualitative and quantitative data post primary and secondary research, which includes important corporate publications, association data, and databases. A few of the developments in the privileged access management solutions market are listed below:
- CyberArk, the identity security company, announced that FM Logistic, a global supply chain management service, selected the CyberArk Identity Security Platform to secure tens of thousands of identities around the world and provide a secure foundation for its digital transformation and information security. To streamline processes and improve productivity, FM Logistics began a major digital transformation initiative, including a cloud migration project. Its existing identity management solution, however, was labor-intensive when managing privileged identities and not compatible with its cloud migration efforts. The company needed a solution to reduce complexity, simplify and automate its identity lifecycle management, provide privileged access management, and integrate with their cloud migration.
(Source: CyberArk, Press Release, May 2024)
- IBM unveiled its new security suite designed to unify and accelerate the security analyst experience across the full incident lifecycle. The IBM Security QRadar Suite represents a major evolution and expansion of the QRadar brand, spanning all core threat detection, investigation, and response technologies, with significant investment in innovations across the portfolio.
(Source: IBM, Press Release, April 2023)
Privileged Access Management Solutions Market Report Coverage and Deliverables
The "Privileged Access Management Solutions Market Size and Forecast (2021–2031)" provides a detailed analysis of the market covering the areas mentioned below:
- Privileged access management solutions market size and forecast at global, regional, and country levels for all the key market segments covered under the scope
- Privileged access management solutions market trends as well as market dynamics such as drivers, restraints, and key opportunities
- Detailed PEST and SWOT analysis
- Privileged access management solutions market analysis covering key market trends, global and regional framework, major players, regulations, and recent market developments
- Industry landscape and competition analysis covering market concentration, heat map analysis, prominent players, and recent developments for the privileged access management solutions market
- Detailed company profiles

Report Coverage
Revenue forecast, Company Analysis, Industry landscape, Growth factors, and Trends

Segment Covered
Offering, Deployment, Enterprise Size, and Industry Vertical

Regional Scope
North America, Europe, Asia Pacific, Middle East & Africa, South & Central America

Country Scope
This text is related
to country scope.
Frequently Asked Questions
The key players, holding majority shares, in privileged access management (PAM) solutions market includes Microsoft Corp, International Business Machines Corp, Oracle Corp, Broadcom Inc, and Fortinet Inc.
The North America held the largest market share in 2023, followed by Europe and Asia Pacific.
Asia Pacific is anticipated to grow with the highest CAGR over the forecast period 2024-2031.
Rise of cloud-based privileged access management solutions and zero trust security model is the future trends of the privileged access management (PAM) solutions market.
Increase in number of cyberattacks, rise in demand for protection against insider threats, and stringent government regulations are the driving factors impacting the privileged access management (PAM) solutions market.
The privileged access management (PAM) solutions market was valued at US$ 2.46 billion in 2023 and is projected to reach US$ 5.95 billion by 2031; it is expected to grow at a CAGR of 11.7% during 2023–2031.
1. Introduction
1.1 The Insight Partners Research Report Guidance
1.2 Market Segmentation
2. Executive Summary
2.1 Key Insights
2.2 Market Attractiveness
3. Research Methodology
3.1 Secondary Research
3.2 Primary Research
3.2.1 Hypothesis formulation:
3.2.2 Macro-economic factor analysis:
3.2.3 Developing base number:
3.2.4 Data Triangulation:
3.2.5 Country level data:
4. Privileged Access Management (PAM) Solutions Market Landscape
4.1 Overview
4.2 PEST Analysis
4.3 Ecosystem Analysis
4.3.1 Software Providers:
4.3.2 Regulatory Compliance and Certification Bodies:
4.3.3 Service Providers and System Integrators:
4.3.4 End Users:
4.3.5 List of Vendors in Value Chain
5. Privileged Access Management (PAM) Solutions Market – Key Market Dynamics
5.1 Privileged Access Management (PAM) Solutions Market – Key Market Dynamics
5.2 Market Drivers
5.2.1 Increase in Number of Cyberattacks
5.2.2 Rise in Demand for Protection Against Insider Threats
5.2.3 Stringent Government Regulations
5.3 Market Restraints
5.3.1 High Cost of Implementation
5.4 Market Opportunities
5.4.1 Emergence of Intelligence-Based Privileged Access Management Solutions
5.5 Trends
5.5.1 Rise of Cloud-Based Privileged Access Management Solutions
5.5.2 Zero Trust Security Model
5.6 Impact of Drivers and Restraints:
6. Privileged Access Management (PAM) Solutions Market – Global Market Analysis
6.1 Privileged Access Management (PAM) Solutions Market Revenue (US$ Million), 2021–2031
6.2 Privileged Access Management (PAM) Solutions Market Forecast Analysis
7. Privileged Access Management (PAM) Solutions Market Analysis – by Offering
7.1 Solutions
7.1.1 Overview
7.1.2 Solutions: Privileged Access Management (PAM) Solutions Market – Revenue and Forecast to 2031 (US$ Million)
7.2 Services
7.2.1 Overview
7.2.2 Services: Privileged Access Management (PAM) Solutions Market – Revenue and Forecast to 2031 (US$ Million)
8. Privileged Access Management (PAM) Solutions Market Analysis – by Deployment
8.1 On Premise
8.1.1 Overview
8.1.2 On Premise: Privileged Access Management (PAM) Solutions Market – Revenue and Forecast to 2031 (US$ Million)
8.2 Cloud
8.2.1 Overview
8.2.2 Cloud: Privileged Access Management (PAM) Solutions Market – Revenue and Forecast to 2031 (US$ Million)
9. Privileged Access Management (PAM) Solutions Market Analysis – by Enterprise Size
9.1 Large Enterprises
9.1.1 Overview
9.1.2 Large Enterprises: Privileged Access Management (PAM) Solutions Market – Revenue and Forecast to 2031 (US$ Million)
9.2 SMEs
9.2.1 Overview
9.2.2 SMEs: Privileged Access Management (PAM) Solutions Market – Revenue and Forecast to 2031 (US$ Million)
10. Privileged Access Management (PAM) Solutions Market Analysis – by Industry Vertical
10.1 BFSI
10.1.1 Overview
10.1.2 BFSI: Privileged Access Management (PAM) Solutions Market – Revenue and Forecast to 2031 (US$ Million)
10.2 IT and Telecom
10.2.1 Overview
10.2.2 IT and Telecom: Privileged Access Management (PAM) Solutions Market – Revenue and Forecast to 2031 (US$ Million)
10.3 Healthcare
10.3.1 Overview
10.3.2 Healthcare: Privileged Access Management (PAM) Solutions Market – Revenue and Forecast to 2031 (US$ Million)
10.4 Energy and Utility
10.4.1 Overview
10.4.2 Energy and Utility: Privileged Access Management (PAM) Solutions Market – Revenue and Forecast to 2031 (US$ Million)
10.5 Retail and Ecommerce
10.5.1 Overview
10.5.2 Retail and Ecommerce: Privileged Access Management (PAM) Solutions Market – Revenue and Forecast to 2031 (US$ Million)
10.6 Manufacturing
10.6.1 Overview
10.6.2 Manufacturing: Privileged Access Management (PAM) Solutions Market – Revenue and Forecast to 2031 (US$ Million)
10.7 Government and Defense
10.7.1 Overview
10.7.2 Government and Defense: Privileged Access Management (PAM) Solutions Market – Revenue and Forecast to 2031 (US$ Million)
10.8 Others
10.8.1 Overview
10.8.2 Others: Privileged Access Management (PAM) Solutions Market – Revenue and Forecast to 2031 (US$ Million)
11. Privileged Access Management (PAM) Solutions Market – Geographical Analysis
11.1 Overview
11.2 North America
11.2.1 North America Privileged Access Management (PAM) Solutions Market Overview
11.2.2 North America: Privileged Access Management (PAM) Solutions Market – Revenue and Forecast to 2031 (US$ Million)
11.2.3 North America: Privileged Access Management (PAM) Solutions Market Breakdown, by Offering
11.2.3.1 North America: Privileged Access Management (PAM) Solutions Market – Revenue and Forecast Analysis – by Offering
11.2.4 North America: Privileged Access Management (PAM) Solutions Market Breakdown, by Deployment
11.2.4.1 North America: Privileged Access Management (PAM) Solutions Market – Revenue and Forecast Analysis – by Deployment
11.2.5 North America: Privileged Access Management (PAM) Solutions Market Breakdown, by Enterprise Size
11.2.5.1 North America: Privileged Access Management (PAM) Solutions Market – Revenue and Forecast Analysis – by Enterprise Size
11.2.6 North America: Privileged Access Management (PAM) Solutions Market Breakdown, by Industry Vertical
11.2.6.1 North America: Privileged Access Management (PAM) Solutions Market – Revenue and Forecast Analysis – by Industry Vertical
11.2.7 North America: Privileged Access Management (PAM) Solutions Market – Revenue and Forecast Analysis – by Country
11.2.7.1 North America: Privileged Access Management (PAM) Solutions Market – Revenue and Forecast Analysis – by Country
11.2.7.2 United States: Privileged Access Management (PAM) Solutions Market – Revenue and Forecast to 2031 (US$ Million)
11.2.7.2.1 United States: Privileged Access Management (PAM) Solutions Market Breakdown, by Offering
11.2.7.2.2 United States: Privileged Access Management (PAM) Solutions Market Breakdown, by Deployment
11.2.7.2.3 United States: Privileged Access Management (PAM) Solutions Market Breakdown, by Enterprise Size
11.2.7.2.4 United States: Privileged Access Management (PAM) Solutions Market Breakdown, by Industry Vertical
11.2.7.3 Canada: Privileged Access Management (PAM) Solutions Market – Revenue and Forecast to 2031 (US$ Million)
11.2.7.3.1 Canada: Privileged Access Management (PAM) Solutions Market Breakdown, by Offering
11.2.7.3.2 Canada: Privileged Access Management (PAM) Solutions Market Breakdown, by Deployment
11.2.7.3.3 Canada: Privileged Access Management (PAM) Solutions Market Breakdown, by Enterprise Size
11.2.7.3.4 Canada: Privileged Access Management (PAM) Solutions Market Breakdown, by Industry Vertical
11.2.7.4 Mexico: Privileged Access Management (PAM) Solutions Market – Revenue and Forecast to 2031 (US$ Million)
11.2.7.4.1 Mexico: Privileged Access Management (PAM) Solutions Market Breakdown, by Offering
11.2.7.4.2 Mexico: Privileged Access Management (PAM) Solutions Market Breakdown, by Deployment
11.2.7.4.3 Mexico: Privileged Access Management (PAM) Solutions Market Breakdown, by Enterprise Size
11.2.7.4.4 Mexico: Privileged Access Management (PAM) Solutions Market Breakdown, by Industry Vertical
11.3 Europe
11.3.1 Europe Privileged Access Management (PAM) Solutions Market Overview
11.3.2 Europe: Privileged Access Management (PAM) Solutions Market – Revenue and Forecast to 2031 (US$ Million)
11.3.3 Europe: Privileged Access Management (PAM) Solutions Market Breakdown, by Offering
11.3.3.1 Europe: Privileged Access Management (PAM) Solutions Market – Revenue and Forecast Analysis – by Offering
11.3.4 Europe: Privileged Access Management (PAM) Solutions Market Breakdown, by Deployment
11.3.4.1 Europe: Privileged Access Management (PAM) Solutions Market – Revenue and Forecast Analysis – by Deployment
11.3.5 Europe: Privileged Access Management (PAM) Solutions Market Breakdown, by Enterprise Size
11.3.5.1 Europe: Privileged Access Management (PAM) Solutions Market – Revenue and Forecast Analysis – by Enterprise Size
11.3.6 Europe: Privileged Access Management (PAM) Solutions Market Breakdown, by Industry Vertical
11.3.6.1 Europe: Privileged Access Management (PAM) Solutions Market – Revenue and Forecast Analysis – by Industry Vertical
11.3.7 Europe: Privileged Access Management (PAM) Solutions Market – Revenue and Forecast Analysis – by Country
11.3.7.1 Europe: Privileged Access Management (PAM) Solutions Market – Revenue and Forecast Analysis – by Country
11.3.7.2 Germany: Privileged Access Management (PAM) Solutions Market – Revenue and Forecast to 2031 (US$ Million)
11.3.7.2.1 Germany: Privileged Access Management (PAM) Solutions Market Breakdown, by Offering
11.3.7.2.2 Germany: Privileged Access Management (PAM) Solutions Market Breakdown, by Deployment
11.3.7.2.3 Germany: Privileged Access Management (PAM) Solutions Market Breakdown, by Enterprise Size
11.3.7.2.4 Germany: Privileged Access Management (PAM) Solutions Market Breakdown, by Industry Vertical
11.3.7.3 United Kingdom: Privileged Access Management (PAM) Solutions Market – Revenue and Forecast to 2031 (US$ Million)
11.3.7.3.1 United Kingdom: Privileged Access Management (PAM) Solutions Market Breakdown, by Offering
11.3.7.3.2 United Kingdom: Privileged Access Management (PAM) Solutions Market Breakdown, by Deployment
11.3.7.3.3 United Kingdom: Privileged Access Management (PAM) Solutions Market Breakdown, by Enterprise Size
11.3.7.3.4 United Kingdom: Privileged Access Management (PAM) Solutions Market Breakdown, by Industry Vertical
11.3.7.4 France: Privileged Access Management (PAM) Solutions Market – Revenue and Forecast to 2031 (US$ Million)
11.3.7.4.1 France: Privileged Access Management (PAM) Solutions Market Breakdown, by Offering
11.3.7.4.2 France: Privileged Access Management (PAM) Solutions Market Breakdown, by Deployment
11.3.7.4.3 France: Privileged Access Management (PAM) Solutions Market Breakdown, by Enterprise Size
11.3.7.4.4 France: Privileged Access Management (PAM) Solutions Market Breakdown, by Industry Vertical
11.3.7.5 Italy: Privileged Access Management (PAM) Solutions Market – Revenue and Forecast to 2031 (US$ Million)
11.3.7.5.1 Italy: Privileged Access Management (PAM) Solutions Market Breakdown, by Offering
11.3.7.5.2 Italy: Privileged Access Management (PAM) Solutions Market Breakdown, by Deployment
11.3.7.5.3 Italy: Privileged Access Management (PAM) Solutions Market Breakdown, by Enterprise Size
11.3.7.5.4 Italy: Privileged Access Management (PAM) Solutions Market Breakdown, by Industry Vertical
11.3.7.6 Russia: Privileged Access Management (PAM) Solutions Market – Revenue and Forecast to 2031 (US$ Million)
11.3.7.6.1 Russia: Privileged Access Management (PAM) Solutions Market Breakdown, by Offering
11.3.7.6.2 Russia: Privileged Access Management (PAM) Solutions Market Breakdown, by Deployment
11.3.7.6.3 Russia: Privileged Access Management (PAM) Solutions Market Breakdown, by Enterprise Size
11.3.7.6.4 Russia: Privileged Access Management (PAM) Solutions Market Breakdown, by Industry Vertical
11.3.7.7 Rest of Europe: Privileged Access Management (PAM) Solutions Market – Revenue and Forecast to 2031 (US$ Million)
11.3.7.7.1 Rest of Europe: Privileged Access Management (PAM) Solutions Market Breakdown, by Offering
11.3.7.7.2 Rest of Europe: Privileged Access Management (PAM) Solutions Market Breakdown, by Deployment
11.3.7.7.3 Rest of Europe: Privileged Access Management (PAM) Solutions Market Breakdown, by Enterprise Size
11.3.7.7.4 Rest of Europe: Privileged Access Management (PAM) Solutions Market Breakdown, by Industry Vertical
11.4 Asia Pacific
11.4.1 Asia Pacific Privileged Access Management (PAM) Solutions Market Overview
11.4.2 Asia Pacific: Privileged Access Management (PAM) Solutions Market – Revenue and Forecast to 2031 (US$ Million)
11.4.3 Asia Pacific: Privileged Access Management (PAM) Solutions Market Breakdown, by Offering
11.4.3.1 Asia Pacific: Privileged Access Management (PAM) Solutions Market – Revenue and Forecast Analysis – by Offering
11.4.4 Asia Pacific: Privileged Access Management (PAM) Solutions Market Breakdown, by Deployment
11.4.4.1 Asia Pacific: Privileged Access Management (PAM) Solutions Market – Revenue and Forecast Analysis – by Deployment
11.4.5 Asia Pacific: Privileged Access Management (PAM) Solutions Market Breakdown, by Enterprise Size
11.4.5.1 Asia Pacific: Privileged Access Management (PAM) Solutions Market – Revenue and Forecast Analysis – by Enterprise Size
11.4.6 Asia Pacific: Privileged Access Management (PAM) Solutions Market Breakdown, by Industry Vertical
11.4.6.1 Asia Pacific: Privileged Access Management (PAM) Solutions Market – Revenue and Forecast Analysis – by Industry Vertical
11.4.7 Asia Pacific: Privileged Access Management (PAM) Solutions Market – Revenue and Forecast Analysis – by Country
11.4.7.1 Asia Pacific: Privileged Access Management (PAM) Solutions Market – Revenue and Forecast Analysis – by Country
11.4.7.2 Australia: Privileged Access Management (PAM) Solutions Market – Revenue and Forecast to 2031 (US$ Million)
11.4.7.2.1 Australia: Privileged Access Management (PAM) Solutions Market Breakdown, by Offering
11.4.7.2.2 Australia: Privileged Access Management (PAM) Solutions Market Breakdown, by Deployment
11.4.7.2.3 Australia: Privileged Access Management (PAM) Solutions Market Breakdown, by Enterprise Size
11.4.7.2.4 Australia: Privileged Access Management (PAM) Solutions Market Breakdown, by Industry Vertical
11.4.7.3 China: Privileged Access Management (PAM) Solutions Market – Revenue and Forecast to 2031 (US$ Million)
11.4.7.3.1 China: Privileged Access Management (PAM) Solutions Market Breakdown, by Offering
11.4.7.3.2 China: Privileged Access Management (PAM) Solutions Market Breakdown, by Deployment
11.4.7.3.3 China: Privileged Access Management (PAM) Solutions Market Breakdown, by Enterprise Size
11.4.7.3.4 China: Privileged Access Management (PAM) Solutions Market Breakdown, by Industry Vertical
11.4.7.4 India: Privileged Access Management (PAM) Solutions Market – Revenue and Forecast to 2031 (US$ Million)
11.4.7.4.1 India: Privileged Access Management (PAM) Solutions Market Breakdown, by Offering
11.4.7.4.2 India: Privileged Access Management (PAM) Solutions Market Breakdown, by Deployment
11.4.7.4.3 India: Privileged Access Management (PAM) Solutions Market Breakdown, by Enterprise Size
11.4.7.4.4 India: Privileged Access Management (PAM) Solutions Market Breakdown, by Industry Vertical
11.4.7.5 Japan: Privileged Access Management (PAM) Solutions Market – Revenue and Forecast to 2031 (US$ Million)
11.4.7.5.1 Japan: Privileged Access Management (PAM) Solutions Market Breakdown, by Offering
11.4.7.5.2 Japan: Privileged Access Management (PAM) Solutions Market Breakdown, by Deployment
11.4.7.5.3 Japan: Privileged Access Management (PAM) Solutions Market Breakdown, by Enterprise Size
11.4.7.5.4 Japan: Privileged Access Management (PAM) Solutions Market Breakdown, by Industry Vertical
11.4.7.6 South Korea: Privileged Access Management (PAM) Solutions Market – Revenue and Forecast to 2031 (US$ Million)
11.4.7.6.1 South Korea: Privileged Access Management (PAM) Solutions Market Breakdown, by Offering
11.4.7.6.2 South Korea: Privileged Access Management (PAM) Solutions Market Breakdown, by Deployment
11.4.7.6.3 South Korea: Privileged Access Management (PAM) Solutions Market Breakdown, by Enterprise Size
11.4.7.6.4 South Korea: Privileged Access Management (PAM) Solutions Market Breakdown, by Industry Vertical
11.4.7.7 Rest of APAC: Privileged Access Management (PAM) Solutions Market – Revenue and Forecast to 2031 (US$ Million)
11.4.7.7.1 Rest of APAC: Privileged Access Management (PAM) Solutions Market Breakdown, by Offering
11.4.7.7.2 Rest of APAC: Privileged Access Management (PAM) Solutions Market Breakdown, by Deployment
11.4.7.7.3 Rest of APAC: Privileged Access Management (PAM) Solutions Market Breakdown, by Enterprise Size
11.4.7.7.4 Rest of APAC: Privileged Access Management (PAM) Solutions Market Breakdown, by Industry Vertical
11.5 Middle East and Africa
11.5.1 Middle East and Africa Privileged Access Management (PAM) Solutions Market Overview
11.5.2 Middle East and Africa: Privileged Access Management (PAM) Solutions Market – Revenue and Forecast to 2031 (US$ Million)
11.5.3 Middle East and Africa: Privileged Access Management (PAM) Solutions Market Breakdown, by Offering
11.5.3.1 Middle East and Africa: Privileged Access Management (PAM) Solutions Market – Revenue and Forecast Analysis – by Offering
11.5.4 Middle East and Africa: Privileged Access Management (PAM) Solutions Market Breakdown, by Deployment
11.5.4.1 Middle East and Africa: Privileged Access Management (PAM) Solutions Market – Revenue and Forecast Analysis – by Deployment
11.5.5 Middle East and Africa: Privileged Access Management (PAM) Solutions Market Breakdown, by Enterprise Size
11.5.5.1 Middle East and Africa: Privileged Access Management (PAM) Solutions Market – Revenue and Forecast Analysis – by Enterprise Size
11.5.6 Middle East and Africa: Privileged Access Management (PAM) Solutions Market Breakdown, by Industry Vertical
11.5.6.1 Middle East and Africa: Privileged Access Management (PAM) Solutions Market – Revenue and Forecast Analysis – by Industry Vertical
11.5.7 Middle East and Africa: Privileged Access Management (PAM) Solutions Market – Revenue and Forecast Analysis – by Country
11.5.7.1 Middle East and Africa: Privileged Access Management (PAM) Solutions Market – Revenue and Forecast Analysis – by Country
11.5.7.2 South Africa: Privileged Access Management (PAM) Solutions Market – Revenue and Forecast to 2031 (US$ Million)
11.5.7.2.1 South Africa: Privileged Access Management (PAM) Solutions Market Breakdown, by Offering
11.5.7.2.2 South Africa: Privileged Access Management (PAM) Solutions Market Breakdown, by Deployment
11.5.7.2.3 South Africa: Privileged Access Management (PAM) Solutions Market Breakdown, by Enterprise Size
11.5.7.2.4 South Africa: Privileged Access Management (PAM) Solutions Market Breakdown, by Industry Vertical
11.5.7.3 Saudi Arabia: Privileged Access Management (PAM) Solutions Market – Revenue and Forecast to 2031 (US$ Million)
11.5.7.3.1 Saudi Arabia: Privileged Access Management (PAM) Solutions Market Breakdown, by Offering
11.5.7.3.2 Saudi Arabia: Privileged Access Management (PAM) Solutions Market Breakdown, by Deployment
11.5.7.3.3 Saudi Arabia: Privileged Access Management (PAM) Solutions Market Breakdown, by Enterprise Size
11.5.7.3.4 Saudi Arabia: Privileged Access Management (PAM) Solutions Market Breakdown, by Industry Vertical
11.5.7.4 United Arab Emirates: Privileged Access Management (PAM) Solutions Market – Revenue and Forecast to 2031 (US$ Million)
11.5.7.4.1 United Arab Emirates: Privileged Access Management (PAM) Solutions Market Breakdown, by Offering
11.5.7.4.2 United Arab Emirates: Privileged Access Management (PAM) Solutions Market Breakdown, by Deployment
11.5.7.4.3 United Arab Emirates: Privileged Access Management (PAM) Solutions Market Breakdown, by Enterprise Size
11.5.7.4.4 United Arab Emirates: Privileged Access Management (PAM) Solutions Market Breakdown, by Industry Vertical
11.5.7.5 Rest of Middle East and Africa: Privileged Access Management (PAM) Solutions Market – Revenue and Forecast to 2031 (US$ Million)
11.5.7.5.1 Rest of Middle East and Africa: Privileged Access Management (PAM) Solutions Market Breakdown, by Offering
11.5.7.5.2 Rest of Middle East and Africa: Privileged Access Management (PAM) Solutions Market Breakdown, by Deployment
11.5.7.5.3 Rest of Middle East and Africa: Privileged Access Management (PAM) Solutions Market Breakdown, by Enterprise Size
11.5.7.5.4 Rest of Middle East and Africa: Privileged Access Management (PAM) Solutions Market Breakdown, by Industry Vertical
11.6 South and Central America
11.6.1 South and Central America Privileged Access Management (PAM) Solutions Market Overview
11.6.2 South and Central America: Privileged Access Management (PAM) Solutions Market – Revenue and Forecast to 2031 (US$ Million)
11.6.3 South and Central America: Privileged Access Management (PAM) Solutions Market Breakdown, by Offering
11.6.3.1 South and Central America: Privileged Access Management (PAM) Solutions Market – Revenue and Forecast Analysis – by Offering
11.6.4 South and Central America: Privileged Access Management (PAM) Solutions Market Breakdown, by Deployment
11.6.4.1 South and Central America: Privileged Access Management (PAM) Solutions Market – Revenue and Forecast Analysis – by Deployment
11.6.5 South and Central America: Privileged Access Management (PAM) Solutions Market Breakdown, by Enterprise Size
11.6.5.1 South and Central America: Privileged Access Management (PAM) Solutions Market – Revenue and Forecast Analysis – by Enterprise Size
11.6.6 South and Central America: Privileged Access Management (PAM) Solutions Market Breakdown, by Industry Vertical
11.6.6.1 South and Central America: Privileged Access Management (PAM) Solutions Market – Revenue and Forecast Analysis – by Industry Vertical
11.6.7 South and Central America: Privileged Access Management (PAM) Solutions Market – Revenue and Forecast Analysis – by Country
11.6.7.1 South and Central America: Privileged Access Management (PAM) Solutions Market – Revenue and Forecast Analysis – by Country
11.6.7.2 Brazil: Privileged Access Management (PAM) Solutions Market – Revenue and Forecast to 2031 (US$ Million)
11.6.7.2.1 Brazil: Privileged Access Management (PAM) Solutions Market Breakdown, by Offering
11.6.7.2.2 Brazil: Privileged Access Management (PAM) Solutions Market Breakdown, by Deployment
11.6.7.2.3 Brazil: Privileged Access Management (PAM) Solutions Market Breakdown, by Enterprise Size
11.6.7.2.4 Brazil: Privileged Access Management (PAM) Solutions Market Breakdown, by Industry Vertical
11.6.7.3 Argentina: Privileged Access Management (PAM) Solutions Market – Revenue and Forecast to 2031 (US$ Million)
11.6.7.3.1 Argentina: Privileged Access Management (PAM) Solutions Market Breakdown, by Offering
11.6.7.3.2 Argentina: Privileged Access Management (PAM) Solutions Market Breakdown, by Deployment
11.6.7.3.3 Argentina: Privileged Access Management (PAM) Solutions Market Breakdown, by Enterprise Size
11.6.7.3.4 Argentina: Privileged Access Management (PAM) Solutions Market Breakdown, by Industry Vertical
11.6.7.4 Rest of South and Central America: Privileged Access Management (PAM) Solutions Market – Revenue and Forecast to 2031 (US$ Million)
11.6.7.4.1 Rest of South and Central America: Privileged Access Management (PAM) Solutions Market Breakdown, by Offering
11.6.7.4.2 Rest of South and Central America: Privileged Access Management (PAM) Solutions Market Breakdown, by Deployment
11.6.7.4.3 Rest of South and Central America: Privileged Access Management (PAM) Solutions Market Breakdown, by Enterprise Size
11.6.7.4.4 Rest of South and Central America: Privileged Access Management (PAM) Solutions Market Breakdown, by Industry Vertical
12. Competitive Landscape
12.1 Heat Map Analysis by Key Players
12.2 Company Positioning & Concentration
13. Industry Landscape
13.1 Overview
13.2 Market Initiative
13.3 Product Development
13.4 Mergers & Acquisitions
14. Company Profiles
14.1 Broadcom Inc
14.1.1 Key Facts
14.1.2 Business Description
14.1.3 Products and Services
14.1.4 Financial Overview
14.1.5 SWOT Analysis
14.1.6 Key Developments
14.2 CyberArk Software Ltd.
14.2.1 Key Facts
14.2.2 Business Description
14.2.3 Products and Services
14.2.4 Financial Overview
14.2.5 SWOT Analysis
14.2.6 Key Developments
14.3 International Business Machines Corp
14.3.1 Key Facts
14.3.2 Business Description
14.3.3 Products and Services
14.3.4 Financial Overview
14.3.5 SWOT Analysis
14.3.6 Key Developments
14.4 Okta Inc
14.4.1 Key Facts
14.4.2 Business Description
14.4.3 Products and Services
14.4.4 Financial Overview
14.4.5 SWOT Analysis
14.4.6 Key Developments
14.5 One Identity LLC.
14.5.1 Key Facts
14.5.2 Business Description
14.5.3 Products and Services
14.5.4 Financial Overview
14.5.5 SWOT Analysis
14.5.6 Key Developments
14.6 Delinea Inc
14.6.1 Key Facts
14.6.2 Business Description
14.6.3 Products and Services
14.6.4 Financial Overview
14.6.5 SWOT Analysis
14.6.6 Key Developments
14.7 BeyondTrust Corporation
14.7.1 Key Facts
14.7.2 Business Description
14.7.3 Products and Services
14.7.4 Financial Overview
14.7.5 SWOT Analysis
14.7.6 Key Developments
14.8 Microsoft Corp
14.8.1 Key Facts
14.8.2 Business Description
14.8.3 Products and Services
14.8.4 Financial Overview
14.8.5 SWOT Analysis
14.8.6 Key Developments
14.9 Fortinet Inc
14.9.1 Key Facts
14.9.2 Business Description
14.9.3 Products and Services
14.9.4 Financial Overview
14.9.5 SWOT Analysis
14.9.6 Key Developments
14.10 Persistent Systems Ltd
14.10.1 Key Facts
14.10.2 Business Description
14.10.3 Products and Services
14.10.4 Financial Overview
14.10.5 SWOT Analysis
14.10.6 Key Developments
15. Appendix
15.1 Word Index
15.2 About The Insight Partners
List of Tables
Table 1. Privileged Access Management (PAM) Solutions Market Segmentation
Table 2. List of Vendors
Table 3. Privileged Access Management (PAM) Solutions Market – Revenue and Forecast to 2031 (US$ Million)
Table 4. Privileged Access Management (PAM) Solutions Market – Revenue and Forecast to 2031 (US$ Million) – by Offering
Table 5. Privileged Access Management (PAM) Solutions Market – Revenue and Forecast to 2031 (US$ Million) – by Deployment
Table 6. Privileged Access Management (PAM) Solutions Market – Revenue and Forecast to 2031 (US$ Million) – by Enterprise Size
Table 7. Privileged Access Management (PAM) Solutions Market – Revenue and Forecast to 2031 (US$ Million) – by Industry Vertical
Table 8. North America: Privileged Access Management (PAM) Solutions Market – Revenue and Forecast to 2031 (US$ Million) – by Offering
Table 9. North America: Privileged Access Management (PAM) Solutions Market – Revenue and Forecast to 2031 (US$ Million) – by Deployment
Table 10. North America: Privileged Access Management (PAM) Solutions Market – Revenue and Forecast to 2031 (US$ Million) – by Enterprise Size
Table 11. North America: Privileged Access Management (PAM) Solutions Market – Revenue and Forecast to 2031 (US$ Million) – by Industry Vertical
Table 12. North America: Privileged Access Management (PAM) Solutions Market – Revenue and Forecast to 2031 (US$ Million) – by Country
Table 13. United States: Privileged Access Management (PAM) Solutions Market – Revenue and Forecast to 2031(US$ Million) – by Offering
Table 14. United States: Privileged Access Management (PAM) Solutions Market – Revenue and Forecast to 2031 (US$ Million) – by Deployment
Table 15. United States: Privileged Access Management (PAM) Solutions Market – Revenue and Forecast to 2031 (US$ Million) – by Enterprise Size
Table 16. United States: Privileged Access Management (PAM) Solutions Market – Revenue and Forecast to 2031 (US$ Million) – by Industry Vertical
Table 17. Canada: Privileged Access Management (PAM) Solutions Market – Revenue and Forecast to 2031(US$ Million) – by Offering
Table 18. Canada: Privileged Access Management (PAM) Solutions Market – Revenue and Forecast to 2031(US$ Million) – by Deployment
Table 19. Canada: Privileged Access Management (PAM) Solutions Market – Revenue and Forecast to 2031(US$ Million) – by Enterprise Size
Table 20. Canada: Privileged Access Management (PAM) Solutions Market – Revenue and Forecast to 2031(US$ Million) – by Industry Vertical
Table 21. Mexico: Privileged Access Management (PAM) Solutions Market – Revenue and Forecast to 2031(US$ Million) – by Offering
Table 22. Mexico: Privileged Access Management (PAM) Solutions Market – Revenue and Forecast to 2031(US$ Million) – by Deployment
Table 23. Mexico: Privileged Access Management (PAM) Solutions Market – Revenue and Forecast to 2031(US$ Million) – by Enterprise Size
Table 24. Mexico: Privileged Access Management (PAM) Solutions Market – Revenue and Forecast to 2031(US$ Million) – by Industry Vertical
Table 25. Europe: Privileged Access Management (PAM) Solutions Market – Revenue and Forecast to 2031(US$ Million) – by Offering
Table 26. Europe: Privileged Access Management (PAM) Solutions Market – Revenue and Forecast to 2031(US$ Million) – by Deployment
Table 27. Europe: Privileged Access Management (PAM) Solutions Market – Revenue and Forecast to 2031(US$ Million) – by Enterprise Size
Table 28. Europe: Privileged Access Management (PAM) Solutions Market – Revenue and Forecast to 2031(US$ Million) – by Industry Vertical
Table 29. Europe: Privileged Access Management (PAM) Solutions Market – Revenue and Forecast to 2031(US$ Million) – by Country
Table 30. Germany: Privileged Access Management (PAM) Solutions Market – Revenue and Forecast to 2031(US$ Million) by Offering
Table 31. Germany: Privileged Access Management (PAM) Solutions Market – Revenue and Forecast to 2031(US$ Million) – by Deployment
Table 32. Germany: Privileged Access Management (PAM) Solutions Market – Revenue and Forecast to 2031(US$ Million) – by Enterprise Size
Table 33. Germany: Privileged Access Management (PAM) Solutions Market – Revenue and Forecast to 2031(US$ Million) – by Industry Vertical
Table 34. United Kingdom: Privileged Access Management (PAM) Solutions Market – Revenue and Forecast to 2031 (US$ Million) – by Offering
Table 35. United Kingdom: Privileged Access Management (PAM) Solutions Market – Revenue and Forecast to 2031 (US$ Million) – by Deployment
Table 36. United Kingdom: Privileged Access Management (PAM) Solutions Market – Revenue and Forecast to 2031(US$ Million) – by Enterprise Size
Table 37. United Kingdom: Privileged Access Management (PAM) Solutions Market – Revenue and Forecast to 2031 (US$ Million) – by Industry Vertical
Table 38. France: Privileged Access Management (PAM) Solutions Market – Revenue and Forecast to 2031(US$ Million) – by Offering
Table 39. France: Privileged Access Management (PAM) Solutions Market – Revenue and Forecast to 2031(US$ Million) – by Deployment
Table 40. France: Privileged Access Management (PAM) Solutions Market – Revenue and Forecast to 2031(US$ Million) – by Enterprise Size
Table 41. France: Privileged Access Management (PAM) Solutions Market – Revenue and Forecast to 2031(US$ Million) – by Industry Vertical
Table 42. Italy: Privileged Access Management (PAM) Solutions Market – Revenue and Forecast to 2031(US$ Million) – by Offering
Table 43. Italy: Privileged Access Management (PAM) Solutions Market – Revenue and Forecast to 2031(US$ Million) – by Deployment
Table 44. Italy: Privileged Access Management (PAM) Solutions Market – Revenue and Forecast to 2031(US$ Million) – by Enterprise Size
Table 45. Italy: Privileged Access Management (PAM) Solutions Market – Revenue and Forecast to 2031(US$ Million) – by Industry Vertical
Table 46. Russia: Privileged Access Management (PAM) Solutions Market – Revenue and Forecast to 2031(US$ Million) – by Offering
Table 47. Russia: Privileged Access Management (PAM) Solutions Market – Revenue and Forecast to 2031(US$ Million) – by Deployment
Table 48. Russia: Privileged Access Management (PAM) Solutions Market – Revenue and Forecast to 2031(US$ Million) – by Enterprise Size
Table 49. Russia: Privileged Access Management (PAM) Solutions Market – Revenue and Forecast to 2031(US$ Million) – by Industry Vertical
Table 50. Rest of Europe: Privileged Access Management (PAM) Solutions Market – Revenue and Forecast to 2031 (US$ Million) – by Offering
Table 51. Rest of Europe: Privileged Access Management (PAM) Solutions Market – Revenue and Forecast to 2031 (US$ Million) – by Deployment
Table 52. Rest of Europe: Privileged Access Management (PAM) Solutions Market – Revenue and Forecast to 2031(US$ Million) – by Enterprise Size
Table 53. Rest of Europe: Privileged Access Management (PAM) Solutions Market – Revenue and Forecast to 2031(US$ Million) – by Industry Vertical
Table 54. Asia Pacific: Privileged Access Management (PAM) Solutions Market – Revenue and Forecast to 2031 (US$ Million) – by Offering
Table 55. Asia Pacific: Privileged Access Management (PAM) Solutions Market – Revenue and Forecast to 2031 (US$ Million) – by Deployment
Table 56. Asia Pacific: Privileged Access Management (PAM) Solutions Market – Revenue and Forecast to 2031(US$ Million) – by Enterprise Size
Table 57. Asia Pacific: Privileged Access Management (PAM) Solutions Market – Revenue and Forecast to 2031 (US$ Million) – by Industry Vertical
Table 58. Asia Pacific: Privileged Access Management (PAM) Solutions Market – Revenue and Forecast to 2031 (US$ Million) – by Country
Table 59. Australia: Privileged Access Management (PAM) Solutions Market – Revenue and Forecast to 2031(US$ Million) by Offering
Table 60. Australia: Privileged Access Management (PAM) Solutions Market – Revenue and Forecast to 2031(US$ Million) – by Deployment
Table 61. Australia: Privileged Access Management (PAM) Solutions Market – Revenue and Forecast to 2031(US$ Million) – by Enterprise Size
Table 62. Australia: Privileged Access Management (PAM) Solutions Market – Revenue and Forecast to 2031(US$ Million) – by Industry Vertical
Table 63. China: Privileged Access Management (PAM) Solutions Market – Revenue and Forecast to 2031(US$ Million) – by Offering
Table 64. China: Privileged Access Management (PAM) Solutions Market – Revenue and Forecast to 2031(US$ Million) – by Deployment
Table 65. China: Privileged Access Management (PAM) Solutions Market – Revenue and Forecast to 2031(US$ Million) – by Enterprise Size
Table 66. China: Privileged Access Management (PAM) Solutions Market – Revenue and Forecast to 2031(US$ Million) – by Industry Vertical
Table 67. India: Privileged Access Management (PAM) Solutions Market – Revenue and Forecast to 2031(US$ Million) – by Offering
Table 68. India: Privileged Access Management (PAM) Solutions Market – Revenue and Forecast to 2031(US$ Million) – by Deployment
Table 69. India: Privileged Access Management (PAM) Solutions Market – Revenue and Forecast to 2031(US$ Million) – by Enterprise Size
Table 70. India: Privileged Access Management (PAM) Solutions Market – Revenue and Forecast to 2031(US$ Million) – by Industry Vertical
Table 71. Japan: Privileged Access Management (PAM) Solutions Market – Revenue and Forecast to 2031(US$ Million) – by Offering
Table 72. Japan: Privileged Access Management (PAM) Solutions Market – Revenue and Forecast to 2031(US$ Million) – by Deployment
Table 73. Japan: Privileged Access Management (PAM) Solutions Market – Revenue and Forecast to 2031(US$ Million) – by Enterprise Size
Table 74. Japan: Privileged Access Management (PAM) Solutions Market – Revenue and Forecast to 2031(US$ Million) – by Industry Vertical
Table 75. South Korea: Privileged Access Management (PAM) Solutions Market – Revenue and Forecast to 2031 (US$ Million) – by Offering
Table 76. South Korea: Privileged Access Management (PAM) Solutions Market – Revenue and Forecast to 2031 (US$ Million) – by Deployment
Table 77. South Korea: Privileged Access Management (PAM) Solutions Market – Revenue and Forecast to 2031 (US$ Million) – by Enterprise Size
Table 78. South Korea: Privileged Access Management (PAM) Solutions Market – Revenue and Forecast to 2031 (US$ Million) – by Industry Vertical
Table 79. Rest of APAC: Privileged Access Management (PAM) Solutions Market – Revenue and Forecast to 2031 (US$ Million) – by Offering
Table 80. Rest of APAC: Privileged Access Management (PAM) Solutions Market – Revenue and Forecast to 2031 (US$ Million) – by Deployment
Table 81. Rest of APAC: Privileged Access Management (PAM) Solutions Market – Revenue and Forecast to 2031(US$ Million) – by Enterprise Size
Table 82. Rest of APAC: Privileged Access Management (PAM) Solutions Market – Revenue and Forecast to 2031 (US$ Million) – by Industry Vertical
Table 83. Middle East and Africa: Privileged Access Management (PAM) Solutions Market – Revenue and Forecast to 2031(US$ Million) – by Offering
Table 84. Middle East and Africa: Privileged Access Management (PAM) Solutions Market – Revenue and Forecast to 2031(US$ Million) – by Deployment
Table 85. Middle East and Africa: Privileged Access Management (PAM) Solutions Market – Revenue and Forecast to 2031(US$ Million) – by Enterprise Size
Table 86. Middle East and Africa: Privileged Access Management (PAM) Solutions Market – Revenue and Forecast to 2031(US$ Million) – by Industry Vertical
Table 87. Middle East and Africa: Privileged Access Management (PAM) Solutions Market – Revenue and Forecast to 2031(US$ Million) – by Country
Table 88. South Africa: Privileged Access Management (PAM) Solutions Market – Revenue and Forecast to 2031 (US$ Million) – by Offering
Table 89. South Africa: Privileged Access Management (PAM) Solutions Market – Revenue and Forecast to 2031 (US$ Million) – by Deployment
Table 90. South Africa: Privileged Access Management (PAM) Solutions Market – Revenue and Forecast to 2031 (US$ Million) – by Enterprise Size
Table 91. South Africa: Privileged Access Management (PAM) Solutions Market – Revenue and Forecast to 2031 (US$ Million) – by Industry Vertical
Table 92. Saudi Arabia: Privileged Access Management (PAM) Solutions Market – Revenue and Forecast to 2031 (US$ Million) – by Offering
Table 93. Saudi Arabia: Privileged Access Management (PAM) Solutions Market – Revenue and Forecast to 2031 (US$ Million) – by Deployment
Table 94. Saudi Arabia: Privileged Access Management (PAM) Solutions Market – Revenue and Forecast to 2031 (US$ Million) – by Enterprise Size
Table 95. Saudi Arabia: Privileged Access Management (PAM) Solutions Market – Revenue and Forecast to 2031(US$ Million) – by Industry Vertical
Table 96. United Arab Emirates: Privileged Access Management (PAM) Solutions Market – Revenue and Forecast to 2031(US$ Million) – by Offering
Table 97. United Arab Emirates: Privileged Access Management (PAM) Solutions Market – Revenue and Forecast to 2031(US$ Million) – by Deployment
Table 98. United Arab Emirates: Privileged Access Management (PAM) Solutions Market – Revenue and Forecast to 2031(US$ Million) – by Enterprise Size
Table 99. United Arab Emirates: Privileged Access Management (PAM) Solutions Market – Revenue and Forecast to 2031(US$ Million) – by Industry Vertical
Table 100. Rest of Middle East and Africa: Privileged Access Management (PAM) Solutions Market – Revenue and Forecast to 2031(US$ Million) – by Offering
Table 101. Rest of Middle East and Africa: Privileged Access Management (PAM) Solutions Market – Revenue and Forecast to 2031(US$ Million) – by Deployment
Table 102. Rest of Middle East and Africa: Privileged Access Management (PAM) Solutions Market – Revenue and Forecast to 2031(US$ Million) – by Enterprise Size
Table 103. Rest of Middle East and Africa: Privileged Access Management (PAM) Solutions Market – Revenue and Forecast to 2031(US$ Million) – by Industry Vertical
Table 104. South and Central America: Privileged Access Management (PAM) Solutions Market – Revenue and Forecast to 2031(US$ Million) – by Offering
Table 105. South and Central America: Privileged Access Management (PAM) Solutions Market – Revenue and Forecast to 2031(US$ Million) – by Deployment
Table 106. South and Central America: Privileged Access Management (PAM) Solutions Market – Revenue and Forecast to 2031(US$ Million) – by Enterprise Size
Table 107. South and Central America: Privileged Access Management (PAM) Solutions Market – Revenue and Forecast to 2031(US$ Million) – by Industry Vertical
Table 108. South and Central America: Privileged Access Management (PAM) Solutions Market – Revenue and Forecast to 2031(US$ Million) – by Country
Table 109. Brazil: Privileged Access Management (PAM) Solutions Market – Revenue and Forecast to 2031(US$ Million) – by Offering
Table 110. Brazil: Privileged Access Management (PAM) Solutions Market – Revenue and Forecast to 2031(US$ Million) – by Deployment
Table 111. Brazil: Privileged Access Management (PAM) Solutions Market – Revenue and Forecast to 2031(US$ Million) – by Enterprise Size
Table 112. Brazil: Privileged Access Management (PAM) Solutions Market – Revenue and Forecast to 2031(US$ Million) – by Industry Vertical
Table 113. Argentina: Privileged Access Management (PAM) Solutions Market – Revenue and Forecast to 2031(US$ Million) – by Offering
Table 114. Argentina: Privileged Access Management (PAM) Solutions Market – Revenue and Forecast to 2031 (US$ Million) – by Deployment
Table 115. Argentina: Privileged Access Management (PAM) Solutions Market – Revenue and Forecast to 2031 (US$ Million) – by Enterprise Size
Table 116. Argentina: Privileged Access Management (PAM) Solutions Market – Revenue and Forecast to 2031(US$ Million) – by Industry Vertical
Table 117. Rest of South and Central America: Privileged Access Management (PAM) Solutions Market – Revenue and Forecast to 2031(US$ Million) – by Offering
Table 118. Rest of South and Central America: Privileged Access Management (PAM) Solutions Market – Revenue and Forecast to 2031(US$ Million) – by Deployment
Table 119. Rest of South and Central America: Privileged Access Management (PAM) Solutions Market – Revenue and Forecast to 2031(US$ Million) – by Enterprise Size
Table 120. Rest of South and Central America: Privileged Access Management (PAM) Solutions Market – Revenue and Forecast to 2031(US$ Million) – by Industry Vertical
Table 121. Company Positioning & Concentration
Table 122. List of Abbreviation
List of Figures
Figure 1. Privileged Access Management (PAM) Solutions Market Segmentation, by Geography
Figure 2. PEST Analysis
Figure 3. Impact Analysis of Drivers and Restraints
Figure 4. Privileged Access Management (PAM) Solutions Market Revenue (US$ Million), 2021–2031
Figure 5. Privileged Access Management (PAM) Solutions Market Share (%) – by Offering (2023 and 2031)
Figure 6. Solutions: Privileged Access Management (PAM) Solutions Market – Revenue and Forecast to 2031 (US$ Million)
Figure 7. Services: Privileged Access Management (PAM) Solutions Market – Revenue and Forecast to 2031 (US$ Million)
Figure 8. Privileged Access Management (PAM) Solutions Market Share (%) – by Deployment (2023 and 2031)
Figure 9. On Premise: Privileged Access Management (PAM) Solutions Market – Revenue and Forecast to 2031 (US$ Million)
Figure 10. Cloud: Privileged Access Management (PAM) Solutions Market – Revenue and Forecast to 2031 (US$ Million)
Figure 11. Privileged Access Management (PAM) Solutions Market Share (%) – by Enterprise Size (2023 and 2031)
Figure 12. Large Enterprises: Privileged Access Management (PAM) Solutions Market – Revenue and Forecast to 2031 (US$ Million)
Figure 13. SMEs: Privileged Access Management (PAM) Solutions Market – Revenue and Forecast to 2031 (US$ Million)
Figure 14. Privileged Access Management (PAM) Solutions Market Share (%) – by Industry Vertical (2023 and 2031)
Figure 15. BFSI: Privileged Access Management (PAM) Solutions Market – Revenue and Forecast to 2031 (US$ Million)
Figure 16. IT and Telecom: Privileged Access Management (PAM) Solutions Market – Revenue and Forecast to 2031 (US$ Million)
Figure 17. Healthcare: Privileged Access Management (PAM) Solutions Market – Revenue and Forecast to 2031 (US$ Million)
Figure 18. Energy and Utility: Privileged Access Management (PAM) Solutions Market – Revenue and Forecast to 2031 (US$ Million)
Figure 19. Retail and Ecommerce: Privileged Access Management (PAM) Solutions Market – Revenue and Forecast to 2031 (US$ Million)
Figure 20. Manufacturing: Privileged Access Management (PAM) Solutions Market – Revenue and Forecast to 2031 (US$ Million)
Figure 21. Government and Defense: Privileged Access Management (PAM) Solutions Market – Revenue and Forecast to 2031 (US$ Million)
Figure 22. Others: Privileged Access Management (PAM) Solutions Market – Revenue and Forecast to 2031 (US$ Million)
Figure 23. Privileged Access Management (PAM) Solutions Market Breakdown by Region, 2023 and 2031 (%)
Figure 24. North America: Privileged Access Management (PAM) Solutions Market – Revenue and Forecast to 2031(US$ Million)
Figure 25. North America: Privileged Access Management (PAM) Solutions Market Breakdown, by Offering (2023 and 2031)
Figure 26. North America: Privileged Access Management (PAM) Solutions Market Breakdown, by Deployment (2023 and 2031)
Figure 27. North America: Privileged Access Management (PAM) Solutions Market Breakdown, by Enterprise Size (2023 and 2031)
Figure 28. North America: Privileged Access Management (PAM) Solutions Market Breakdown, by Industry Vertical (2023 and 2031)
Figure 29. North America: Privileged Access Management (PAM) Solutions Market Breakdown, by Key Countries, 2023 and 2031 (%)
Figure 30. United States: Privileged Access Management (PAM) Solutions Market – Revenue and Forecast to 2031 (US$ Million)
Figure 31. Canada: Privileged Access Management (PAM) Solutions Market – Revenue and Forecast to 2031(US$ Million)
Figure 32. Mexico: Privileged Access Management (PAM) Solutions Market – Revenue and Forecast to 2031(US$ Million)
Figure 33. Europe: Privileged Access Management (PAM) Solutions Market – Revenue and Forecast to 2031(US$ Million)
Figure 34. Europe: Privileged Access Management (PAM) Solutions Market Breakdown, by Offering (2023 and 2031)
Figure 35. Europe: Privileged Access Management (PAM) Solutions Market Breakdown, by Deployment (2023 and 2031)
Figure 36. Europe: Privileged Access Management (PAM) Solutions Market Breakdown, by Enterprise Size (2023 and 2031)
Figure 37. Europe: Privileged Access Management (PAM) Solutions Market Breakdown, by Industry Vertical (2023 and 2031)
Figure 38. Europe: Privileged Access Management (PAM) Solutions Market Breakdown, by Key Countries, 2023 and 2031 (%)
Figure 39. Germany: Privileged Access Management (PAM) Solutions Market – Revenue and Forecast to 2031(US$ Million)
Figure 40. United Kingdom: Privileged Access Management (PAM) Solutions Market – Revenue and Forecast to 2031 (US$ Million)
Figure 41. France: Privileged Access Management (PAM) Solutions Market – Revenue and Forecast to 2031(US$ Million)
Figure 42. Italy: Privileged Access Management (PAM) Solutions Market – Revenue and Forecast to 2031(US$ Million)
Figure 43. Russia: Privileged Access Management (PAM) Solutions Market – Revenue and Forecast to 2031(US$ Million)
Figure 44. Rest of Europe: Privileged Access Management (PAM) Solutions Market – Revenue and Forecast to 2031 (US$ Million)
Figure 45. Asia Pacific: Privileged Access Management (PAM) Solutions Market – Revenue and Forecast to 2031 (US$ Million)
Figure 46. Asia Pacific: Privileged Access Management (PAM) Solutions Market Breakdown, by Offering (2023 and 2031)
Figure 47. Asia Pacific: Privileged Access Management (PAM) Solutions Market Breakdown, by Deployment (2023 and 2031)
Figure 48. Asia Pacific: Privileged Access Management (PAM) Solutions Market Breakdown, by Enterprise Size (2023 and 2031)
Figure 49. Asia Pacific: Privileged Access Management (PAM) Solutions Market Breakdown, by Industry Vertical (2023 and 2031)
Figure 50. Asia Pacific: Privileged Access Management (PAM) Solutions Market Breakdown, by Key Countries, 2023 and 2031 (%)
Figure 51. Australia: Privileged Access Management (PAM) Solutions Market – Revenue and Forecast to 2031(US$ Million)
Figure 52. China: Privileged Access Management (PAM) Solutions Market – Revenue and Forecast to 2031(US$ Million)
Figure 53. India: Privileged Access Management (PAM) Solutions Market – Revenue and Forecast to 2031(US$ Million)
Figure 54. Japan: Privileged Access Management (PAM) Solutions Market – Revenue and Forecast to 2031(US$ Million)
Figure 55. South Korea: Privileged Access Management (PAM) Solutions Market – Revenue and Forecast to 2031 (US$ Million)
Figure 56. Rest of APAC: Privileged Access Management (PAM) Solutions Market – Revenue and Forecast to 2031 (US$ Million)
Figure 57. Middle East and Africa: Privileged Access Management (PAM) Solutions Market – Revenue and Forecast to 2031(US$ Million)
Figure 58. Middle East and Africa: Privileged Access Management (PAM) Solutions Market Breakdown, by Offering (2023 and 2031)
Figure 59. Middle East and Africa: Privileged Access Management (PAM) Solutions Market Breakdown, by Deployment (2023 and 2031)
Figure 60. Middle East and Africa: Privileged Access Management (PAM) Solutions Market Breakdown, by Enterprise Size (2023 and 2031)
Figure 61. Middle East and Africa: Privileged Access Management (PAM) Solutions Market Breakdown, by Industry Vertical (2023 and 2031)
Figure 62. Middle East and Africa: Privileged Access Management (PAM) Solutions Market Breakdown, by Key Countries, 2023 and 2031 (%)
Figure 63. South Africa: Privileged Access Management (PAM) Solutions Market – Revenue and Forecast to 2031 (US$ Million)
Figure 64. Saudi Arabia: Privileged Access Management (PAM) Solutions Market – Revenue and Forecast to 2031 (US$ Million)
Figure 65. United Arab Emirates: Privileged Access Management (PAM) Solutions Market – Revenue and Forecast to 2031(US$ Million)
Figure 66. Rest of Middle East and Africa: Privileged Access Management (PAM) Solutions Market – Revenue and Forecast to 2031(US$ Million)
Figure 67. South and Central America: Privileged Access Management (PAM) Solutions Market – Revenue and Forecast to 2031(US$ Million)
Figure 68. South and Central America: Privileged Access Management (PAM) Solutions Market Breakdown, by Offering (2023 and 2031)
Figure 69. South and Central America: Privileged Access Management (PAM) Solutions Market Breakdown, by Deployment (2023 and 2031)
Figure 70. South and Central America: Privileged Access Management (PAM) Solutions Market Breakdown, by Enterprise Size (2023 and 2031)
Figure 71. South and Central America: Privileged Access Management (PAM) Solutions Market Breakdown, by Industry Vertical (2023 and 2031)
Figure 72. South and Central America: Privileged Access Management (PAM) Solutions Market Breakdown, by Key Countries, 2023 and 2031 (%)
Figure 73. Brazil: Privileged Access Management (PAM) Solutions Market – Revenue and Forecast to 2031(US$ Million)
Figure 74. Argentina: Privileged Access Management (PAM) Solutions Market – Revenue and Forecast to 2031 (US$ Million)
Figure 75. Rest of South and Central America: Privileged Access Management (PAM) Solutions Market – Revenue and Forecast to 2031(US$ Million)
Figure 76. Heat Map Analysis by Key Players
The List Oof Companies - Privileged Access Management (PAM) Solutions Market
- Broadcom Inc.
- CyberArk Software Ltd.
- International Business Machines Corp
- Okta Inc
- One Identity LLC.
- Delinea Inc.
- BeyondTrust Corporation
- Microsoft Corp
- Fortinet Inc.
- Persistent Systems Ltd.
The Insight Partners performs research in 4 major stages: Data Collection & Secondary Research, Primary Research, Data Analysis and Data Triangulation & Final Review.
- Data Collection and Secondary Research:
As a market research and consulting firm operating from a decade, we have published many reports and advised several clients across the globe. First step for any study will start with an assessment of currently available data and insights from existing reports. Further, historical and current market information is collected from Investor Presentations, Annual Reports, SEC Filings, etc., and other information related to company’s performance and market positioning are gathered from Paid Databases (Factiva, Hoovers, and Reuters) and various other publications available in public domain.
Several associations trade associates, technical forums, institutes, societies and organizations are accessed to gain technical as well as market related insights through their publications such as research papers, blogs and press releases related to the studies are referred to get cues about the market. Further, white papers, journals, magazines, and other news articles published in the last 3 years are scrutinized and analyzed to understand the current market trends.
- Primary Research:
The primarily interview analysis comprise of data obtained from industry participants interview and answers to survey questions gathered by in-house primary team.
For primary research, interviews are conducted with industry experts/CEOs/Marketing Managers/Sales Managers/VPs/Subject Matter Experts from both demand and supply side to get a 360-degree view of the market. The primary team conducts several interviews based on the complexity of the markets to understand the various market trends and dynamics which makes research more credible and precise.
A typical research interview fulfils the following functions:
- Provides first-hand information on the market size, market trends, growth trends, competitive landscape, and outlook
- Validates and strengthens in-house secondary research findings
- Develops the analysis team’s expertise and market understanding
Primary research involves email interactions and telephone interviews for each market, category, segment, and sub-segment across geographies. The participants who typically take part in such a process include, but are not limited to:
- Industry participants: VPs, business development managers, market intelligence managers and national sales managers
- Outside experts: Valuation experts, research analysts and key opinion leaders specializing in the electronics and semiconductor industry.
Below is the breakup of our primary respondents by company, designation, and region:

Once we receive the confirmation from primary research sources or primary respondents, we finalize the base year market estimation and forecast the data as per the macroeconomic and microeconomic factors assessed during data collection.
- Data Analysis:
Once data is validated through both secondary as well as primary respondents, we finalize the market estimations by hypothesis formulation and factor analysis at regional and country level.
- 3.1 Macro-Economic Factor Analysis:
We analyse macroeconomic indicators such the gross domestic product (GDP), increase in the demand for goods and services across industries, technological advancement, regional economic growth, governmental policies, the influence of COVID-19, PEST analysis, and other aspects. This analysis aids in setting benchmarks for various nations/regions and approximating market splits. Additionally, the general trend of the aforementioned components aid in determining the market's development possibilities.
- 3.2 Country Level Data:
Various factors that are especially aligned to the country are taken into account to determine the market size for a certain area and country, including the presence of vendors, such as headquarters and offices, the country's GDP, demand patterns, and industry growth. To comprehend the market dynamics for the nation, a number of growth variables, inhibitors, application areas, and current market trends are researched. The aforementioned elements aid in determining the country's overall market's growth potential.
- 3.3 Company Profile:
The “Table of Contents” is formulated by listing and analyzing more than 25 - 30 companies operating in the market ecosystem across geographies. However, we profile only 10 companies as a standard practice in our syndicate reports. These 10 companies comprise leading, emerging, and regional players. Nonetheless, our analysis is not restricted to the 10 listed companies, we also analyze other companies present in the market to develop a holistic view and understand the prevailing trends. The “Company Profiles” section in the report covers key facts, business description, products & services, financial information, SWOT analysis, and key developments. The financial information presented is extracted from the annual reports and official documents of the publicly listed companies. Upon collecting the information for the sections of respective companies, we verify them via various primary sources and then compile the data in respective company profiles. The company level information helps us in deriving the base number as well as in forecasting the market size.
- 3.4 Developing Base Number:
Aggregation of sales statistics (2020-2022) and macro-economic factor, and other secondary and primary research insights are utilized to arrive at base number and related market shares for 2022. The data gaps are identified in this step and relevant market data is analyzed, collected from paid primary interviews or databases. On finalizing the base year market size, forecasts are developed on the basis of macro-economic, industry and market growth factors and company level analysis.
- Data Triangulation and Final Review:
The market findings and base year market size calculations are validated from supply as well as demand side. Demand side validations are based on macro-economic factor analysis and benchmarks for respective regions and countries. In case of supply side validations, revenues of major companies are estimated (in case not available) based on industry benchmark, approximate number of employees, product portfolio, and primary interviews revenues are gathered. Further revenue from target product/service segment is assessed to avoid overshooting of market statistics. In case of heavy deviations between supply and demand side values, all thes steps are repeated to achieve synchronization.
We follow an iterative model, wherein we share our research findings with Subject Matter Experts (SME’s) and Key Opinion Leaders (KOLs) until consensus view of the market is not formulated – this model negates any drastic deviation in the opinions of experts. Only validated and universally acceptable research findings are quoted in our reports.
We have important check points that we use to validate our research findings – which we call – data triangulation, where we validate the information, we generate from secondary sources with primary interviews and then we re-validate with our internal data bases and Subject matter experts. This comprehensive model enables us to deliver high quality, reliable data in shortest possible time.
 Get Free Sample For