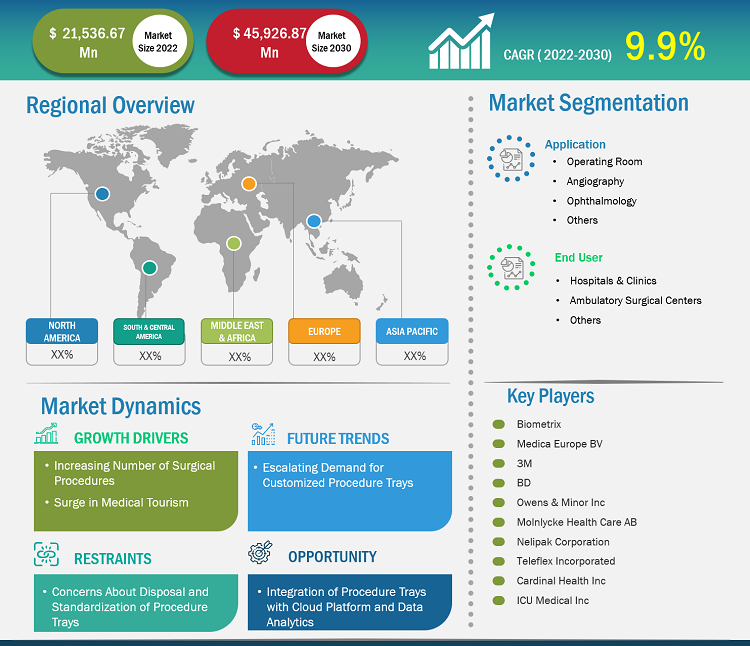
The procedure trays market was valued at US$ 21,536.67 million in 2022 and is expected to reach US$ 45,926.87 million by 2030. It is estimated to register a CAGR of 9.9% during 2022–2030. With the growing need for cost-effective products by hospitals and surgical centers, customized procedure trays are likely to remain a key trend in the market.
Procedure Trays Market Analysis
The increasing number of surgeries and surge in medical tourism are the key driving factors behind the market development. Furthermore, the integration of procedure trays with cloud platforms and data analytics has created growth opportunities for the market over the upcoming forecast period.
Procedure Trays Market Overview
The prevalence of health conditions such as cardiovascular diseases, obstructed labor, injuries, and malignancies trigger the need for surgical procedures. According to research by the World Health Organization (WHO), the number of cesarean sections continues to increase worldwide, accounting for more than one in five (21%) births. This number is expected to rise over the coming decade, with almost a third (29%) of all births likely to be by cesarean section by 2030. Advances in surgical, anesthetic, and critical care techniques have resulted in more of the growing elderly population undergoing surgical procedures. According to the US Census Board, about 13% of the total population in the US is over 65 years old, and it is estimated that this percentage will reach 20% by 2030. According to WHO, the world geriatric population is expected to reach 1.5 billion by 2050.
Customize Research To Suit Your Requirement
We can optimize and tailor the analysis and scope which is unmet through our standard offerings. This flexibility will help you gain the exact information needed for your business planning and decision making.
Procedure Trays Market: Strategic Insights
Market Size Value in US$ 21,536.67 million in 2022 Market Size Value by US$ 45,926.87 million by 2030 Growth rate CAGR of 9.9% from 2022 to 2030 Forecast Period 2022-2030 Base Year 2022

Mrinal
Have a question?
Mrinal will walk you through a 15-minute call to present the report’s content and answer all queries if you have any.
 Speak to Analyst
Customize Research To Suit Your Requirement
We can optimize and tailor the analysis and scope which is unmet through our standard offerings. This flexibility will help you gain the exact information needed for your business planning and decision making.
Procedure Trays Market: Strategic Insights
| Market Size Value in | US$ 21,536.67 million in 2022 |
| Market Size Value by | US$ 45,926.87 million by 2030 |
| Growth rate | CAGR of 9.9% from 2022 to 2030 |
| Forecast Period | 2022-2030 |
| Base Year | 2022 |
Mrinal
Have a question?
Mrinal will walk you through a 15-minute call to present the report’s content and answer all queries if you have any.
Speak to Analyst
Procedure Trays Market Drivers and Opportunities
Surge in Medical Tourism
Many countries are becoming popular destinations for health seekers. According to the Medical Tourism Association (MTA), ~14 million people travel to other countries for medical care yearly. Advancements in medical devices and non-invasive surgical procedures are the major factors responsible for increased medical tourism. According to the Centers for Disease Control and Prevention (CDC), millions of Americans travel abroad yearly for medical care. Medical tourism destinations for US citizens include Argentina, Brazil, Canada, Colombia, Costa Rica, Cuba, Dominican Republic, Ecuador, Germany, India, Malaysia, Mexico, Nicaragua, Peru, Singapore, and Thailand. The treatment categories pursued by US medical tourists include cancer treatment, dental care, fertility treatments, organ and tissue transplants, and various forms of surgery, including bariatric, cosmetic, and non-cosmetic (e.g., orthopedic) surgery. Further, cheaper treatments available for various medical conditions, such as knee replacements, dentistry, and cosmetics, in countries including Singapore, Thailand, and Dubai increase the potential of medical travel market value in these countries. According to the ASEAN Briefing, Singapore attracts 500,000 medical tourists annually, accounting for nearly 4% of total tourism revenue (US$ 1 billion), and 60% of those tourists come from Indonesia.
Integration of Procedure Trays with Cloud Platform and Data Analytics
With rapid developments in the healthcare IT sector, companies manufacturing procedure trays focus on harnessing advanced technologies to enhance the experience of using procedure trays. Procedure trays carry various instruments used in surgical procedures; however, a few instruments may not be used during the procedure. Each procedure tray can typically cost more than US$ 350,000, and having every type of set on the shelf at each surgical facility is not feasible. Hence, manufacturers generally loan them to hospitals. Once a procedure is executed, the hospital returns the instrument tray to the manufacturer for storage and redistribution to other hospitals. Each time a hospital returns a tray, the manufacturer must check for missing instruments and ensure they are correctly placed, cleaned, and fit for use in the following procedure. As this checking may become hectic for manufacturers, they are focused on using data analytics tools and cloud-based platforms to maintain the record of the instruments used during surgery. For instance, BD and Johnson & Johnson MedTech are collaborating with cloud-based companies to engineer a scalable solution to improve the tracking and checking of instruments in procedure trays. Thus, using cloud-based platforms and data analytics to maintain and streamline the data collected when procedure trays are in use creates opportunities for the market players.
Procedure Trays Market Report Segmentation Analysis
Key segments that contributed to the derivation of the procedure trays market analysis are product and end user.
- Based on application, the procedure trays market is segmented operating room, angiography, ophthalmology, and others. The operating room segment held a largest market share in 2022.
- Based on purchase mode, the procedure trays market is segmented by hospitals & clinics, ambulatory surgical centers, and others. The hospitals & clinics segment held a largest market share in 2022.
Procedure Trays Market Share Analysis by Geography
The geographic scope of the procedure trays market report is mainly divided into five regions: North America, Asia Pacific, Europe, Middle East & Africa, and South & Central America.
The presence of prominent market participants in the region is expected to help the region's growth. Moreover, an increasing aging population and the prevalence of chronic diseases, such as osteoporosis and heart-related problems, in the region, coupled with high awareness about healthcare and advanced surgical procedures, are likely to increase the demand for surgical procedures in North America. According to an article published by the International Osteoporosis Foundation, 44 million people in America above 50 will have osteoporosis by 2020. Regenexx says more than 7 million orthopedic surgeries were performed in 2021 in the US. According to the National Center for Health Statistics, more than 40 million surgeries are performed yearly, which is expected to grow exponentially. Furthermore, according to the American Psychological Association, the geriatric population in the country is currently at 46 million. It is supposed to double itself by 2060, which will increase the number of surgeries, coupled with technological advancements, and drive the procedure trays market growth.
Procedure Trays Market Report Scope
Procedure Trays Market News and Recent Developments
The Procedure Trays Market is evaluated by gathering qualitative and quantitative data post primary and secondary research, which includes important corporate publications, association data, and databases. A few of the developments in the procedure trays market are listed below:
- HealthpointCapital acquired of a majority stake in SteriCUBE Holdings, Inc. (Source: HealthpointCapital, Company Website, April 2024)
- ICU Medical Inc. acquired Smiths Medical from Smiths Group plc. The Smiths Medical business includes syringe and ambulatory infusion devices, vascular access, and vital care products. Combined with ICU Medical’s existing businesses, the companies create a leading infusion therapy company with estimated pro forma combined revenues of approximately $2.5 billion. (Source: ICU Medical Inc, Company Website, January 2022)
Procedure Trays Market Report Coverage and Deliverables
The “Procedure Trays Market Size and Forecast (2020–2030)” report provides a detailed analysis of the market covering below areas:
- Procedure trays market size and forecast at global, regional, and country levels for all the key market segments covered under the scope
- Procedure trays market trends as well as market dynamics such as drivers, restraints, and key opportunities
- Detailed PEST/Porter’s Five Forces and SWOT analysis
- Procedure trays market analysis covering key market trends, global and regional framework, major players, regulations, and recent market developments.
- Industry landscape and competition analysis covering market concentration, heat map analysis, prominent players, and recent developments for the procedure trays market
- Detailed company profiles

Report Coverage
Revenue forecast, Company Analysis, Industry landscape, Growth factors, and Trends

Segment Covered
Application, End User, and Geography

Regional Scope
North America, Europe, Asia Pacific, Middle East & Africa, South & Central America

Country Scope
This text is related
to country scope.
Frequently Asked Questions
The market is expected to register a CAGR of 10.0% during 2023–2031.
Biometrix, Medica Europe BV, BD, 3M Owens & Minor Inc, Molnlycke Health Care AB, Nelipak Corporation, Cardinal Health Inc, Teleflex Inc, and ICU Medical Inc.
Growing need for cost-effective products by hospitals and surgical centers, customized procedure trays are trending is likely to remain a key trend in the market.
The increasing number of surgeries and surge in medical tourism are the key driving factors behind the market development. However, the concerns about the disposal and standardization of procedure trays are hampering the market growth.
North America dominated the procedure trays market in 2023
1. Introduction
1.1 The Insight Partners Research Report Guidance
1.2 Market Segmentation
2. Executive Summary
2.1 Key Insights
2.2 Procedure Trays Market, by Geography (US$ Million)
3. Research Methodology
3.1 Coverage
3.2 Secondary Research
3.3 Primary Research
4. Procedure Trays Market Landscape
4.1 Overview
4.2 PEST Analysis
4.2.1 Global PEST Analysis
4.3 Ecosystem Analysis
4.3.1 List of Vendors in the Value Chain
5. Procedure Trays Market - Key Industry Dynamics
5.1 Market Drivers
5.1.1 Increasing Number of Surgical Procedures
5.1.2 Surge in Medical Tourism
5.2 Market Restraints
5.2.1 Concerns About Disposal and Standardization of Procedure Trays
5.3 Market Opportunities
5.3.1 Integration of Procedure Trays with Cloud Platform and Data Analytics
5.4 Future Trends
5.4.1 Escalating Demand for Customized Procedure Trays
5.5 Impact Analysis
6. Procedure Trays Market - Global Market Analysis
6.1 Procedure Trays Market Revenue (US$ Mn), 2022 – 2030
7. Global Procedure Trays Market – Revenue and Forecast to 2030 – by Application
7.1 Overview
7.2 Procedure Trays Market Revenue Share, by Application 2022 & 2030 (%)
7.3 Operating Room
7.3.1 Overview
7.3.2 Operating Room: Procedure Trays Market – Revenue and Forecast to 2030 (US$ Million)
7.4 Angiography
7.4.1 Overview
7.4.2 Angiography: Procedure Trays Market – Revenue and Forecast to 2030 (US$ Million)
7.5 Ophthalmology
7.5.1 Overview
7.5.2 Ophthalmology: Procedure Trays Market – Revenue and Forecast to 2030 (US$ Million)
7.6 Others
7.6.1 Overview
7.6.2 Others: Procedure Trays Market – Revenue and Forecast to 2030 (US$ Million)
8. Global Procedure Trays Market – Revenue and Forecast to 2030 – by End User
8.1 Overview
8.2 Procedure Trays Market Revenue Share, by End User 2022 & 2030 (%)
8.3 Hospitals & Clinics
8.3.1 Overview
8.3.2 Hospitals & Clinics: Procedure Trays Market – Revenue and Forecast to 2030 (US$ Million)
8.4 Ambulatory Surgical Centers
8.4.1 Overview
8.4.2 Ambulatory Surgical Centers: Procedure Trays Market – Revenue and Forecast to 2030 (US$ Million)
8.5 Others
8.5.1 Overview
8.5.2 Others: Procedure Trays Market – Revenue and Forecast to 2030 (US$ Million)
9. Procedure Trays Market – Revenue and Forecast to 2030 – Geographic Analysis
9.1 North America: Procedure Trays Market
9.1.1 Overview
9.1.2 North America: Procedure Trays Market – Revenue and Forecast to 2030 (US$ Million)
9.1.2.1 North America: Procedure Trays Market, by Application, 2020–2030 (US$ Million)
9.1.2.2 North America: Procedure Trays Market, by End User, 2020–2030 (US$ Million)
9.1.3 North America: Procedure Trays Market, by Country, 2022 & 2030 (%)
9.1.3.1 US: Procedure Trays Market – Revenue and Forecast to 2030 (US$ Million)
9.1.3.1.1 US: Procedure Trays Market, by Application, 2020–2030 (US$ Million)
9.1.3.1.2 US: Procedure Trays Market, by End User, 2020–2030 (US$ Million)
9.1.3.2 Canada: Procedure Trays Market – Revenue and Forecast to 2030 (US$ Million)
9.1.3.2.1 Canada: Procedure Trays Market, by Application, 2020–2030 (US$ Million)
9.1.3.2.2 Canada: Procedure Trays Market, by End User, 2020–2030 (US$ Million)
9.1.3.3 Mexico: Procedure Trays Market – Revenue and Forecast to 2030 (US$ Million)
9.1.3.3.1 Mexico: Procedure Trays Market, by Application, 2020–2030 (US$ Million)
9.1.3.3.2 Mexico: Procedure Trays Market, by End User, 2020–2030 (US$ Million)
9.2 Europe: Procedure Trays Market
9.2.1 Overview
9.2.2 Europe: Procedure Trays Market – Revenue and Forecast to 2030 (US$ Million)
9.2.2.1 Europe: Procedure Trays Market, by Application, 2020–2030 (US$ Million)
9.2.2.2 Europe: Procedure Trays Market, by End User, 2020–2030 (US$ Million)
9.2.3 Europe: Procedure Trays Market, by Country, 2022 & 2030 (%)
9.2.3.1 Germany: Procedure Trays Market – Revenue and Forecast to 2030 (US$ Million)
9.2.3.1.1 Germany: Procedure Trays Market, by Application, 2020–2030 (US$ Million)
9.2.3.1.2 Germany: Procedure Trays Market, by End User, 2020–2030 (US$ Million)
9.2.3.2 UK: Procedure Trays Market – Revenue and Forecast to 2030 (US$ Million)
9.2.3.2.1 UK: Procedure Trays Market, by Application, 2020–2030 (US$ Million)
9.2.3.2.2 UK: Procedure Trays Market, by End User, 2020–2030 (US$ Million)
9.2.3.3 France: Procedure Trays Market – Revenue and Forecast to 2030 (US$ Million)
9.2.3.3.1 France: Procedure Trays Market, by Application, 2020–2030 (US$ Million)
9.2.3.3.2 France: Procedure Trays Market, by End User, 2020–2030 (US$ Million)
9.2.3.4 Italy: Procedure Trays Market – Revenue and Forecast to 2030 (US$ Million)
9.2.3.4.1 Italy: Procedure Trays Market, by Application, 2020–2030 (US$ Million)
9.2.3.4.2 Italy: Procedure Trays Market, by End User, 2020–2030 (US$ Million)
9.2.3.5 Spain: Procedure Trays Market – Revenue and Forecast to 2030 (US$ Million)
9.2.3.5.1 Spain: Procedure Trays Market, by Application, 2020–2030 (US$ Million)
9.2.3.5.2 Spain: Procedure Trays Market, by End User, 2020–2030 (US$ Million)
9.2.3.6 Rest of Europe: Procedure Trays Market – Revenue and Forecast to 2030 (US$ Million)
9.2.3.6.1 Rest of Europe: Procedure Trays Market, by Application, 2020–2030 (US$ Million)
9.2.3.6.2 Rest of Europe: Procedure Trays Market, by End User, 2020–2030 (US$ Million)
9.3 Asia Pacific: Procedure Trays Market
9.3.1 Overview
9.3.2 Asia Pacific: Procedure Trays Market - Revenue and Forecast to 2030 (US$ Million)
9.3.2.1 Asia Pacific: Procedure Trays Market, by Application, 2020–2030 (US$ Million)
9.3.2.2 Asia Pacific: Procedure Trays Market, by End User, 2020–2030 (US$ Million)
9.3.3 Asia Pacific: Procedure Trays Market, by Country, 2022 & 2030 (%)
9.3.3.1 China: Procedure Trays Market – Revenue and Forecast to 2030 (US$ Million)
9.3.3.1.1 China: Procedure Trays Market, by Application, 2020–2030 (US$ Million)
9.3.3.1.2 China: Procedure Trays Market, by End User, 2020–2030 (US$ Million)
9.3.3.2 Japan: Procedure Trays Market – Revenue and Forecast to 2030 (US$ Million)
9.3.3.2.1 Japan: Procedure Trays Market, by Application, 2020–2030 (US$ Million)
9.3.3.2.2 Japan: Procedure Trays Market, by End User, 2020–2030 (US$ Million)
9.3.3.3 India: Procedure Trays Market – Revenue and Forecast to 2030 (US$ Million)
9.3.3.3.1 India: Procedure Trays Market, by Application, 2020–2030 (US$ Million)
9.3.3.3.2 India: Procedure Trays Market, by End User, 2020–2030 (US$ Million)
9.3.3.4 Australia: Procedure Trays Market – Revenue and Forecast to 2030 (US$ Million)
9.3.3.4.1 Australia: Procedure Trays Market, by Application, 2020–2030 (US$ Million)
9.3.3.4.2 Australia: Procedure Trays Market, by End User, 2020–2030 (US$ Million)
9.3.3.5 South Korea: Procedure Trays Market – Revenue and Forecast to 2030 (US$ Million)
9.3.3.5.1 South Korea: Procedure Trays Market, by Application, 2020–2030 (US$ Million)
9.3.3.5.2 South Korea: Procedure Trays Market, by End User, 2020–2030 (US$ Million)
9.3.3.6 Rest of Asia Pacific: Procedure Trays Market – Revenue and Forecast to 2030 (US$ Million)
9.3.3.6.1 Rest of Asia Pacific: Procedure Trays Market, by Application, 2020–2030 (US$ Million)
9.3.3.6.2 Rest of Asia Pacific: Procedure Trays Market, by End User, 2020–2030 (US$ Million)
9.4 Middle East & Africa Procedure Trays Market
9.4.1 Overview
9.4.2 Middle East & Africa: Procedure Trays Market – Revenue and Forecast to 2030 (US$ Million)
9.4.2.1 Middle East & Africa: Procedure Trays Market, by Application, 2020–2030 (US$ Million)
9.4.2.2 Middle East & Africa: Procedure Trays Market, by End User, 2020–2030 (US$ Million)
9.4.3 Middle East & Africa: Procedure Trays Market, by Country, 2022 & 2030 (%)
9.4.3.1 Saudi Arabia: Procedure Trays Market – Revenue and Forecast to 2030 (US$ Million)
9.4.3.1.1 Saudi Arabia: Procedure Trays Market, by Application, 2020–2030 (US$ Million)
9.4.3.1.2 Saudi Arabia: Procedure Trays Market, by End User, 2020–2030 (US$ Million)
9.4.3.2 South Africa: Procedure Trays Market – Revenue and Forecast to 2030 (US$ Million)
9.4.3.2.1 South Africa: Procedure Trays Market, by Application, 2020–2030 (US$ Million)
9.4.3.2.2 South Africa: Procedure Trays Market, by End User, 2020–2030 (US$ Million)
9.4.3.3 UAE: Procedure Trays Market – Revenue and Forecast to 2030 (US$ Million)
9.4.3.3.1 UAE: Procedure Trays Market, by Application, 2020–2030 (US$ Million)
9.4.3.3.2 UAE: Procedure Trays Market, by End User, 2020–2030 (US$ Million)
9.4.3.4 Rest of Middle East & Africa: Procedure Trays Market – Revenue and Forecast to 2030 (US$ Million)
9.4.3.4.1 Rest of Middle East & Africa: Procedure Trays Market, by Application, 2020–2030 (US$ Million)
9.4.3.4.2 Rest of Middle East & Africa: Procedure Trays Market, by End User, 2020–2030 (US$ Million)
9.5 South & Central America: Procedure Trays Market
9.5.1 Overview
9.5.2 South & Central America: Procedure Trays Market - Revenue and Forecast to 2030 (US$ Million)
9.5.2.1 South & Central America: Procedure Trays Market, By Application, 2020–2030 (US$ Million)
9.5.2.2 South & Central America: Procedure Trays Market, By End User, 2020–2030 (US$ Million)
9.5.3 South & Central America: Procedure Trays Market Share by Country – 2022 & 2030, (%)
9.5.3.1 Brazil: Procedure Trays Market – Revenue and Forecast to 2030 (US$ Million)
9.5.3.1.1 Brazil: Procedure Trays Market, By Application, 2020–2030 (US$ Million)
9.5.3.1.2 Brazil: Procedure Trays Market, By End User, 2020–2030 (US$ Million)
9.5.3.2 Argentina: Procedure Trays Market – Revenue and Forecast to 2030 (US$ Million)
9.5.3.2.1 Argentina: Procedure Trays Market, By Application, 2020–2030 (US$ Million)
9.5.3.2.2 Argentina: Procedure Trays Market, By End User, 2020–2030 (US$ Million)
9.5.3.3 Rest of South & Central America: Procedure Trays Market – Revenue and Forecast to 2030 (US$ Million)
9.5.3.3.1 Rest of South & Central America: Procedure Trays Market, By Application, 2020–2030 (US$ Million)
9.5.3.3.2 Rest of South & Central America: Procedure Trays Market, By End User, 2020–2030 (US$ Million)
10. Pre and Post COVID-19 Impact on Procedure Trays Market
10.1 Pre and Post COVID-19 Impact
11. Procedure Trays Market–Industry Landscape
11.1 Overview
11.2 Growth Strategies in Global Procedure Trays Market (%)
11.3 Organic Developments
11.3.1 Overview
11.4 Inorganic Developments
11.4.1 Overview
12. Company Profiles
12.1 Biometrix
12.1.1 Key Facts
12.1.2 Business Description
12.1.3 Products and Services
12.1.4 Financial Overview
12.1.5 SWOT Analysis
12.1.6 Key Developments
12.2 Medica Europe BV
12.2.1 Key Facts
12.2.2 Business Description
12.2.3 Products and Services
12.2.4 Financial Overview
12.2.5 SWOT Analysis
12.2.6 Key Developments
12.3 3M Co
12.3.1 Key Facts
12.3.2 Business Description
12.3.3 Financial Overview
12.3.4 SWOT Analysis
12.3.5 Key Developments
12.4 BD
12.4.1 Key Facts
12.4.2 Business Description
12.4.3 Products and Services
12.4.4 Financial Overview
12.4.5 SWOT Analysis
12.4.6 Key Developments
12.5 Owens & Minor Inc
12.5.1 Key Facts
12.5.2 Business Description
12.5.3 Products and Services
12.5.4 Financial Overview
12.5.5 SWOT Analysis
12.5.6 Key Developments
12.6 Molnlycke Health Care AB
12.6.1 Key Facts
12.6.2 Business Description
12.6.3 Products and Services
12.6.4 Financial Overview
12.6.5 SWOT Analysis
12.6.6 Key Developments
12.7 Nelipak Corporation
12.7.1 Key Facts
12.7.2 Business Description
12.7.3 Products and Services
12.7.4 Financial Overview
12.7.5 SWOT Analysis
12.7.6 Key Developments
12.8 Teleflex Incorporated
12.8.1 Key Facts
12.8.2 Business Description
12.8.3 Products and Services
12.8.4 Financial Overview
12.8.5 SWOT Analysis
12.8.6 Key Developments
12.9 Cardinal Health Inc
12.9.1 Key Facts
12.9.2 Business Description
12.9.3 Products and Services
12.9.4 Financial Overview
12.9.5 SWOT Analysis
12.9.6 Key Developments
12.10 ICU Medical Inc
12.10.1 Key Facts
12.10.2 Business Description
12.10.3 Products and Services
12.10.4 Financial Overview
12.10.5 SWOT Analysis
12.10.6 Key Developments
13. Appendix
13.1 About Us
13.2 Glossary of Terms
List of Tables
Table 1. Procedure Trays Market Segmentation
Table 2. List of Vendors in Value Chain
Table 3. North America Procedure Trays Market, by Application – Revenue and Forecast to 2030 (US$ Million)
Table 4. North America Procedure Trays Market, by End User – Revenue and Forecast to 2030 (US$ Million)
Table 5. US Procedure Trays Market, by Application – Revenue and Forecast to 2030 (US$ Million)
Table 6. US Procedure Trays Market, by End User – Revenue and Forecast to 2030 (US$ Million)
Table 7. Canada Procedure Trays Market, by Application – Revenue and Forecast to 2030 (US$ Million)
Table 8. Canada Procedure Trays Market, by End User – Revenue and Forecast to 2030 (US$ Million)
Table 9. Mexico Procedure Trays Market, by Application – Revenue and Forecast to 2030 (US$ Million)
Table 10. Mexico Procedure Trays Market, by End User – Revenue and Forecast to 2030 (US$ Million)
Table 11. Europe Procedure Trays Market, by Application – Revenue and Forecast to 2030 (US$ Million)
Table 12. Europe Procedure Trays Market, by End User – Revenue and Forecast to 2030 (US$ Million)
Table 13. Germany Procedure Trays Market, by Application – Revenue and Forecast to 2030 (US$ Million)
Table 14. Germany Procedure Trays Market, by End User – Revenue and Forecast to 2030 (US$ Million)
Table 15. UK Procedure Trays Market, by Application – Revenue and Forecast to 2030 (US$ Million)
Table 16. UK Procedure Trays Market, by End User – Revenue and Forecast to 2030 (US$ Million)
Table 17. France Procedure Trays Market, by Application – Revenue and Forecast to 2030 (US$ Million)
Table 18. France Procedure Trays Market, by End User – Revenue and Forecast to 2030 (US$ Million)
Table 19. Italy Procedure Trays Market, by Application – Revenue and Forecast to 2030 (US$ Million)
Table 20. Italy Procedure Trays Market, by End User – Revenue and Forecast to 2030 (US$ Million)
Table 21. Spain Procedure Trays Market, by Application – Revenue and Forecast to 2030 (US$ Million)
Table 22. Spain Procedure Trays Market, by End User – Revenue and Forecast to 2030 (US$ Million)
Table 23. Rest of Europe Procedure Trays Market, by Application – Revenue and Forecast to 2030 (US$ Million)
Table 24. Rest of Europe Procedure Trays Market, by End User – Revenue and Forecast to 2030 (US$ Million)
Table 25. Asia Pacific Procedure Trays Market, by Application – Revenue and Forecast to 2030 (US$ Million)
Table 26. Asia Pacific Procedure Trays Market, by End User – Revenue and Forecast to 2030 (US$ Million)
Table 27. China Procedure Trays Market, by Application – Revenue and Forecast to 2030 (US$ Million)
Table 28. China Procedure Trays Market, by End User – Revenue and Forecast to 2030 (US$ Million)
Table 29. Japan Procedure Trays Market, by Application – Revenue and Forecast to 2030 (US$ Million)
Table 30. Japan Procedure Trays Market, by End User– Revenue and Forecast to 2030 (US$ Million)
Table 31. India Procedure Trays Market, by Application – Revenue and Forecast to 2030 (US$ Million)
Table 32. India Procedure Trays Market, by End User – Revenue and Forecast to 2030 (US$ Million)
Table 33. Australia Procedure Trays Market, by Application – Revenue and Forecast to 2030 (US$ Million)
Table 34. Australia Procedure Trays Market, by End User – Revenue and Forecast to 2030 (US$ Million)
Table 35. South Korea Procedure Trays Market, by Application – Revenue and Forecast to 2030 (US$ Million)
Table 36. South Korea Procedure Trays Market, by End User – Revenue and Forecast to 2030 (US$ Million)
Table 37. Rest of Asia Pacific Procedure Trays Market, by Application – Revenue and Forecast to 2030 (US$ Million)
Table 38. Rest of Asia Pacific Procedure Trays Market, by End User– Revenue and Forecast to 2030 (US$ Million)
Table 39. Middle East & Africa Procedure Trays Market, by Application – Revenue and Forecast to 2030 (US$ Million)
Table 40. Middle East & Africa Procedure Trays Market, by End User – Revenue and Forecast to 2030 (US$ Million)
Table 41. Saudi Arabia Procedure Trays Market, by Application – Revenue and Forecast to 2030 (US$ Million)
Table 42. Saudi Arabia Procedure Trays Market, by End User – Revenue and Forecast to 2030 (US$ Million)
Table 43. South Africa Procedure Trays Market, by Application – Revenue and Forecast to 2030 (US$ Million)
Table 44. South Africa Procedure Trays Market, by End User – Revenue and Forecast to 2030 (US$ Million)
Table 45. UAE Procedure Trays Market, by Application – Revenue and Forecast to 2030 (US$ Million)
Table 46. UAE Procedure Trays Market, by End User – Revenue and Forecast to 2030 (US$ Million)
Table 47. Rest of Middle East & Africa Procedure Trays Market, by Application – Revenue and Forecast to 2030 (US$ Million)
Table 48. Rest of Middle East & Africa Procedure Trays Market, by End User – Revenue and Forecast to 2030 (US$ Million)
Table 49. South & Central America: Procedure Trays Market, By Application – Revenue and Forecast to 2030 (US$ Million)
Table 50. South & Central America: Procedure Trays Market, By End User – Revenue and Forecast to 2030 (US$ Million)
Table 51. Brazil: Procedure Trays Market, By Application – Revenue and Forecast to 2030 (US$ Million)
Table 52. Brazil: Procedure Trays Market, By End User – Revenue and Forecast to 2030 (US$ Million)
Table 53. Argentina: Procedure Trays Market, By Application – Revenue and Forecast to 2030 (US$ Million)
Table 54. Argentina: Procedure Trays Market, By End User – Revenue and Forecast to 2030 (US$ Million)
Table 55. Rest of South & Central America: Procedure Trays Market, By Application – Revenue and Forecast to 2030 (US$ Million)
Table 56. Rest of South & Central America: Procedure Trays Market, By End User – Revenue and Forecast to 2030 (US$ Million)
Table 57. Organic Developments in the Global Procedure Trays Market
Table 58. Inorganic Developments in the Global Procedure Trays Market
Table 59. Glossary of Terms, Procedure Trays Market
List of Figures
Figure 1. Procedure Trays Market Segmentation, By Geography
Figure 2. Global - PEST Analysis
Figure 3. Procedure Trays Market: Key Industry Dynamics
Figure 4. Procedure Trays Market: Impact Analysis of Drivers and Restraints
Figure 5. Procedure Trays Market Revenue (US$ Mn), 2020 – 2030
Figure 6. Global Procedure Trays Market, By Geography Forecast Analysis, 2022 & 2030
Figure 7. Procedure Trays Market Revenue Share, by Application 2022 & 2030 (%)
Figure 8. Operating Room: Procedure Trays Market – Revenue and Forecast to 2030 (US$ Million)
Figure 9. Angiography: Procedure Trays Market – Revenue and Forecast to 2030 (US$ Million)
Figure 10. Ophthalmology: Procedure Trays Market – Revenue and Forecast to 2030 (US$ Million)
Figure 11. Others: Procedure Trays Market – Revenue and Forecast to 2030 (US$ Million)
Figure 12. Procedure Trays Market Revenue Share, by End User 2022 & 2030 (%)
Figure 13. Hospitals & Clinics: Procedure Trays Market – Revenue and Forecast to 2030 (US$ Million)
Figure 14. Ambulatory Surgical Centers: Procedure Trays Market – Revenue and Forecast to 2030 (US$ Million)
Figure 15. Others: Procedure Trays Market – Revenue and Forecast to 2030 (US$ Million)
Figure 16. North America: Procedure Trays Market, by Key Country – Revenue (2022) (US$ Million)
Figure 17. North America Procedure Trays Market – Revenue and Forecast to 2030 (US$ Million)
Figure 18. North America: Procedure Trays Market, by Country, 2022 & 2030 (%)
Figure 19. US: Procedure Trays Market – Revenue and Forecast to 2030 (US$ Million)
Figure 20. Canada: Procedure Trays Market – Revenue and Forecast to 2030 (US$ Million)
Figure 21. Mexico: Procedure Trays Market – Revenue and Forecast to 2030 (US$ Million)
Figure 22. Europe: Procedure Trays Market, by Key Country – Revenue (2022) (US$ Million)
Figure 23. Europe Procedure Trays Market – Revenue and Forecast to 2030 (US$ Million)
Figure 24. Europe: Procedure Trays Market, by Country, 2022 & 2030 (%)
Figure 25. Germany: Procedure Trays Market – Revenue and Forecast to 2030 (US$ Million)
Figure 26. UK: Procedure Trays Market – Revenue and Forecast to 2030 (US$ Million)
Figure 27. France: Procedure Trays Market – Revenue and Forecast to 2030 (US$ Million)
Figure 28. Italy: Procedure Trays Market – Revenue and Forecast to 2030 (US$ Million)
Figure 29. Spain: Procedure Trays Market – Revenue and Forecast to 2030 (US$ Million)
Figure 30. Rest of Europe: Procedure Trays Market – Revenue and Forecast to 2030 (US$ Million)
Figure 31. Asia Pacific: Procedure Trays Market, by Key Country – Revenue (2022) (US$ Million)
Figure 32. Asia Pacific Procedure Trays Market Revenue and Forecast to 2030 (US$ Million)
Figure 33. Asia Pacific: Procedure Trays Market, by Country, 2022 & 2030 (%)
Figure 34. China: Procedure Trays Market – Revenue and Forecast to 2030 (US$ Million)
Figure 35. Japan: Procedure Trays Market – Revenue and Forecast to 2030 (US$ Million)
Figure 36. India: Procedure Trays Market – Revenue and Forecast to 2030 (US$ Million)
Figure 37. Australia: Procedure Trays Market – Revenue and Forecast to 2030 (US$ Million)
Figure 38. South Korea: Procedure Trays Market – Revenue and Forecast to 2030 (US$ Million)
Figure 39. Rest of Asia Pacific: Procedure Trays Market – Revenue and Forecast to 2030 (US$ Million)
Figure 40. Middle East & Africa: Procedure Trays Market, by Key Country – Revenue (2022) (US$ Million)
Figure 41. Middle East & Africa Procedure Trays Market – Revenue and Forecast to 2030 (US$ Million)
Figure 42. Middle East & Africa: Procedure Trays Market, by Country, 2022 & 2030 (%)
Figure 43. Saudi Arabia: Procedure Trays Market – Revenue and Forecast to 2030 (US$ Million)
Figure 44. South Africa: Procedure Trays Market – Revenue and Forecast to 2030 (US$ Million)
Figure 45. UAE: Procedure Trays Market – Revenue and Forecast to 2030 (US$ Million)
Figure 46. Rest of Middle East & Africa: Procedure Trays Market – Revenue and Forecast to 2030 (US$ Million)
Figure 47. South & Central America: Procedure Trays Market, By Key Country – Revenue (2022) (US$ Million)
Figure 48. South & Central America: Procedure Trays Market- Revenue and Forecasts to 2030 (US$ Million)
Figure 49. South & Central America: Procedure Trays Market Share by Country – 2022 & 2030, (%)
Figure 50. Brazil: Procedure Trays Market- Revenue and Forecasts to 2030 (US$ Million)
Figure 51. Argentina: Procedure Trays Market- Revenue and Forecasts to 2030 (US$ Million)
Figure 52. Rest of South & Central America: Procedure Trays Market - Revenue and Forecast to 2030 (US$ Million)
Figure 53. Pre and Post COVID-19 Impact
Figure 54. Growth Strategies in Global Procedure Trays Market (%)
The Insight Partners performs research in 4 major stages: Data Collection & Secondary Research, Primary Research, Data Analysis and Data Triangulation & Final Review.
- Data Collection and Secondary Research:
As a market research and consulting firm operating from a decade, we have published many reports and advised several clients across the globe. First step for any study will start with an assessment of currently available data and insights from existing reports. Further, historical and current market information is collected from Investor Presentations, Annual Reports, SEC Filings, etc., and other information related to company’s performance and market positioning are gathered from Paid Databases (Factiva, Hoovers, and Reuters) and various other publications available in public domain.
Several associations trade associates, technical forums, institutes, societies and organizations are accessed to gain technical as well as market related insights through their publications such as research papers, blogs and press releases related to the studies are referred to get cues about the market. Further, white papers, journals, magazines, and other news articles published in the last 3 years are scrutinized and analyzed to understand the current market trends.
- Primary Research:
The primarily interview analysis comprise of data obtained from industry participants interview and answers to survey questions gathered by in-house primary team.
For primary research, interviews are conducted with industry experts/CEOs/Marketing Managers/Sales Managers/VPs/Subject Matter Experts from both demand and supply side to get a 360-degree view of the market. The primary team conducts several interviews based on the complexity of the markets to understand the various market trends and dynamics which makes research more credible and precise.
A typical research interview fulfils the following functions:
- Provides first-hand information on the market size, market trends, growth trends, competitive landscape, and outlook
- Validates and strengthens in-house secondary research findings
- Develops the analysis team’s expertise and market understanding
Primary research involves email interactions and telephone interviews for each market, category, segment, and sub-segment across geographies. The participants who typically take part in such a process include, but are not limited to:
- Industry participants: VPs, business development managers, market intelligence managers and national sales managers
- Outside experts: Valuation experts, research analysts and key opinion leaders specializing in the electronics and semiconductor industry.
Below is the breakup of our primary respondents by company, designation, and region:

Once we receive the confirmation from primary research sources or primary respondents, we finalize the base year market estimation and forecast the data as per the macroeconomic and microeconomic factors assessed during data collection.
- Data Analysis:
Once data is validated through both secondary as well as primary respondents, we finalize the market estimations by hypothesis formulation and factor analysis at regional and country level.
- 3.1 Macro-Economic Factor Analysis:
We analyse macroeconomic indicators such the gross domestic product (GDP), increase in the demand for goods and services across industries, technological advancement, regional economic growth, governmental policies, the influence of COVID-19, PEST analysis, and other aspects. This analysis aids in setting benchmarks for various nations/regions and approximating market splits. Additionally, the general trend of the aforementioned components aid in determining the market's development possibilities.
- 3.2 Country Level Data:
Various factors that are especially aligned to the country are taken into account to determine the market size for a certain area and country, including the presence of vendors, such as headquarters and offices, the country's GDP, demand patterns, and industry growth. To comprehend the market dynamics for the nation, a number of growth variables, inhibitors, application areas, and current market trends are researched. The aforementioned elements aid in determining the country's overall market's growth potential.
- 3.3 Company Profile:
The “Table of Contents” is formulated by listing and analyzing more than 25 - 30 companies operating in the market ecosystem across geographies. However, we profile only 10 companies as a standard practice in our syndicate reports. These 10 companies comprise leading, emerging, and regional players. Nonetheless, our analysis is not restricted to the 10 listed companies, we also analyze other companies present in the market to develop a holistic view and understand the prevailing trends. The “Company Profiles” section in the report covers key facts, business description, products & services, financial information, SWOT analysis, and key developments. The financial information presented is extracted from the annual reports and official documents of the publicly listed companies. Upon collecting the information for the sections of respective companies, we verify them via various primary sources and then compile the data in respective company profiles. The company level information helps us in deriving the base number as well as in forecasting the market size.
- 3.4 Developing Base Number:
Aggregation of sales statistics (2020-2022) and macro-economic factor, and other secondary and primary research insights are utilized to arrive at base number and related market shares for 2022. The data gaps are identified in this step and relevant market data is analyzed, collected from paid primary interviews or databases. On finalizing the base year market size, forecasts are developed on the basis of macro-economic, industry and market growth factors and company level analysis.
- Data Triangulation and Final Review:
The market findings and base year market size calculations are validated from supply as well as demand side. Demand side validations are based on macro-economic factor analysis and benchmarks for respective regions and countries. In case of supply side validations, revenues of major companies are estimated (in case not available) based on industry benchmark, approximate number of employees, product portfolio, and primary interviews revenues are gathered. Further revenue from target product/service segment is assessed to avoid overshooting of market statistics. In case of heavy deviations between supply and demand side values, all thes steps are repeated to achieve synchronization.
We follow an iterative model, wherein we share our research findings with Subject Matter Experts (SME’s) and Key Opinion Leaders (KOLs) until consensus view of the market is not formulated – this model negates any drastic deviation in the opinions of experts. Only validated and universally acceptable research findings are quoted in our reports.
We have important check points that we use to validate our research findings – which we call – data triangulation, where we validate the information, we generate from secondary sources with primary interviews and then we re-validate with our internal data bases and Subject matter experts. This comprehensive model enables us to deliver high quality, reliable data in shortest possible time.
 Get Free Sample For