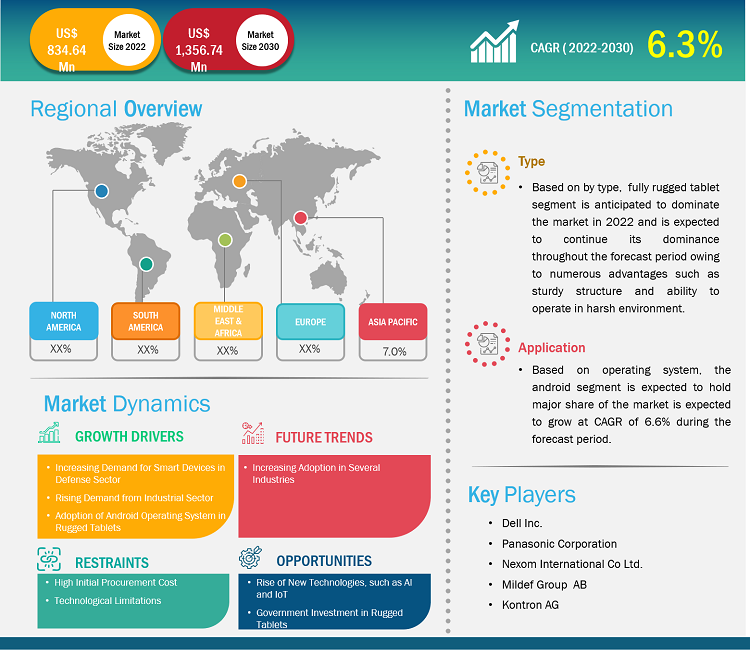
The rugged tablet market size is projected to reach US$ 1,356.74 million by 2030 from US$ 834.64 million in 2022. The market is expected to register a CAGR of 6.30% during 2022–2030. The rise in the construction industry and demand for rugged tablets from the industrial sector are likely to remain key trends in the market.
Rugged Tablet Market Analysis
There is a demand for electronic devices that can work efficiently in challenging environment environments. This factor drives the rugged tablet market. The growing construction industry is fueling the market growth. The demand from the military sector and growing military expenditure further fuel the market growth. The government investment in rugged tablets is expected to create a huge opportunity for market growth.
Rugged Tablet Market Overview
Rugged tablets are electronic devices specially developed to withstand harsh environments and operate efficiently in extreme temperatures, intense vibrations, and dry or damp circumstances. Each component of rugged tablets is made to withstand such situations. The internal parts, cooling systems, and external housing are designed from the bottom up to resist rough use under challenging situations. Sand, dust, filth, ice, and water cannot harm rugged tablets, although ordinary consumer tablets are easily damaged.
Customize Research To Suit Your Requirement
We can optimize and tailor the analysis and scope which is unmet through our standard offerings. This flexibility will help you gain the exact information needed for your business planning and decision making.
Rugged Tablet Market: Strategic Insights
Market Size Value in US$ 834.64 million in 2022 Market Size Value by US$ 1,356.74 million by 2030 Growth rate CAGR of 6.3% from 2022 to 2030 Forecast Period 2022-2030 Base Year 2022

Naveen
Have a question?
Naveen will walk you through a 15-minute call to present the report’s content and answer all queries if you have any.
 Speak to Analyst
Customize Research To Suit Your Requirement
We can optimize and tailor the analysis and scope which is unmet through our standard offerings. This flexibility will help you gain the exact information needed for your business planning and decision making.
Rugged Tablet Market: Strategic Insights
| Market Size Value in | US$ 834.64 million in 2022 |
| Market Size Value by | US$ 1,356.74 million by 2030 |
| Growth rate | CAGR of 6.3% from 2022 to 2030 |
| Forecast Period | 2022-2030 |
| Base Year | 2022 |
Naveen
Have a question?
Naveen will walk you through a 15-minute call to present the report’s content and answer all queries if you have any.
Speak to Analyst
Rugged Tablet Market Drivers and Opportunities
Increasing demand for smart devices in the defense sector
Many nations invest their defense money in smart technologies that can function in challenging environments. Rugged tablets have gained substantial traction in the military industry over the past few years due to their resistance to shocks, vibrations, temperature variations, water resistance, and many other factors. Several nations are collaborating with private companies that produce robust tablets and devices for their defense sectors. Businesses are explicitly producing robust electronics for various nations' defense industries. Various governments use rugged tablets in defense; for instance, in February 2023, DT Research, the leading designer and manufacturer of purpose-built computing solutions for vertical markets, announced the company’s third consecutive contract award for the US Naval shipyards. The DT311Y rugged tablets continue to be deployed at several shipyards on the East Coast (Norfolk and Portsmouth), the West Coast (Puget Sound), and Hawaii (Pearl Harbor). DT Research secured this three-year award in conjunction with Akira Technologies, a DT Research technology partner. Thus, the use of rugged tablets by various forces and the launch of rugged tablets for defense are driving the growth of the rugged tablet market.
Rise in the construction industry
With the rise in urbanization, the construction industry is gaining traction in the commercial and residential sectors. In addition, with the rise in population, the demand for products and services is growing across several industries, which results in a growing industrial sector. Thus, the construction industry operates under a harsh and challenging environment leading to the demand for rugged tablets. The construction workers and construction workers use rugged tablets due to their adaptability to demanding environments. It can operate well amid dirt, dust, water, direct sunlight, and extreme temperatures.
Rugged Tablet Market Report Segmentation Analysis
Key segments that contributed to the derivation of the rugged tablet market analysis are the type, operating system, and application.
- Based on the type, the rugged tablet market is divided into a fully rugged tablet, semi-rugged tablets, and ultra-rugged tablets. The fully rugged tablet segment held the largest share of the market in 2022.
- Based on the operating system, the rugged tablet market is segmented into Android, Windows, and iOS. The Android segment held the largest share of the market in 2022.
- By application, the market is segmented into aerospace & defense, automotive, construction, energy & utilities, manufacturing, oil & gas, and others. The automotive segment is expected to grow with the highest CAGR.
Rugged Tablet Market Share Analysis by Geography
The geographic scope of the rugged tablet market report is mainly divided into five regions: North America, Asia Pacific, Europe, Middle East & Africa, and South & Central America.
Europe region held a significant market share in 2022. The European rugged tablet market is segmented into Germany, France, Italy, the UK, Russia, and the Rest of Europe. Manufacturing is growing in Europe. According to the European Commission, in March 2024, compared with February 2024, seasonally adjusted industrial production increased by 0.6% in the euro area and by 0.2% in the EU. Several players across Europe are manufacturing rugged tablets. In February 2023, Winmate Inc., a manufacturer of rugged tablets for field work, introduced two new rugged tablets—M101TG and M116TG—powered by Intel 11th generation CPU Tiger Lake to suit smart manufacturing demands of harsh solutions. Several utility industries across Europe have adopted rugged tablets for asset management and customer support. In September 2023, Thames Water, the UK's largest private utility company, announced the selection of the ZXIO fully rugged Android tablet that Getac manufactured. ZXIO's fully rugged tablet, combined with the detacnaöle keyboard and rotating hand strap, will enable Thames Water's field engineers to take a proactive approach to asset management and customer support, using smart technologies to deliver more all-important first-time fixes. Thus, the adoption of rugged tablets by various industries propels the rugged tablet market growth in Europe.
Rugged Tablet Market Report Scope
Rugged Tablet Market News and Recent Developments
The rugged tablet market is evaluated by gathering qualitative and quantitative data post primary and secondary research, which includes important corporate publications, association data, and databases. A few of the developments in the rugged tablet market are listed below:
- Zebra Technologies Corporation (NASDAQ: ZBRA), a leading digital solution provider enabling businesses to intelligently connect data, assets, and people, announced the launch of the ET6x series of rugged Android tablets. Designed to help front-line workers in warehouses, manufacturing plants, ports, yards, field service, and emergency medical environments be more productive and efficient, the ET6x series debuts the industry’s only heated touch screen and vehicle dock for forklifts and other material-handling vehicles. (Source: Zebra Technologies Corporation, Press Release, June 2023)
- Getac announced the launch of the AI-ready ZX80, a new 8-inch fully rugged tablet powered by the versatile Android operating system. The announcement expands and diversifies Getac’s portfolio of Android devices, giving customers in industries such as utilities, manufacturing, and transportation even more choices when selecting rugged solutions to solve day-to-day challenges and boost productivity and efficiency. (Source: Getac, Press Release, February 2024)
Rugged Tablet Market Report Coverage and Deliverables
The “Rugged Tablet Market Size and Forecast (2020–2030)” report provides a detailed analysis of the market covering below areas:
- Rugged tablet market size and forecast at global, regional, and country levels for all the key market segments covered under the scope
- Rugged tablet market trends as well as market dynamics such as drivers, restraints, and key opportunities
- Detailed PEST/Porter’s Five Forces and SWOT analysis
- Rugged tablet market analysis covering key market trends, global and regional framework, major players, regulations, and recent market developments
- Industry landscape and competition analysis covering market concentration, heat map analysis, prominent players, and recent developments in the rugged tablet market
- Detailed company profiles

Report Coverage
Revenue forecast, Company Analysis, Industry landscape, Growth factors, and Trends

Segment Covered
Type, Operating System, and Application

Regional Scope
North America, Europe, Asia Pacific, Middle East & Africa, South & Central America

Country Scope
This text is related
to country scope.
Frequently Asked Questions
The global rugged tablet market is estimated to register a CAGR of 6.3% during the forecast period 2022–2030.
The rise in the construction industry and demand for rugged tablets from the industrial sector are the key driving factors impacting the rugged tablet market.
Demand from various industry verticals is a key trend in the rugged tablet market.
The estimated value of the rugged tablet market will be US$ 1,356.74 million by 2030.
AAEON Technology Inc.; Dell Technologies Inc.; DT Research Inc.; Panasonic Holdings Corp; Getac Holdings Corp; MilDef Group AB; NEXCOM International Co Ltd; Leonardo DRS Inc; Zebra Technologies Corp; and Kontron AG are some of the key players operating in the rugged tablet market.
1. Introduction
1.1 The Insight Partners Research Report Guidance
1.2 Market Segmentation
2. Executive Summary
2.1 Key Insights
2.2 Market Attractiveness
3. Research Methodology
3.1 Coverage
3.2 Secondary Research
3.3 Primary Research
4. Rugged Tablet Market Landscape
4.1 Overview
4.2 PEST Analysis
4.3 Ecosystem Analysis
4.3.1 List of Vendors in Value Chain
5. Rugged Tablet Market - Key Industry Dynamics
5.1 Drivers
5.1.1 Increasing Demand for Smart Devices in Defense Sector
5.1.2 Rising Demand from Industrial Sector
5.1.3 Adoption of Android Operating System in Rugged Tablets
5.2 Restraints
5.2.1 High Initial Procurement Cost
5.2.2 Technological Limitations
5.3 Opportunity
5.3.1 Rise of New Technologies, such as AI and IoT
5.3.2 Government Investment in Rugged Tablets
5.4 Future Trend
5.4.1 Increasing Adoption in Several Industries
5.5 Impact of Drivers and Restraints:
6. Rugged Tablet Market - Global Market Analysis
6.1 Rugged Tablet Market Revenue (US$ Million), 2022 – 2030
7. Rugged Tablet Market Analysis - Type
7.1 Fully Rugged Tablet
7.1.1 Overview
7.1.2 Fully Rugged Tablet Market Revenue and Forecasts To 2030 (US$ Million)
7.2 Semi Rugged Tablet
7.2.1 Overview
7.2.2 Semi Rugged Tablet Market Revenue and Forecasts To 2030 (US$ Million)
7.3 Ultra Rugged Tablet
7.3.1 Overview
7.3.2 Ultra Rugged Tablet Market Revenue and Forecasts To 2030 (US$ Million)
8. Rugged Tablet Market Analysis - Operating System
8.1 Android
8.1.1 Overview
8.1.2 Android Market Revenue and Forecasts To 2030 (US$ Million)
8.2 Windows
8.2.1 Overview
8.2.2 Windows Market Revenue and Forecasts To 2030 (US$ Million)
8.3 iOS
8.3.1 Overview
8.3.2 iOS Market Revenue and Forecasts To 2030 (US$ Million)
9. Rugged Tablet Market Analysis - Application
9.1 Aerospace & Defense
9.1.1 Overview
9.1.2 Aerospace & Defense Market Revenue and Forecasts To 2030 (US$ Million)
9.2 Automotive
9.2.1 Overview
9.2.2 Automotive Market Revenue and Forecasts To 2030 (US$ Million)
9.3 Construction
9.3.1 Overview
9.3.2 Construction Market Revenue and Forecasts To 2030 (US$ Million)
9.4 Energy & Utilities
9.4.1 Overview
9.4.2 Energy & Utilities Market Revenue and Forecasts To 2030 (US$ Million)
9.5 Manufacturing
9.5.1 Overview
9.5.2 Manufacturing Market Revenue and Forecasts To 2030 (US$ Million)
9.6 Oil & Gas
9.6.1 Overview
9.6.2 Oil & Gas Market Revenue and Forecasts To 2030 (US$ Million)
9.7 Others
9.7.1 Overview
9.7.2 Others Market Revenue and Forecasts To 2030 (US$ Million)
10. Rugged Tablet Market - Geographical Analysis
10.1 North America
10.1.1 North America Rugged Tablet Market Overview
10.1.2 North America Rugged Tablet Market Revenue and Forecasts to 2030 (US$ Mn)
10.1.3 North America Rugged Tablet Market Breakdown by Type
10.1.3.1 North America Rugged Tablet Market Revenue and Forecasts and Analysis - By Type
10.1.4 North America Rugged Tablet Market Breakdown by Operating System
10.1.4.1 North America Rugged Tablet Market Revenue and Forecasts and Analysis - By Operating System
10.1.5 North America Rugged Tablet Market Breakdown by Application
10.1.5.1 North America Rugged Tablet Market Revenue and Forecasts and Analysis - By Application
10.1.6 North America Rugged Tablet Market Revenue and Forecasts and Analysis - By Countries
10.1.6.1 North America Rugged Tablet Market Revenue and Forecasts and Analysis - By Country
10.1.6.2 US Rugged Tablet Market Revenue and Forecasts to 2030 (US$ Mn)
10.1.6.2.1 US Rugged Tablet Market Breakdown by Type
10.1.6.2.2 US Rugged Tablet Market Breakdown by Operating System
10.1.6.2.3 US Rugged Tablet Market Breakdown by Application
10.1.6.3 Canada Rugged Tablet Market Revenue and Forecasts to 2030 (US$ Mn)
10.1.6.3.1 Canada Rugged Tablet Market Breakdown by Type
10.1.6.3.2 Canada Rugged Tablet Market Breakdown by Operating System
10.1.6.3.3 Canada Rugged Tablet Market Breakdown by Application
10.1.6.4 Mexico Rugged Tablet Market Revenue and Forecasts to 2030 (US$ Mn)
10.1.6.4.1 Mexico Rugged Tablet Market Breakdown by Type
10.1.6.4.2 Mexico Rugged Tablet Market Breakdown by Operating System
10.1.6.4.3 Mexico Rugged Tablet Market Breakdown by Application
10.2 Europe
10.2.1 Europe Rugged Tablet Market Overview
10.2.2 Europe Rugged Tablet Market Revenue and Forecasts to 2030 (US$ Mn)
10.2.3 Europe Rugged Tablet Market Breakdown by Type
10.2.3.1 Europe Rugged Tablet Market Revenue and Forecasts and Analysis - By Type
10.2.4 Europe Rugged Tablet Market Breakdown by Operating System
10.2.4.1 Europe Rugged Tablet Market Revenue and Forecasts and Analysis - By Operating System
10.2.5 Europe Rugged Tablet Market Breakdown by Application
10.2.5.1 Europe Rugged Tablet Market Revenue and Forecasts and Analysis - By Application
10.2.6 Europe Rugged Tablet Market Revenue and Forecasts and Analysis - By Countries
10.2.6.1 Germany Rugged Tablet Market Revenue and Forecasts to 2030 (US$ Mn)
10.2.6.1.1 Germany Rugged Tablet Market Breakdown by Type
10.2.6.1.2 Germany Rugged Tablet Market Breakdown by Operating System
10.2.6.1.3 Germany Rugged Tablet Market Breakdown by Application
10.2.6.2 France Rugged Tablet Market Revenue and Forecasts to 2030 (US$ Mn)
10.2.6.2.1 France Rugged Tablet Market Breakdown by Type
10.2.6.2.2 France Rugged Tablet Market Breakdown by Operating System
10.2.6.2.3 France Rugged Tablet Market Breakdown by Application
10.2.6.3 Italy Rugged Tablet Market Revenue and Forecasts to 2030 (US$ Mn)
10.2.6.3.1 Italy Rugged Tablet Market Breakdown by Type
10.2.6.3.2 Italy Rugged Tablet Market Breakdown by Operating System
10.2.6.3.3 Italy Rugged Tablet Market Breakdown by Application
10.2.6.4 UK Rugged Tablet Market Revenue and Forecasts to 2030 (US$ Mn)
10.2.6.4.1 UK Rugged Tablet Market Breakdown by Type
10.2.6.4.2 UK Rugged Tablet Market Breakdown by Operating System
10.2.6.4.3 UK Rugged Tablet Market Breakdown by Application
10.2.6.5 Russia Rugged Tablet Market Revenue and Forecasts to 2030 (US$ Mn)
10.2.6.5.1 Russia Rugged Tablet Market Breakdown by Type
10.2.6.5.2 Russia Rugged Tablet Market Breakdown by Operating System
10.2.6.5.3 Russia Rugged Tablet Market Breakdown by Application
10.2.6.6 Rest of Europe Rugged Tablet Market Revenue and Forecasts to 2030 (US$ Mn)
10.2.6.6.1 Rest of Europe Rugged Tablet Market Breakdown by Type
10.2.6.6.2 Rest of Europe Rugged Tablet Market Breakdown by Operating System
10.2.6.6.3 Rest of Europe Rugged Tablet Market Breakdown by Application
10.3 Asia Pacific Rugged Tablet Market
10.3.1 Asia Pacific Rugged Tablet Market Overview
10.3.2 Asia Pacific Rugged Tablet Market Revenue and Forecasts To 2030 (US$ Million)
10.3.3 Asia Pacific Rugged Tablet Market Breakdown by Type
10.3.3.1 Asia Pacific Rugged Tablet Market Revenue and Forecasts and Analysis - By Type
10.3.4 Asia Pacific Rugged Tablet Market Breakdown by Operating System
10.3.4.1 Asia Pacific Rugged Tablet Market Revenue and Forecasts and Analysis - By Operating System
10.3.5 Asia Pacific Rugged Tablet Market Breakdown by Application
10.3.5.1 Asia Pacific Rugged Tablet Market Revenue and Forecasts and Analysis - By Application
10.3.6 Rugged Tablet market Breakdown by Country
10.3.6.1 Australia Rugged Tablet Market Revenue and Forecasts To 2030 (US$ Million)
10.3.6.1.1 Australia Rugged Tablet Market Breakdown by Type
10.3.6.1.2 Australia Rugged Tablet Market Breakdown by Operating System
10.3.6.1.3 Australia Rugged Tablet Market Breakdown by Application
10.3.6.2 China Rugged Tablet Market Revenue and Forecasts To 2030 (US$ Million)
10.3.6.2.1 China Rugged Tablet Market Breakdown by Type
10.3.6.2.2 China Rugged Tablet Market Breakdown by Operating System
10.3.6.2.3 China Rugged Tablet Market Breakdown by Application
10.3.6.3 India Rugged Tablet Market Revenue and Forecasts To 2030 (US$ Million)
10.3.6.3.1 India Rugged Tablet Market Breakdown by Type
10.3.6.3.2 India Rugged Tablet Market Breakdown by Operating System
10.3.6.3.3 India Rugged Tablet Market Breakdown by Application
10.3.6.4 Japan Rugged Tablet Market Revenue and Forecasts To 2030 (US$ Million)
10.3.6.4.1 Japan Rugged Tablet Market Breakdown by Type
10.3.6.4.2 Japan Rugged Tablet Market Breakdown by Operating System
10.3.6.4.3 Japan Rugged Tablet Market Breakdown by Application
10.3.6.5 South Korea Rugged Tablet Market Revenue and Forecasts To 2030 (US$ Million)
10.3.6.5.1 South Korea Rugged Tablet Market Breakdown by Type
10.3.6.5.2 South Korea Rugged Tablet Market Breakdown by Operating System
10.3.6.5.3 South Korea Rugged Tablet Market Breakdown by Application
10.3.6.6 Indonesia Rugged Tablet Market Revenue and Forecasts To 2030 (US$ Million)
10.3.6.6.1 Indonesia Rugged Tablet Market Breakdown by Type
10.3.6.6.2 Indonesia Rugged Tablet Market Breakdown by Operating System
10.3.6.6.3 Indonesia Rugged Tablet Market Breakdown by Application
10.3.6.7 Singapore Rugged Tablet Market Revenue and Forecasts To 2030 (US$ Million)
10.3.6.7.1 Singapore Rugged Tablet Market Breakdown by Type
10.3.6.7.2 Singapore Rugged Tablet Market Breakdown by Operating System
10.3.6.7.3 Singapore Rugged Tablet Market Breakdown by Application
10.3.6.8 Malaysia Rugged Tablet Market Revenue and Forecasts To 2030 (US$ Million)
10.3.6.8.1 Malaysia Rugged Tablet Market Breakdown by Type
10.3.6.8.2 Malaysia Rugged Tablet Market Breakdown by Operating System
10.3.6.8.3 Malaysia Rugged Tablet Market Breakdown by Application
10.3.6.9 Thailand Rugged Tablet Market Revenue and Forecasts To 2030 (US$ Million)
10.3.6.9.1 Thailand Rugged Tablet Market Breakdown by Type
10.3.6.9.2 Thailand Rugged Tablet Market Breakdown by Operating System
10.3.6.9.3 Thailand Rugged Tablet Market Breakdown by Application
10.3.6.10 Philippines Rugged Tablet Market Revenue and Forecasts To 2030 (US$ Million)
10.3.6.10.1 Philippines Rugged Tablet Market Breakdown by Type
10.3.6.10.2 Philippines Rugged Tablet Market Breakdown by Operating System
10.3.6.10.3 Philippines Rugged Tablet Market Breakdown by Application
10.3.6.11 Vietnam Rugged Tablet Market Revenue and Forecasts To 2030 (US$ Million)
10.3.6.11.1 Vietnam Rugged Tablet Market Breakdown by Type
10.3.6.11.2 Vietnam Rugged Tablet Market Breakdown by Operating System
10.3.6.11.3 Vietnam Rugged Tablet Market Breakdown by Application
10.3.6.12 Rest of Asia Pacific Rugged Tablet Market Revenue and Forecasts To 2030 (US$ Million)
10.3.6.12.1 Rest of Asia Pacific Rugged Tablet Market Breakdown by Type
10.3.6.12.2 Rest of Asia Pacific Rugged Tablet Market Breakdown by Operating System
10.3.6.12.3 Rest of Asia Pacific Rugged Tablet Market Breakdown by Application
10.4 Middle East & Africa
10.4.1 Middle East & Africa Rugged Tablet Market Overview
10.4.2 Middle East & Africa Rugged Tablet Market Revenue and Forecasts to 2030 (US$ Million)
10.4.3 Middle East & Africa Rugged Tablet Market Breakdown by Type
10.4.3.1 Middle East & Africa Rugged Tablet Market and Forecasts and Analysis - By Type
10.4.4 Middle East & Africa Rugged Tablet Market Breakdown by Operating System
10.4.4.1 Middle East & Africa Rugged Tablet Market and Forecasts and Analysis - By Operating System
10.4.5 Middle East & Africa Rugged Tablet Market Breakdown by Application
10.4.5.1 Middle East & Africa Rugged Tablet Market and Forecasts and Analysis - By Application
10.4.6 Middle East & Africa Rugged Tablet Market Revenue and Forecasts and Analysis - By Countries
10.4.6.1 South Africa Rugged Tablet Market Revenue and Forecasts to 2030 (US$ Million)
10.4.6.1.1 South Africa Rugged Tablet Market Breakdown by Type
10.4.6.1.2 South Africa Rugged Tablet Market Breakdown by Operating System
10.4.6.1.3 South Africa Rugged Tablet Market Breakdown by Application
10.4.6.2 Saudi Arabia Rugged Tablet Market Revenue and Forecasts to 2030 (US$ Million)
10.4.6.2.1 Saudi Arabia Rugged Tablet Market Breakdown by Type
10.4.6.2.2 Saudi Arabia Rugged Tablet Market Breakdown by Operating System
10.4.6.2.3 Saudi Arabia Rugged Tablet Market Breakdown by Application
10.4.6.3 UAE Rugged Tablet Market Revenue and Forecasts to 2030 (US$ Million)
10.4.6.3.1 UAE Rugged Tablet Market Breakdown by Type
10.4.6.3.2 UAE Rugged Tablet Market Breakdown by Operating System
10.4.6.3.3 UAE Rugged Tablet Market Breakdown by Application
10.4.6.4 Turkey Rugged Tablet Market Revenue and Forecasts to 2030 (US$ Million)
10.4.6.4.1 Turkey Rugged Tablet Market Breakdown by Type
10.4.6.4.2 Turkey Rugged Tablet Market Breakdown by Operating System
10.4.6.4.3 Turkey Rugged Tablet Market Breakdown by Application
10.4.6.5 Nigeria Rugged Tablet Market Revenue and Forecasts to 2030 (US$ Million)
10.4.6.5.1 Nigeria Rugged Tablet Market Breakdown by Type
10.4.6.5.2 Nigeria Rugged Tablet Market Breakdown by Operating System
10.4.6.5.3 Nigeria Rugged Tablet Market Breakdown by Application
10.4.6.6 Egypt Rugged Tablet Market Revenue and Forecasts to 2030 (US$ Million)
10.4.6.6.1 Egypt Rugged Tablet Market Breakdown by Type
10.4.6.6.2 Egypt Rugged Tablet Market Breakdown by Operating System
10.4.6.6.3 Egypt Rugged Tablet Market Breakdown by Application
10.4.6.7 Rest of Middle East & Africa Rugged Tablet Market Revenue and Forecasts to 2030 (US$ Million)
10.4.6.7.1 Rest of Middle East & Africa Rugged Tablet Market Breakdown by Type
10.4.6.7.2 Rest of Middle East & Africa Rugged Tablet Market Breakdown by Operating System
10.4.6.7.3 Rest of Middle East & Africa Rugged Tablet Market Breakdown by Application
10.5 South & Central America
10.5.1 South & Central America Rugged Tablet Market Overview
10.5.2 South & Central America Rugged Tablet Market Revenue and Forecasts to 2030 (US$ Million)
10.5.3 South & Central America Rugged Tablet Market Breakdown by Type
10.5.3.1 South & Central America Rugged Tablet Market and Forecasts and Analysis - By Type
10.5.4 South & Central America Rugged Tablet Market Breakdown by Operating System
10.5.4.1 South & Central America Rugged Tablet Market Revenue and Forecasts and Analysis - By Operating System
10.5.5 South & Central America Rugged Tablet Market Breakdown by Application
10.5.5.1 South & Central America Rugged Tablet Market Revenue and Forecasts and Analysis - By Application
10.5.6 South & Central America Rugged Tablet Market Revenue and Forecasts and Analysis - By Countries
10.5.6.1 Brazil Rugged Tablet Market Revenue and Forecasts to 2030 (US$ Million)
10.5.6.1.1 Brazil Rugged Tablet Market Breakdown by Type
10.5.6.1.2 Brazil Rugged Tablet Market Breakdown by Operating System
10.5.6.1.3 Brazil Rugged Tablet Market Breakdown by Application
10.5.6.2 Argentina Rugged Tablet Market Revenue and Forecasts to 2030 (US$ Million)
10.5.6.2.1 Argentina Rugged Tablet Market Breakdown by Type
10.5.6.2.2 Argentina Rugged Tablet Market Breakdown by Operating System
10.5.6.2.3 Argentina Rugged Tablet Market Breakdown by Application
10.5.6.3 Columbia Rugged Tablet Market Revenue and Forecasts to 2030 (US$ Million)
10.5.6.3.1 Columbia Rugged Tablet Market Breakdown by Type
10.5.6.3.2 Columbia Rugged Tablet Market Breakdown by Operating System
10.5.6.3.3 Columbia Rugged Tablet Market Breakdown by Application
10.5.6.4 Rest of South & Central America Rugged Tablet Market Revenue and Forecasts to 2030 (US$ Million)
10.5.6.4.1 Rest of South & Central America Rugged Tablet Market Breakdown by Type
10.5.6.4.2 Rest of South & Central America Rugged Tablet Market Breakdown by Operating System
10.5.6.4.3 Rest of South & Central America Rugged Tablet Market Breakdown by Application
11. Rugged Tablet Market – Impact of COVID-19 Pandemic
11.1 Pre & Post Covid-19 Impact
12. Competitive Landscape
12.1 Heat Map Analysis By Key Players
12.2 Company Positioning & Concentration
13. Rugged Tablet Market Industry Landscape
13.1 Overview
13.2 Market Initiative
13.3 New Product Development
13.4 Merger and Acquisition
14. Company Profiles
14.1 AAEON Technology Inc
14.1.1 Key Facts
14.1.2 Business Description
14.1.3 Products and Services
14.1.4 Financial Overview
14.1.5 SWOT Analysis
14.1.6 Key Developments
14.2 Dell Technologies Inc
14.2.1 Key Facts
14.2.2 Business Description
14.2.3 Products and Services
14.2.4 Financial Overview
14.2.5 SWOT Analysis
14.2.6 Key Developments
14.3 DT Research Inc
14.3.1 Key Facts
14.3.2 Business Description
14.3.3 Products and Services
14.3.4 Financial Overview
14.3.5 SWOT Analysis
14.3.6 Key Developments
14.4 Panasonic Holdings Corp
14.4.1 Key Facts
14.4.2 Business Description
14.4.3 Products and Services
14.4.4 Financial Overview
14.4.5 SWOT Analysis
14.4.6 Key Developments
14.5 Getac Holdings Corp
14.5.1 Key Facts
14.5.2 Business Description
14.5.3 Products and Services
14.5.4 Financial Overview
14.5.5 SWOT Analysis
14.5.6 Key Developments
14.6 MilDef Group AB
14.6.1 Key Facts
14.6.2 Business Description
14.6.3 Products and Services
14.6.4 Financial Overview
14.6.5 SWOT Analysis
14.6.6 Key Developments
14.7 NEXCOM International Co Ltd
14.7.1 Key Facts
14.7.2 Business Description
14.7.3 Products and Services
14.7.4 Financial Overview
14.7.5 SWOT Analysis
14.7.6 Key Developments
14.8 Leonardo DRS Inc
14.8.1 Key Facts
14.8.2 Business Description
14.8.3 Products and Services
14.8.4 Financial Overview
14.8.5 SWOT Analysis
14.8.6 Key Developments
14.9 Zebra Technologies Corp
14.9.1 Key Facts
14.9.2 Business Description
14.9.3 Products and Services
14.9.4 Financial Overview
14.9.5 SWOT Analysis
14.9.6 Key Developments
14.10 Kontron AG
14.10.1 Key Facts
14.10.2 Business Description
14.10.3 Products and Services
14.10.4 Financial Overview
14.10.5 SWOT Analysis
14.10.6 Key Developments
15. Appendix
15.1 About The Insight Partners
15.2 Word Index
List of Tables
Table 1. Rugged Tablet Market Segmentation
Table 2. Rugged Tablet Market Revenue and Forecasts To 2030 (US$ Million) – By Region
Table 3. Rugged Tablet Market Revenue and Forecasts To 2030 (US$ Million) – Type
Table 4. Rugged Tablet Market Revenue and Forecasts To 2030 (US$ Million) – Operating System
Table 5. Rugged Tablet Market Revenue and Forecasts To 2030 (US$ Million) – Application
Table 6. North America Rugged Tablet Market Revenue and Forecasts To 2030 (US$ Mn) – By Type
Table 7. North America Rugged Tablet Market Revenue and Forecasts To 2030 (US$ Mn) – By Operating System
Table 8. North America Rugged Tablet Market Revenue and Forecasts To 2030 (US$ Mn) – By Application
Table 9. North America Rugged Tablet Market, by Country – Revenue and Forecast to 2030 (USD Million)
Table 10. US Rugged Tablet Market Revenue and Forecasts To 2030 (US$ Mn) – By Type
Table 11. US Rugged Tablet Market Revenue and Forecasts To 2030 (US$ Mn) – By Operating System
Table 12. US Rugged Tablet Market Revenue and Forecasts To 2030 (US$ Mn) – By Application
Table 13. Canada Rugged Tablet Market Revenue and Forecasts To 2030 (US$ Mn) – By Type
Table 14. Canada Rugged Tablet Market Revenue and Forecasts To 2030 (US$ Mn) – By Operating System
Table 15. Canada Rugged Tablet Market Revenue and Forecasts To 2030 (US$ Mn) – By Application
Table 16. Mexico Rugged Tablet Market Revenue and Forecasts To 2030 (US$ Mn) – By Type
Table 17. Mexico Rugged Tablet Market Revenue and Forecasts To 2030 (US$ Mn) – By Operating System
Table 18. Mexico Rugged Tablet Market Revenue and Forecasts To 2030 (US$ Mn) – By Application
Table 19. Europe Rugged Tablet Market Revenue and Forecasts To 2030 (US$ Mn) – By Type
Table 20. Europe Rugged Tablet Market Revenue and Forecasts To 2030 (US$ Mn) – By Operating System
Table 21. Europe Rugged Tablet Market Revenue and Forecasts To 2030 (US$ Mn) – By Application
Table 22. Europe Rugged Tablet Market, by Country – Revenue and Forecast to 2030 (USD Million)
Table 23. Germany Rugged Tablet Market Revenue and Forecasts To 2030 (US$ Mn) – By Type
Table 24. Germany Rugged Tablet Market Revenue and Forecasts To 2030 (US$ Mn) – By Operating System
Table 25. Germany Rugged Tablet Market Revenue and Forecasts To 2030 (US$ Mn) – By Application
Table 26. France Rugged Tablet Market Revenue and Forecasts To 2030 (US$ Mn) – By Type
Table 27. France Rugged Tablet Market Revenue and Forecasts To 2030 (US$ Mn) – By Operating System
Table 28. France Rugged Tablet Market Revenue and Forecasts To 2030 (US$ Mn) – By Application
Table 29. Italy Rugged Tablet Market Revenue and Forecasts To 2030 (US$ Mn) – By Type
Table 30. Italy Rugged Tablet Market Revenue and Forecasts To 2030 (US$ Mn) – By Operating System
Table 31. Italy Rugged Tablet Market Revenue and Forecasts To 2030 (US$ Mn) – By Application
Table 32. UK Rugged Tablet Market Revenue and Forecasts To 2030 (US$ Mn) – By Type
Table 33. UK Rugged Tablet Market Revenue and Forecasts To 2030 (US$ Mn) – By Operating System
Table 34. UK Rugged Tablet Market Revenue and Forecasts To 2030 (US$ Mn) – By Application
Table 35. Russia Rugged Tablet Market Revenue and Forecasts To 2030 (US$ Mn) – By Type
Table 36. Russia Rugged Tablet Market Revenue and Forecasts To 2030 (US$ Mn) – By Operating System
Table 37. Russia Rugged Tablet Market Revenue and Forecasts To 2030 (US$ Mn) – By Application
Table 38. Rest of Europe Rugged Tablet Market Revenue and Forecasts To 2030 (US$ Mn) – By Type
Table 39. Rest of Europe Rugged Tablet Market Revenue and Forecasts To 2030 (US$ Mn) – By Operating System
Table 40. Rest of Europe Rugged Tablet Market Revenue and Forecasts To 2030 (US$ Mn) – By Application
Table 41. Asia Pacific Rugged Tablet Market Revenue And Forecasts To 2030 (US$ Million) – Type
Table 42. Asia Pacific Rugged Tablet Market Revenue And Forecasts To 2030 (US$ Million) – Operating System
Table 43. Asia Pacific Rugged Tablet Market Revenue And Forecasts To 2030 (US$ Million) – Operating System
Table 44. Asia Pacific Rugged Tablet Market, by Country – Revenue and Forecast to 2030 (USD Million)
Table 45. Australia Rugged Tablet Market Revenue And Forecasts To 2030 (US$ Million) – Type
Table 46. Australia Rugged Tablet Market Revenue And Forecasts To 2030 (US$ Million) – Operating System
Table 47. Australia Rugged Tablet Market Revenue And Forecasts To 2030 (US$ Million) – Application
Table 48. China Rugged Tablet Market Revenue And Forecasts To 2030 (US$ Million) – Type
Table 49. China Rugged Tablet Market Revenue And Forecasts To 2030 (US$ Million) – Operating System
Table 50. China Rugged Tablet Market Revenue And Forecasts To 2030 (US$ Million) – Application
Table 51. India Rugged Tablet Market Revenue And Forecasts To 2030 (US$ Million) – Type
Table 52. India Rugged Tablet Market Revenue And Forecasts To 2030 (US$ Million) – Operating System
Table 53. India Rugged Tablet Market Revenue And Forecasts To 2030 (US$ Million) – Application
Table 54. Japan Rugged Tablet Market Revenue And Forecasts To 2030 (US$ Million) – Type
Table 55. Japan Rugged Tablet Market Revenue And Forecasts To 2030 (US$ Million) – Operating System
Table 56. Japan Rugged Tablet Market Revenue And Forecasts To 2030 (US$ Million) – Application
Table 57. South Korea Rugged Tablet Market Revenue And Forecasts To 2030 (US$ Million) – Type
Table 58. South Korea Rugged Tablet Market Revenue And Forecasts To 2030 (US$ Million) – Operating System
Table 59. South Korea Rugged Tablet Market Revenue And Forecasts To 2030 (US$ Million) – Application
Table 60. Indonesia Rugged Tablet Market Revenue And Forecasts To 2030 (US$ Million) – Type
Table 61. Indonesia Rugged Tablet Market Revenue And Forecasts To 2030 (US$ Million) – Operating System
Table 62. Indonesia Rugged Tablet Market Revenue And Forecasts To 2030 (US$ Million) – Application
Table 63. Singapore Rugged Tablet Market Revenue And Forecasts To 2030 (US$ Million) – Type
Table 64. Singapore Rugged Tablet Market Revenue And Forecasts To 2030 (US$ Million) – Operating System
Table 65. Singapore Rugged Tablet Market Revenue And Forecasts To 2030 (US$ Million) – Application
Table 66. Malaysia Rugged Tablet Market Revenue And Forecasts To 2030 (US$ Million) – Type
Table 67. Malaysia Rugged Tablet Market Revenue And Forecasts To 2030 (US$ Million) – Operating System
Table 68. Malaysia Rugged Tablet Market Revenue And Forecasts To 2030 (US$ Million) – Application
Table 69. Thailand Rugged Tablet Market Revenue And Forecasts To 2030 (US$ Million) – Type
Table 70. Thailand Rugged Tablet Market Revenue And Forecasts To 2030 (US$ Million) – Operating System
Table 71. Thailand Rugged Tablet Market Revenue And Forecasts To 2030 (US$ Million) – Application
Table 72. Philippines Rugged Tablet Market Revenue And Forecasts To 2030 (US$ Million) – Type
Table 73. Philippines Rugged Tablet Market Revenue And Forecasts To 2030 (US$ Million) – Operating System
Table 74. Philippines Rugged Tablet Market Revenue And Forecasts To 2030 (US$ Million) – Application
Table 75. Vietnam Rugged Tablet Market Revenue And Forecasts To 2030 (US$ Million) – Type
Table 76. Vietnam Rugged Tablet Market Revenue And Forecasts To 2030 (US$ Million) – Operating System
Table 77. Vietnam Rugged Tablet Market Revenue And Forecasts To 2030 (US$ Million) – Application
Table 78. Rest of Asia Pacific Rugged Tablet Market Revenue And Forecasts To 2030 (US$ Million) – Type
Table 79. Rest of Asia Pacific Rugged Tablet Market Revenue And Forecasts To 2030 (US$ Million) – Operating System
Table 80. Rest of Asia Pacific Rugged Tablet Market Revenue And Forecasts To 2030 (US$ Million) – Application
Table 81. Middle East & Africa Rugged Tablet Market Revenue and Forecasts To 2030 (US$ Million) – By Type
Table 82. Middle East & Africa Rugged Tablet Market Revenue and Forecasts To 2030 (US$ Million) – By Operating System
Table 83. Middle East & Africa Rugged Tablet Market Revenue and Forecasts To 2030 (US$ Million) – By Application
Table 84. Middle East and Africa Rugged Tablet Market, by Country – Revenue and Forecast to 2030 (USD Million)
Table 85. South Africa Rugged Tablet Market Revenue and Forecasts To 2030 (US$ Million) – By Type
Table 86. South Africa Rugged Tablet Market Revenue and Forecasts To 2030 (US$ Million) – By Operating System
Table 87. South Africa Rugged Tablet Market Revenue and Forecasts To 2030 (US$ Million) – By Application
Table 88. Saudi Arabia Rugged Tablet Market Revenue and Forecasts To 2030 (US$ Million) – By Type
Table 89. Saudi Arabia Rugged Tablet Market Revenue and Forecasts To 2030 (US$ Million) – By Operating System
Table 90. Saudi Arabia Rugged Tablet Market Revenue and Forecasts To 2030 (US$ Million) – By Application
Table 91. UAE Rugged Tablet Market Revenue and Forecasts To 2030 (US$ Million) – By Type
Table 92. UAE Rugged Tablet Market Revenue and Forecasts To 2030 (US$ Million) – By Operating System
Table 93. UAE Rugged Tablet Market Revenue and Forecasts To 2030 (US$ Million) – By Application
Table 94. Turkey Rugged Tablet Market Revenue and Forecasts To 2030 (US$ Million) – By Type
Table 95. Turkey Rugged Tablet Market Revenue and Forecasts To 2030 (US$ Million) – By Operating System
Table 96. Turkey Rugged Tablet Market Revenue and Forecasts To 2030 (US$ Million) – By Application
Table 97. Nigeria Rugged Tablet Market Revenue and Forecasts To 2030 (US$ Million) – By Type
Table 98. Nigeria Rugged Tablet Market Revenue and Forecasts To 2030 (US$ Million) – By Operating System
Table 99. Nigeria Rugged Tablet Market Revenue and Forecasts To 2030 (US$ Million) – By Application
Table 100. Egypt Rugged Tablet Market Revenue and Forecasts To 2030 (US$ Million) – By Type
Table 101. Egypt Rugged Tablet Market Revenue and Forecasts To 2030 (US$ Million) – By Operating System
Table 102. Egypt Rugged Tablet Market Revenue and Forecasts To 2030 (US$ Million) – By Application
Table 103. Rest of Middle East & Africa Rugged Tablet Market Revenue and Forecasts To 2030 (US$ Million) – By Type
Table 104. Rest of Middle East & Africa Rugged Tablet Market Revenue and Forecasts To 2030 (US$ Million) – By Operating System
Table 105. Rest of Middle East & Africa Rugged Tablet Market Revenue and Forecasts To 2030 (US$ Million) – By Application
Table 106. South & Central America Rugged Tablet Market Revenue and Forecasts To 2030 (US$ Million) – By Type
Table 107. South & Central America Rugged Tablet Market Revenue and Forecasts To 2030 (US$ Million) – By Operating System
Table 108. South & Central America Rugged Tablet Market Revenue and Forecasts To 2030 (US$ Million) – By Application
Table 109. South and Central America Rugged Tablet Market, by Country – Revenue and Forecast to 2030 (USD Million)
Table 110. Brazil Rugged Tablet Market Revenue and Forecasts To 2030 (US$ Million) – By Type
Table 111. Brazil Rugged Tablet Market Revenue and Forecasts To 2030 (US$ Million) – By Operating System
Table 112. Brazil Rugged Tablet Market Revenue and Forecasts To 2030 (US$ Million) – By Application
Table 113. Argentina Rugged Tablet Market Revenue and Forecasts To 2030 (US$ Million) – By Type
Table 114. Argentina Rugged Tablet Market Revenue and Forecasts To 2030 (US$ Million) – By Operating System
Table 115. Argentina Rugged Tablet Market Revenue and Forecasts To 2030 (US$ Million) – By Application
Table 116. Columbia Rugged Tablet Market Revenue and Forecasts To 2030 (US$ Million) – By Type
Table 117. Columbia Rugged Tablet Market Revenue and Forecasts To 2030 (US$ Million) – By Operating System
Table 118. Columbia Rugged Tablet Market Revenue and Forecasts To 2030 (US$ Million) – By Application
Table 119. Rest of South & Central America Rugged Tablet Market Revenue and Forecasts To 2030 (US$ Million) – By Type
Table 120. Rest of South & Central America Rugged Tablet Market Revenue and Forecasts To 2030 (US$ Million) – By Operating System
Table 121. Rest of South & Central America Rugged Tablet Market Revenue and Forecasts To 2030 (US$ Million) – By Application
Table 122. Company Positioning & Concentration
Table 123. List of Abbreviation
List of Figures
Figure 1. Rugged Tablet Market Segmentation, By Geography
Figure 2. Global– PEST Analysis
Figure 3. Ecosystem: Rugged Tablet Market
Figure 4. Rugged Tablet Market - Key Industry Dynamics
Figure 5. Impact Analysis of Drivers And Restraints
Figure 6. Rugged Tablet Market Revenue (US$ Million), 2022 – 2030
Figure 7. Rugged Tablet Market Share (%) – Type, 2022 and 2030
Figure 8. Rugged Tablet Market Share (%) – Operating System, 2022 and 2030
Figure 9. Rugged Tablet Market Share (%) – Application, 2022 and 2030
Figure 10. Rugged Tablet Market Breakdown by Geography, 2022 and 2030 (US$ Mn)
Figure 11. Rugged Tablet Market Revenue and Forecasts To 2030 (US$ Mn)
Figure 12. Rugged Tablet Market Breakdown by Type (2022 and 2030)
Figure 13. Rugged Tablet market Breakdown by Operating System, 2022 and 2030 (%)
Figure 14. Rugged Tablet market Breakdown by Application, 2022 and 2030 (%)
Figure 15. Rugged Tablet market Breakdown by Key Countries, 2022 and 2030 (%)
Figure 16. US Rugged Tablet Market Revenue and Forecasts To 2030 (US$ Mn)
Figure 17. Canada Rugged Tablet Market Revenue and Forecasts To 2030 (US$ Mn)
Figure 18. Mexico Rugged Tablet Market Revenue and Forecasts To 2030 (US$ Mn)
Figure 19. Rugged Tablet Market Revenue and Forecasts To 2030 (US$ Mn)
Figure 20. Rugged Tablet Market Breakdown by Type (2022 and 2030)
Figure 21. Rugged Tablet Market Breakdown by Operating System (2022 and 2030)
Figure 22. Rugged Tablet Market Breakdown by Application (2022 and 2030)
Figure 23. Rugged Tablet market Breakdown by Key Countries, 2022 and 2030 (%)
Figure 24. Germany Rugged Tablet Market Revenue and Forecasts To 2030 (US$ Mn)
Figure 25. France Rugged Tablet Market Revenue and Forecasts To 2030 (US$ Mn)
Figure 26. Italy Rugged Tablet Market Revenue and Forecasts To 2030 (US$ Mn)
Figure 27. UK Rugged Tablet Market Revenue and Forecasts To 2030 (US$ Mn)
Figure 28. Russia Rugged Tablet Market Revenue and Forecasts To 2030 (US$ Mn)
Figure 29. Rest of Europe Rugged Tablet Market Revenue and Forecasts To 2030 (US$ Mn)
Figure 30. Asia Pacific Rugged Tablet Market Revenue And Forecasts To 2030 (US$ Million)
Figure 31. Asia Pacific Rugged Tablet Market Breakdown by Type (2022 and 2023)
Figure 32. Asia Pacific Rugged Tablet Market Breakdown by Operating System (2022 and 2023)
Figure 33. Asia Pacific Rugged Tablet Market Breakdown by Application (2022 and 2023)
Figure 34. Asia Pacific Rugged Tablet Market Breakdown By Key Countries, 2022 And 2030 (%)
Figure 35. Australia Rugged Tablet Market Revenue And Forecasts To 2030 (US$ Million)
Figure 36. China Rugged Tablet Market Revenue And Forecasts To 2030 (US$ Million)
Figure 37. India Rugged Tablet Market Revenue And Forecasts To 2030 (US$ Million)
Figure 38. Japan Rugged Tablet Market Revenue And Forecasts To 2030 (US$ Million)
Figure 39. South Korea Rugged Tablet Market Revenue And Forecasts To 2030 (US$ Million)
Figure 40. Indonesia Rugged Tablet Market Revenue And Forecasts To 2030 (US$ Million)
Figure 41. Singapore Rugged Tablet Market Revenue And Forecasts To 2030 (US$ Million)
Figure 42. Malaysia Rugged Tablet Market Revenue And Forecasts To 2030 (US$ Million)
Figure 43. Thailand Rugged Tablet Market Revenue And Forecasts To 2030 (US$ Million)
Figure 44. Philippines Rugged Tablet Market Revenue And Forecasts To 2030 (US$ Million)
Figure 45. Vietnam Rugged Tablet Market Revenue And Forecasts To 2030 (US$ Million)
Figure 46. Rest of Asia Pacific Rugged Tablet Market Revenue And Forecasts To 2030 (US$ Million)
Figure 47. Rugged Tablet Market Revenue and Forecasts To 2030 (US$ Million)
Figure 48. Middle East & Africa Rugged Tablet Market Breakdown by Type (2022 and 2023)
Figure 49. Middle East & Africa Rugged Tablet Market Breakdown by Operating System (2022 and 2023)
Figure 50. Middle East & Africa Rugged Tablet Market Breakdown by Application (2022 and 2023)
Figure 51. Rugged Tablet Market Breakdown by Key Countries, 2022 and 2030 (%)
Figure 52. South Africa Rugged Tablet Market Revenue and Forecasts To 2030 (US$ Million)
Figure 53. Saudi Arabia Rugged Tablet Market Revenue and Forecasts To 2030 (US$ Million)
Figure 54. UAE Rugged Tablet Market Revenue and Forecasts To 2030 (US$ Million)
Figure 55. Turkey Rugged Tablet Market Revenue and Forecasts To 2030 (US$ Million)
Figure 56. Nigeria Rugged Tablet Market Revenue and Forecasts To 2030 (US$ Million)
Figure 57. Egypt Rugged Tablet Market Revenue and Forecasts To 2030 (US$ Million)
Figure 58. Rest of Middle East & Africa Rugged Tablet Market Revenue and Forecasts To 2030 (US$ Million)
Figure 59. Rugged Tablet Market Revenue and Forecasts To 2030 (US$ Million)
Figure 60. South & Central America Rugged Tablet Market Breakdown by Type (2022 and 2023)
Figure 61. South & Central America Rugged Tablet Market Breakdown by Operating System (2022 and 2023)
Figure 62. South & Central America Rugged Tablet Market Breakdown by Application (2022 and 2023)
Figure 63. Rugged Tablet Market Breakdown by Key Countries, 2022 and 2030 (%)
Figure 64. Brazil Rugged Tablet Market Revenue and Forecasts To 2030 (US$ Million)
Figure 65. Argentina Rugged Tablet Market Revenue and Forecasts To 2030 (US$ Million)
Figure 66. Columbia Rugged Tablet Market Revenue and Forecasts To 2030 (US$ Million)
Figure 67. Rest of South & Central America Rugged Tablet Market Revenue and Forecasts To 2030 (US$ Million)
Figure 68. Heat Map Analysis By Key Players
The List of Companies - Rugged Tablet Market
- AAEON Technology Inc
- Dell Technologies Inc
- DT Research Inc
- Panasonic Holdings Corp
- Getac Holdings Corp
- MilDef Group AB
- NEXCOM International Co Ltd
- Leonardo DRS Inc
- Zebra Technologies Corp
- Kontron AG
The Insight Partners performs research in 4 major stages: Data Collection & Secondary Research, Primary Research, Data Analysis and Data Triangulation & Final Review.
- Data Collection and Secondary Research:
As a market research and consulting firm operating from a decade, we have published many reports and advised several clients across the globe. First step for any study will start with an assessment of currently available data and insights from existing reports. Further, historical and current market information is collected from Investor Presentations, Annual Reports, SEC Filings, etc., and other information related to company’s performance and market positioning are gathered from Paid Databases (Factiva, Hoovers, and Reuters) and various other publications available in public domain.
Several associations trade associates, technical forums, institutes, societies and organizations are accessed to gain technical as well as market related insights through their publications such as research papers, blogs and press releases related to the studies are referred to get cues about the market. Further, white papers, journals, magazines, and other news articles published in the last 3 years are scrutinized and analyzed to understand the current market trends.
- Primary Research:
The primarily interview analysis comprise of data obtained from industry participants interview and answers to survey questions gathered by in-house primary team.
For primary research, interviews are conducted with industry experts/CEOs/Marketing Managers/Sales Managers/VPs/Subject Matter Experts from both demand and supply side to get a 360-degree view of the market. The primary team conducts several interviews based on the complexity of the markets to understand the various market trends and dynamics which makes research more credible and precise.
A typical research interview fulfils the following functions:
- Provides first-hand information on the market size, market trends, growth trends, competitive landscape, and outlook
- Validates and strengthens in-house secondary research findings
- Develops the analysis team’s expertise and market understanding
Primary research involves email interactions and telephone interviews for each market, category, segment, and sub-segment across geographies. The participants who typically take part in such a process include, but are not limited to:
- Industry participants: VPs, business development managers, market intelligence managers and national sales managers
- Outside experts: Valuation experts, research analysts and key opinion leaders specializing in the electronics and semiconductor industry.
Below is the breakup of our primary respondents by company, designation, and region:

Once we receive the confirmation from primary research sources or primary respondents, we finalize the base year market estimation and forecast the data as per the macroeconomic and microeconomic factors assessed during data collection.
- Data Analysis:
Once data is validated through both secondary as well as primary respondents, we finalize the market estimations by hypothesis formulation and factor analysis at regional and country level.
- 3.1 Macro-Economic Factor Analysis:
We analyse macroeconomic indicators such the gross domestic product (GDP), increase in the demand for goods and services across industries, technological advancement, regional economic growth, governmental policies, the influence of COVID-19, PEST analysis, and other aspects. This analysis aids in setting benchmarks for various nations/regions and approximating market splits. Additionally, the general trend of the aforementioned components aid in determining the market's development possibilities.
- 3.2 Country Level Data:
Various factors that are especially aligned to the country are taken into account to determine the market size for a certain area and country, including the presence of vendors, such as headquarters and offices, the country's GDP, demand patterns, and industry growth. To comprehend the market dynamics for the nation, a number of growth variables, inhibitors, application areas, and current market trends are researched. The aforementioned elements aid in determining the country's overall market's growth potential.
- 3.3 Company Profile:
The “Table of Contents” is formulated by listing and analyzing more than 25 - 30 companies operating in the market ecosystem across geographies. However, we profile only 10 companies as a standard practice in our syndicate reports. These 10 companies comprise leading, emerging, and regional players. Nonetheless, our analysis is not restricted to the 10 listed companies, we also analyze other companies present in the market to develop a holistic view and understand the prevailing trends. The “Company Profiles” section in the report covers key facts, business description, products & services, financial information, SWOT analysis, and key developments. The financial information presented is extracted from the annual reports and official documents of the publicly listed companies. Upon collecting the information for the sections of respective companies, we verify them via various primary sources and then compile the data in respective company profiles. The company level information helps us in deriving the base number as well as in forecasting the market size.
- 3.4 Developing Base Number:
Aggregation of sales statistics (2020-2022) and macro-economic factor, and other secondary and primary research insights are utilized to arrive at base number and related market shares for 2022. The data gaps are identified in this step and relevant market data is analyzed, collected from paid primary interviews or databases. On finalizing the base year market size, forecasts are developed on the basis of macro-economic, industry and market growth factors and company level analysis.
- Data Triangulation and Final Review:
The market findings and base year market size calculations are validated from supply as well as demand side. Demand side validations are based on macro-economic factor analysis and benchmarks for respective regions and countries. In case of supply side validations, revenues of major companies are estimated (in case not available) based on industry benchmark, approximate number of employees, product portfolio, and primary interviews revenues are gathered. Further revenue from target product/service segment is assessed to avoid overshooting of market statistics. In case of heavy deviations between supply and demand side values, all thes steps are repeated to achieve synchronization.
We follow an iterative model, wherein we share our research findings with Subject Matter Experts (SME’s) and Key Opinion Leaders (KOLs) until consensus view of the market is not formulated – this model negates any drastic deviation in the opinions of experts. Only validated and universally acceptable research findings are quoted in our reports.
We have important check points that we use to validate our research findings – which we call – data triangulation, where we validate the information, we generate from secondary sources with primary interviews and then we re-validate with our internal data bases and Subject matter experts. This comprehensive model enables us to deliver high quality, reliable data in shortest possible time.
 Get Free Sample For