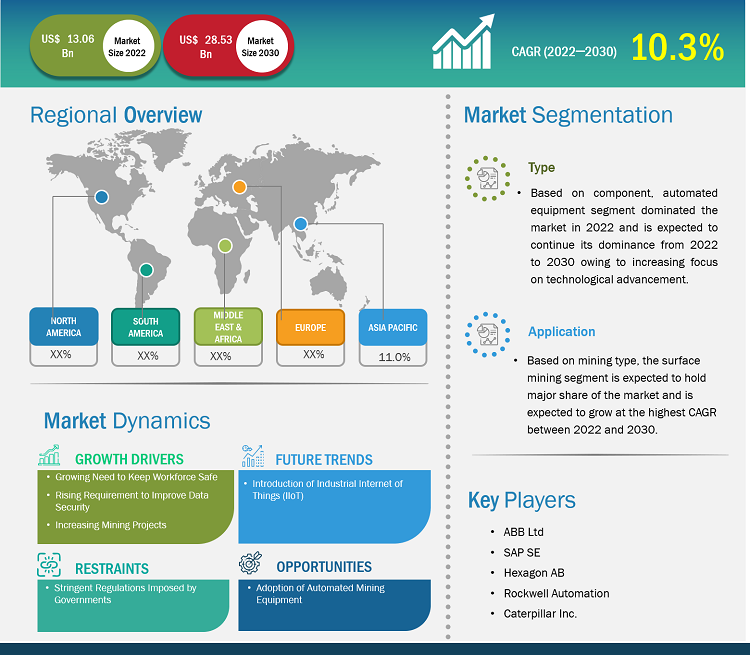
The smart mining market size was valued at US$ 13.06 billion in 2022, and it is expected to reach US$ 28.53 billion by 2030. The smart mining market is estimated to register a CAGR of 10.3% from 2022 to 2030. The introduction of the Internet of Things (IoT) is likely to remain a key trend in the market.
Smart Mining Market Analysis
Rising awareness related to the benefits provided by smart mining equipment and technologies and the growing need to keep the workforce safe are driving the market. The market is anticipated to grow during the forecast period, due to the growing demand for smart mining components among firms to improve data security. Moreover, government support for the installation of smart mining technologies and the rising adoption of automated mining equipment are creating lucrative opportunities for the market.
Smart Mining Market Overview
Smart mining refers to the use of linked technology in the mining sector. These technologies include cameras, sensors, and drones that communicate with one another and their surroundings over the Internet. Device networks help to automate processes, simplify operations, collect data, and connect various sections of the mining process. Smart mining technology helps mines boost efficiency, save money, keep workers safe, and reduce pollution.
Customize Research To Suit Your Requirement
We can optimize and tailor the analysis and scope which is unmet through our standard offerings. This flexibility will help you gain the exact information needed for your business planning and decision making.
Smart Mining Market: Strategic Insights
Market Size Value in US$ 13.06 billion in 2022 Market Size Value by US$ 28.53 billion by 2030 Growth rate CAGR of 10.3% from 2022 to 2030 Forecast Period 2022-2030 Base Year 2022

Naveen
Have a question?
Naveen will walk you through a 15-minute call to present the report’s content and answer all queries if you have any.
 Speak to Analyst
Customize Research To Suit Your Requirement
We can optimize and tailor the analysis and scope which is unmet through our standard offerings. This flexibility will help you gain the exact information needed for your business planning and decision making.
Smart Mining Market: Strategic Insights
| Market Size Value in | US$ 13.06 billion in 2022 |
| Market Size Value by | US$ 28.53 billion by 2030 |
| Growth rate | CAGR of 10.3% from 2022 to 2030 |
| Forecast Period | 2022-2030 |
| Base Year | 2022 |
Naveen
Have a question?
Naveen will walk you through a 15-minute call to present the report’s content and answer all queries if you have any.
Speak to Analyst
Smart Mining Market Drivers and Opportunities
Rising Awareness Related to the Benefits Provided by Smart Mining Equipment and Technologies to Favor the Market
The world is exploring smart mining technologies to improve its mining industry. The growth in digitalization and industrial automation helps mining companies improve their operational efficiency. These benefits help the country expand its mining activities. For instance, in 2023, the Government of Italy announced the resuming of critical raw materials mining operations. The mine contains numerous materials, such as lithium, cobalt, nickel, copper, zinc, beryllium, and tungsten. The government also estimated that the country holds at least 15 of the 34 elements in the ground. The resuming of mining activities require smart equipment and technologies to streamline the mining operations. These smart mining techniques help the workers improve productivity by minimizing environmental impact.
Government Support for the Installation of Smart Mining Technologies
The government has also installed smart mining technologies in more than 1,000 working coal facilities to increase the annual production capacity to over 620 million tons. Furthermore, the country is modernizing coal facilities by deploying The Hongliulin "intelligent mine" in coal-belt Shaanxi province to remove peak greenhouse gas emissions by 2030. The sustainability benefits of smart mining technologies fuel the market in the country. Thus, the increasing number of awareness programs, conferences, exhibitions, etc., are likely to create growth opportunities in the smart mining market during the forecast period.
Smart Mining Market Report Segmentation Analysis
Key segments that contributed to the derivation of the smart mining market analysis are component and mining type.
- Based on component, the smart mining market is divided into automated equipment, hardware components, software solutions, and services. The automated equipment segment is segmented into load haul dump, robotic truck, driller & breaker, excavator, and others. The hardware component segment is divided into RFID tags, sensors, intelligent systems, and others. The software solution segment is segmented into logistics software and solutions, data & operation management software and solutions, safety & security systems, connectivity solutions, analytics solutions, remote management solutions, and asset management solutions. The automated equipment segment held a larger market share in 2022.
- On the basis of mining type, the market is divided into underground mining and surface mining. The underground mining segment held a larger market share in 2022.
Smart Mining Market Share Analysis by Geography
The geographic scope of the smart mining market report is mainly divided into five regions: North America, Asia Pacific, Europe, Middle East & Africa, and South & Central America.
The market in Europe is projected to expand during the forecast period due to the growing number of mining activities. For instance, in October 2022, Imerys Mining launched the EMILI (Imerys' Lithium mica mining project) project to mine lithium in France. The project will produce 34,000 tons of lithium hydroxide annually from 2028 onwards, which improve France's and Europe's industrial sovereignty to increase lithium-battery production. The projects help Imerys Mining to integrate and enhance its energy transition capabilities to reduce the carbon footprint associated with mining activities. Lithium mining often involves using autonomous vehicles and robotic systems to increase the efficiency and safety of mines. The growing adoption of smart mining technologies in France is expected to fuel the market.
Smart Mining Market Report Scope
Smart Mining Market News and Recent Developments
The smart mining market is evaluated by gathering qualitative and quantitative data post primary and secondary research, which includes important corporate publications, association data, and databases. A few of the developments in the smart mining market are listed below:
- The mining leader has deployed the ABB Ability Operations Management System & (OMS 41; at the Mine 740 km northeast of Perth. The OMS contributes to GoldField's digital transformation of the Granny Smith operation, aiming to improve productivity and streamline data flow to enable timely decision-making. Approximately 1.6 million tpy of gold-bearing ore is extracted from the underground Mine and treated at the site's processing plant. (Source: ABB Ltd, Company Website, September 2023)
Smart Mining Market Report Coverage and Deliverables
The “Smart Mining Market Size and Forecast (2020–2030)” report provides a detailed analysis of the market covering below areas:
- Smart mining market size and forecast at global, regional, and country levels for all the key market segments covered under the scope
- Smart mining market trends as well as market dynamics such as drivers, restraints, and key opportunities
- Detailed PEST/Porter’s Five Forces and SWOT analysis
- Smart mining market analysis covering key market trends, global and regional framework, major players, regulations, and recent market developments
- Industry landscape and competition analysis covering market concentration, heat map analysis, prominent players, and recent developments for the smart mining market
- Detailed company profiles

Report Coverage
Revenue forecast, Company Analysis, Industry landscape, Growth factors, and Trends

Segment Covered
Component, and Mining Type

Regional Scope
North America, Europe, Asia Pacific, Middle East & Africa, South & Central America

Country Scope
This text is related
to country scope.
Frequently Asked Questions
The global smart mining market is expected to reach US$ 28.53 billion by 2030.
The key players holding majority shares in the global smart mining market are ABB Ltd, Alastri, Caterpillar Inc, Intellisense.io, Hexagon AB, Hitachi Ltd, MineSense, Rockwell Automation Inc, SAP SE, and Trimble Inc.
Asia Pacific dominated the smart mining market in 2022.
The global smart mining market is estimated to register a CAGR of 10.3% during the forecast period 2022–2030.
Growing demand and adoption of consumer electronics products among consumers Rising awareness related to the benefits provided by smart mining equipment and technologies and the growing need to keep the workforce safe are the major factors that propel the global smart mining market.
The introduction of the Internet of Things (IoT) to play a significant role in the global smart mining market in the coming years.
1. Introduction
1.1 The Insight Partners Research Report Guidance
1.2 Market Segmentation
2. Executive Summary
2.1 Key Insights
2.2 Market Attractiveness
3. Research Methodology
3.1 Coverage
3.2 Secondary Research
3.3 Primary Research
4. Smart Mining Market Landscape
4.1 Overview
4.2 PEST Analysis
4.3 Ecosystem Analysis
4.3.1 Hardware and Software Solutions providers:
4.3.2 System Integrator Service Provider:
4.3.3 End User
4.3.4 List of Vendors in Value Chain
5. Smart Mining Market - Key Industry Dynamics
5.1 Drivers
5.1.1 Growing Need to Keep Workforce Safe
5.1.2 Rising Requirement to Improve Data Security
5.1.3 Increasing Mining Projects
5.2 Market Restraints
5.2.1 Stringent Regulations Imposed by Governments
5.3 Market Opportunities
5.3.1 Adoption of Automated Mining Equipment
5.4 Future Trends
5.4.1 Introduction of Industrial Internet of Things (IIoT)
5.5 Impact of Drivers and Restraints:
6. Smart Mining Market - Global Market Analysis
6.1 Smart Mining Market Revenue (US$ Million), 2022 – 2030
7. Smart Mining Market Analysis - Component
7.1 Automated Equipment
7.1.1 Overview
7.1.2 Automated Equipment Market Revenue and Forecasts To 2030 (US$ Million)
7.1.2.1 Load Haul Dump Market Revenue and Forecasts To 2030 (US$ Million)
7.1.2.2 Robotic Truck Market Revenue and Forecasts To 2030 (US$ Million)
7.1.2.3 Driller & Breaker Market Revenue and Forecasts To 2030 (US$ Million)
7.1.2.4 Excavator Market Revenue and Forecasts To 2030 (US$ Million)
7.1.2.5 Other Automated Equipment Market Revenue and Forecasts To 2030 (US$ Million)
7.2 Hardware Component
7.2.1 Overview
7.2.2 Hardware Component Market Revenue and Forecasts To 2030 (US$ Million)
7.2.2.1 RFID Tags Market Revenue and Forecasts To 2030 (US$ Million)
7.2.2.1.1 Overview
7.2.2.2 Sensors Market Revenue and Forecasts To 2030 (US$ Million)
7.2.2.2.1 Overview
7.2.2.3 Intelligent System Market Revenue and Forecasts To 2030 (US$ Million)
7.2.2.3.1 Overview
7.2.2.4 Others Market Revenue and Forecasts To 2030 (US$ Million)
7.2.2.4.1 Overview
7.3 Software Solution
7.3.1 Overview
7.3.2 Software Solution Market Revenue and Forecasts To 2030 (US$ Million)
7.3.2.1 Logistics Software and Solutions Market Revenue and Forecasts To 2030 (US$ Million)
7.3.2.1.1 Overview
7.3.2.2 Data & Operation Management Software and Solutions Market Revenue and Forecasts To 2030 (US$ Million)
7.3.2.2.1 Overview
7.3.2.3 Safety & Security Systems Market Revenue and Forecasts To 2030 (US$ Million)
7.3.2.3.1 Overview
7.3.2.4 Connectivity Solutions Market Revenue and Forecasts To 2030 (US$ Million)
7.3.2.4.1 Overview
7.3.2.5 Analytics Solutions Market Revenue and Forecasts To 2030 (US$ Million)
7.3.2.5.1 Overview
7.3.2.6 Remote Management Solutions Market Revenue and Forecasts To 2030 (US$ Million)
7.3.2.6.1 Overview
7.3.2.7 Asset Management Solutions Market Revenue and Forecasts To 2030 (US$ Million)
7.3.2.7.1 Overview
7.4 Services
7.4.1 Overview
7.4.2 Services Market Revenue and Forecasts To 2030 (US$ Million)
8. Smart Mining Market Analysis - Mining Type
8.1 Underground Mining
8.1.1 Overview
8.1.2 Underground Mining Market Revenue and Forecasts To 2030 (US$ Million)
8.2 Surface Mining
8.2.1 Overview
8.2.2 Surface Mining Market Revenue and Forecasts To 2030 (US$ Million)
9. Smart Mining Market - Geographical Analysis
9.1 North America
9.1.1 North America Smart Mining Market Overview
9.1.2 North America Smart Mining Market Revenue and Forecasts to 2030 (US$ Mn)
9.1.3 North America Smart Mining Market Breakdown by Component
9.1.3.1 North America Smart Mining Market Revenue and Forecasts and Analysis - By Component
9.1.4 North America Smart Mining Market Breakdown by Mining Type
9.1.4.1 North America Smart Mining Market Revenue and Forecasts and Analysis - By Mining Type
9.1.5 North America Smart Mining Market Revenue and Forecasts and Analysis - By Countries
9.1.5.1 North America Smart Mining Market Revenue and Forecasts and Analysis - By Country
9.1.5.2 US Smart Mining Market Revenue and Forecasts to 2030 (US$ Mn)
9.1.5.2.1 US Smart Mining Market Breakdown by Component
9.1.5.2.2 US Smart Mining Market Breakdown by Mining Type
9.1.5.3 Canada Smart Mining Market Revenue and Forecasts to 2030 (US$ Mn)
9.1.5.3.1 Canada Smart Mining Market Breakdown by Component
9.1.5.3.2 Canada Smart Mining Market Breakdown by Mining Type
9.1.5.4 Mexico Smart Mining Market Revenue and Forecasts to 2030 (US$ Mn)
9.1.5.4.1 Mexico Smart Mining Market Breakdown by Component
9.1.5.4.2 Mexico Smart Mining Market Breakdown by Mining Type
9.2 Europe
9.2.1 Europe Smart Mining Market Overview
9.2.2 Europe Smart Mining Market Revenue and Forecasts to 2030 (US$ Mn)
9.2.3 Europe Smart Mining Market Breakdown by Component
9.2.3.1 Europe Smart Mining Market Revenue and Forecasts and Analysis - By Component
9.2.4 Europe Smart Mining Market Breakdown by Mining Type
9.2.4.1 Europe Smart Mining Market Revenue and Forecasts and Analysis - By Mining Type
9.2.5 Europe Smart Mining Market Revenue and Forecasts and Analysis - By Countries
9.2.5.1 Germany Smart Mining Market Revenue and Forecasts to 2030 (US$ Mn)
9.2.5.1.1 Germany Smart Mining Market Breakdown by Component
9.2.5.1.2 Germany Smart Mining Market Breakdown by Mining Type
9.2.5.2 France Smart Mining Market Revenue and Forecasts to 2030 (US$ Mn)
9.2.5.2.1 France Smart Mining Market Breakdown by Component
9.2.5.2.2 France Smart Mining Market Breakdown by Mining Type
9.2.5.3 Italy Smart Mining Market Revenue and Forecasts to 2030 (US$ Mn)
9.2.5.3.1 Italy Smart Mining Market Breakdown by Component
9.2.5.3.2 Italy Smart Mining Market Breakdown by Mining Type
9.2.5.4 UK Smart Mining Market Revenue and Forecasts to 2030 (US$ Mn)
9.2.5.4.1 UK Smart Mining Market Breakdown by Component
9.2.5.4.2 UK Smart Mining Market Breakdown by Mining Type
9.2.5.5 Russia Smart Mining Market Revenue and Forecasts to 2030 (US$ Mn)
9.2.5.5.1 Russia Smart Mining Market Breakdown by Component
9.2.5.5.2 Russia Smart Mining Market Breakdown by Mining Type
9.2.5.6 Rest of Europe Smart Mining Market Revenue and Forecasts to 2030 (US$ Mn)
9.2.5.6.1 Rest of Europe Smart Mining Market Breakdown by Component
9.2.5.6.2 Rest of Europe Smart Mining Market Breakdown by Mining Type
9.3 Asia Pacific Smart Mining Market
9.3.1 Asia Pacific Smart Mining Market Overview
9.3.2 Asia Pacific Smart Mining Market Revenue and Forecasts To 2030 (US$ Million)
9.3.3 Asia Pacific Smart Mining Market Breakdown by Component
9.3.3.1 Asia Pacific Smart Mining Market Revenue and Forecasts and Analysis - By Component
9.3.4 Asia Pacific Smart Mining Market Breakdown by Mining Type
9.3.4.1 Asia Pacific Smart Mining Market Revenue and Forecasts and Analysis - By Mining Type
9.3.5 Smart Mining market Breakdown by Country
9.3.5.1 Australia Smart Mining Market Revenue and Forecasts To 2030 (US$ Million)
9.3.5.1.1 Australia Smart Mining Market Breakdown by Component
9.3.5.1.2 Australia Smart Mining Market Breakdown by Mining Type
9.3.5.2 China Smart Mining Market Revenue and Forecasts To 2030 (US$ Million)
9.3.5.2.1 China Smart Mining Market Breakdown by Component
9.3.5.2.2 China Smart Mining Market Breakdown by Mining Type
9.3.5.3 India Smart Mining Market Revenue and Forecasts To 2030 (US$ Million)
9.3.5.3.1 India Smart Mining Market Breakdown by Component
9.3.5.3.2 India Smart Mining Market Breakdown by Mining Type
9.3.5.4 Japan Smart Mining Market Revenue and Forecasts To 2030 (US$ Million)
9.3.5.4.1 Japan Smart Mining Market Breakdown by Component
9.3.5.4.2 Japan Smart Mining Market Breakdown by Mining Type
9.3.5.5 South Korea Smart Mining Market Revenue and Forecasts To 2030 (US$ Million)
9.3.5.5.1 South Korea Smart Mining Market Breakdown by Component
9.3.5.5.2 South Korea Smart Mining Market Breakdown by Mining Type
9.3.5.6 Rest of Asia Pacific Smart Mining Market Revenue and Forecasts To 2030 (US$ Million)
9.3.5.6.1 Rest of Asia Pacific Smart Mining Market Breakdown by Component
9.3.5.6.2 Rest of Asia Pacific Smart Mining Market Breakdown by Mining Type
9.4 Middle East & Africa
9.4.1 Middle East & Africa Smart Mining Market Overview
9.4.2 Middle East & Africa Smart Mining Market Revenue and Forecasts to 2030 (US$ Million)
9.4.3 Middle East & Africa Smart Mining Market Breakdown by Component
9.4.3.1 Middle East & Africa Smart Mining Market and Forecasts and Analysis - By Component
9.4.4 Middle East & Africa Smart Mining Market Breakdown by Mining Type
9.4.4.1 Middle East & Africa Smart Mining Market and Forecasts and Analysis - By Mining Type
9.4.5 Middle East & Africa Smart Mining Market Revenue and Forecasts and Analysis - By Countries
9.4.5.1 South Africa Smart Mining Market Revenue and Forecasts to 2030 (US$ Million)
9.4.5.1.1 South Africa Smart Mining Market Breakdown by Component
9.4.5.1.2 South Africa Smart Mining Market Breakdown by Mining Type
9.4.5.2 Saudi Arabia Smart Mining Market Revenue and Forecasts to 2030 (US$ Million)
9.4.5.2.1 Saudi Arabia Smart Mining Market Breakdown by Component
9.4.5.2.2 Saudi Arabia Smart Mining Market Breakdown by Mining Type
9.4.5.3 UAE Smart Mining Market Revenue and Forecasts to 2030 (US$ Million)
9.4.5.3.1 UAE Smart Mining Market Breakdown by Component
9.4.5.3.2 UAE Smart Mining Market Breakdown by Mining Type
9.4.5.4 Rest of Middle East & Africa Smart Mining Market Revenue and Forecasts to 2030 (US$ Million)
9.4.5.4.1 Rest of Middle East & Africa Smart Mining Market Breakdown by Component
9.4.5.4.2 Rest of Middle East & Africa Smart Mining Market Breakdown by Mining Type
9.5 South & Central America
9.5.1 South & Central America Smart Mining Market Overview
9.5.2 South & Central America Smart Mining Market Revenue and Forecasts to 2030 (US$ Million)
9.5.3 South & Central America Smart Mining Market Breakdown by Component
9.5.3.1 South & Central America Smart Mining Market and Forecasts and Analysis - By Component
9.5.4 South & Central America Smart Mining Market Breakdown by Mining Type
9.5.4.1 South & Central America Smart Mining Market Revenue and Forecasts and Analysis - By Mining Type
9.5.5 South & Central America Smart Mining Market Revenue and Forecasts and Analysis - By Countries
9.5.5.1 Brazil Smart Mining Market Revenue and Forecasts to 2030 (US$ Million)
9.5.5.1.1 Brazil Smart Mining Market Breakdown by Component
9.5.5.1.2 Brazil Smart Mining Market Breakdown by Mining Type
9.5.5.2 Argentina Smart Mining Market Revenue and Forecasts to 2030 (US$ Million)
9.5.5.2.1 Argentina Smart Mining Market Breakdown by Component
9.5.5.2.2 Argentina Smart Mining Market Breakdown by Mining Type
9.5.5.3 Rest of South & Central America Smart Mining Market Revenue and Forecasts to 2030 (US$ Million)
9.5.5.3.1 Rest of South & Central America Smart Mining Market Breakdown by Component
9.5.5.3.2 Rest of South & Central America Smart Mining Market Breakdown by Mining Type
10. Smart Mining Market – Impact of COVID-19 Pandemic
10.1 Pre & Post Covid-19 Impact
11. Competitive Landscape
11.1 Heat Map Analysis By Key Players
11.2 Company Positioning & Concentration
12. Smart Mining Market Industry Landscape
12.1 Overview
12.2 Market Initiative
12.3 New Product Development
12.4 Merger and Acquisition
13. Company Profiles
13.1 ABB Ltd
13.1.1 Key Facts
13.1.2 Business Description
13.1.3 Products and Services
13.1.4 Financial Overview
13.1.5 SWOT Analysis
13.1.6 Key Developments
13.2 Alastri
13.2.1 Key Facts
13.2.2 Business Description
13.2.3 Products and Services
13.2.4 Financial Overview
13.2.5 SWOT Analysis
13.2.6 Key Developments
13.3 Caterpillar Inc
13.3.1 Key Facts
13.3.2 Business Description
13.3.3 Products and Services
13.3.4 Financial Overview
13.3.5 SWOT Analysis
13.3.6 Key Developments
13.4 Intellisense.io
13.4.1 Key Facts
13.4.2 Business Description
13.4.3 Products and Services
13.4.4 Financial Overview
13.4.5 SWOT Analysis
13.4.6 Key Developments
13.5 Hexagon AB
13.5.1 Key Facts
13.5.2 Business Description
13.5.3 Products and Services
13.5.4 Financial Overview
13.5.5 SWOT Analysis
13.5.6 Key Developments
13.6 Hitachi Ltd
13.6.1 Key Facts
13.6.2 Business Description
13.6.3 Products and Services
13.6.4 Financial Overview
13.6.5 SWOT Analysis
13.6.6 Key Developments
13.7 MineSense
13.7.1 Key Facts
13.7.2 Business Description
13.7.3 Products and Services
13.7.4 Financial Overview
13.7.5 SWOT Analysis
13.7.6 Key Developments
13.8 Rockwell Automation Inc
13.8.1 Key Facts
13.8.2 Business Description
13.8.3 Products and Services
13.8.4 Financial Overview
13.8.5 SWOT Analysis
13.8.6 Key Developments
13.9 SAP SE
13.9.1 Key Facts
13.9.2 Business Description
13.9.3 Products and Services
13.9.4 Financial Overview
13.9.5 SWOT Analysis
13.9.6 Key Developments
13.10 Trimble Inc
13.10.1 Key Facts
13.10.2 Business Description
13.10.3 Products and Services
13.10.4 Financial Overview
13.10.5 SWOT Analysis
13.10.6 Key Developments
14. Appendix
14.1 About The Insight Partners
14.2 Word Index
List of Tables
Table 1. Smart Mining Market Segmentation
Table 2. Smart Mining Market Revenue and Forecasts To 2030 (US$ Million) – By Region
Table 3. Smart Mining Market Revenue and Forecasts To 2030 (US$ Million) – Component
Table 4. Smart Mining Market Revenue and Forecasts To 2030 (US$ Million) – Automated Equipment
Table 5. Smart Mining Market Revenue and Forecasts To 2030 (US$ Million) –Hardware Component
Table 6. Smart Mining Market Revenue and Forecasts To 2030 (US$ Million) –Software Solution
Table 7. Smart Mining Market Revenue and Forecasts To 2030 (US$ Million) – Mining Type
Table 8. North America Smart Mining Market Revenue and Forecasts To 2030 (US$ Mn) – By Component
Table 9. North America Smart Mining Market Revenue and Forecasts To 2030 (US$ Mn) – By Automated Equipment
Table 10. North America Smart Mining Market Revenue and Forecasts To 2030 (US$ Mn) – By Hardware Component
Table 11. North America Smart Mining Market Revenue and Forecasts To 2030 (US$ Mn) – By Software Solution
Table 12. North America Smart Mining Market Revenue and Forecasts To 2030 (US$ Mn) – By Mining Type
Table 13. North America Smart Mining Market, by Country – Revenue and Forecast to 2030 (USD Million)
Table 14. US Smart Mining Market Revenue and Forecasts To 2030 (US$ Mn) – By Component
Table 15. US Smart Mining Market Revenue and Forecasts To 2030 (US$ Mn) – By Automated Equipment
Table 16. US Smart Mining Market Revenue and Forecasts To 2030 (US$ Mn) – By Hardware Component
Table 17. US Smart Mining Market Revenue and Forecasts To 2030 (US$ Mn) – By Software Solution
Table 18. US Smart Mining Market Revenue and Forecasts To 2030 (US$ Mn) – By Mining Type
Table 19. Canada Smart Mining Market Revenue and Forecasts To 2030 (US$ Mn) – By Component
Table 20. Canada Smart Mining Market Revenue and Forecasts To 2030 (US$ Mn) – By Automated Equipment
Table 21. Canada Smart Mining Market Revenue and Forecasts To 2030 (US$ Mn) – By Hardware Component
Table 22. North America Smart Mining Market Revenue and Forecasts To 2030 (US$ Mn) – By Software Solution
Table 23. Canada Smart Mining Market Revenue and Forecasts To 2030 (US$ Mn) – By Mining Type
Table 24. Mexico Smart Mining Market Revenue and Forecasts To 2030 (US$ Mn) – By Component
Table 25. Mexico Smart Mining Market Revenue and Forecasts To 2030 (US$ Mn) – By Automated Equipment
Table 26. Mexico Smart Mining Market Revenue and Forecasts To 2030 (US$ Mn) – By Hardware Component
Table 27. Mexico Smart Mining Market Revenue and Forecasts To 2030 (US$ Mn) – By Software Solution
Table 28. Mexico Smart Mining Market Revenue and Forecasts To 2030 (US$ Mn) – By Mining Type
Table 29. Europe Smart Mining Market Revenue and Forecasts To 2030 (US$ Mn) – By Component
Table 30. Europe Smart Mining Market Revenue and Forecasts To 2030 (US$ Mn) – By Automated Equipment
Table 31. Europe Smart Mining Market Revenue and Forecasts To 2030 (US$ Mn) – By Hardware Component
Table 32. Europe Smart Mining Market Revenue and Forecasts To 2030 (US$ Mn) – By Software Solution
Table 33. Europe Smart Mining Market Revenue and Forecasts To 2030 (US$ Mn) – By Mining Type
Table 34. Europe Smart Mining Market, by Country – Revenue and Forecast to 2030 (USD Million)
Table 35. Germany Smart Mining Market Revenue and Forecasts To 2030 (US$ Mn) – By Component
Table 36. Germany Smart Mining Market Revenue and Forecasts To 2030 (US$ Mn) – By Automated Equipment
Table 37. Germany Smart Mining Market Revenue and Forecasts To 2030 (US$ Mn) – By Hardware Component
Table 38. Germany Smart Mining Market Revenue and Forecasts To 2030 (US$ Mn) – By Software Solution
Table 39. Germany Smart Mining Market Revenue and Forecasts To 2030 (US$ Mn) – By Mining Type
Table 40. France Smart Mining Market Revenue and Forecasts To 2030 (US$ Mn) – By Component
Table 41. France Smart Mining Market Revenue and Forecasts To 2030 (US$ Mn) – By Automated Equipment
Table 42. France Smart Mining Market Revenue and Forecasts To 2030 (US$ Mn) – By Hardware Component
Table 43. France Smart Mining Market Revenue and Forecasts To 2030 (US$ Mn) – By Software Solution
Table 44. France Smart Mining Market Revenue and Forecasts To 2030 (US$ Mn) – By Mining Type
Table 45. Italy Smart Mining Market Revenue and Forecasts To 2030 (US$ Mn) – By Component
Table 46. Italy Smart Mining Market Revenue and Forecasts To 2030 (US$ Mn) – By Automated Equipment
Table 47. Italy Smart Mining Market Revenue and Forecasts To 2030 (US$ Mn) – By Hardware Component
Table 48. Italy Smart Mining Market Revenue and Forecasts To 2030 (US$ Mn) – By Software Solution
Table 49. Italy Smart Mining Market Revenue and Forecasts To 2030 (US$ Mn) – By Mining Type
Table 50. UK Smart Mining Market Revenue and Forecasts To 2030 (US$ Mn) – By Component
Table 51. UK Smart Mining Market Revenue and Forecasts To 2030 (US$ Mn) – By Automated Equipment
Table 52. UK Smart Mining Market Revenue and Forecasts To 2030 (US$ Mn) – By Hardware Component
Table 53. UK Smart Mining Market Revenue and Forecasts To 2030 (US$ Mn) – By Software Solution
Table 54. UK Smart Mining Market Revenue and Forecasts To 2030 (US$ Mn) – By Mining Type
Table 55. Russia Smart Mining Market Revenue and Forecasts To 2030 (US$ Mn) – By Component
Table 56. Russia Smart Mining Market Revenue and Forecasts To 2030 (US$ Mn) – By Automated Equipment
Table 57. Russia Smart Mining Market Revenue and Forecasts To 2030 (US$ Mn) – By Hardware Component
Table 58. Russia Smart Mining Market Revenue and Forecasts To 2030 (US$ Mn) – By Software Solution
Table 59. Russia Smart Mining Market Revenue and Forecasts To 2030 (US$ Mn) – By Mining Type
Table 60. Rest of Europe Smart Mining Market Revenue and Forecasts To 2030 (US$ Mn) – By Component
Table 61. Rest of Europe Smart Mining Market Revenue and Forecasts To 2030 (US$ Mn) – By Automated Equipment
Table 62. Rest of Europe Smart Mining Market Revenue and Forecasts To 2030 (US$ Mn) – By Hardware Component
Table 63. Rest of Europe Smart Mining Market Revenue and Forecasts To 2030 (US$ Mn) – By Software Solution
Table 64. Rest of Europe Smart Mining Market Revenue and Forecasts To 2030 (US$ Mn) – By Mining Type
Table 65. Asia Pacific Smart Mining Market Revenue And Forecasts To 2030 (US$ Million) – Component
Table 66. Asia Pacific Smart Mining Market Revenue and Forecasts To 2030 (US$ Mn) – By Automated Equipment
Table 67. Asia Pacific Smart Mining Market Revenue and Forecasts To 2030 (US$ Mn) – By Hardware Component
Table 68. Asia Pacific Smart Mining Market Revenue and Forecasts To 2030 (US$ Mn) – By Software Solution
Table 69. Asia Pacific Smart Mining Market Revenue And Forecasts To 2030 (US$ Million) – Mining Type
Table 70. Asia Pacific Smart Mining Market, by Country – Revenue and Forecast to 2030 (USD Million)
Table 71. Australia Smart Mining Market Revenue And Forecasts To 2030 (US$ Million) – Component
Table 72. Australia Smart Mining Market Revenue and Forecasts To 2030 (US$ Mn) – By Automated Equipment
Table 73. Australia Smart Mining Market Revenue and Forecasts To 2030 (US$ Mn) – By Hardware Component
Table 74. Australia Smart Mining Market Revenue and Forecasts To 2030 (US$ Mn) – By Software Solution
Table 75. Australia Smart Mining Market Revenue And Forecasts To 2030 (US$ Million) – Mining Type
Table 76. China Smart Mining Market Revenue And Forecasts To 2030 (US$ Million) – Component
Table 77. China Smart Mining Market Revenue and Forecasts To 2030 (US$ Mn) – By Automated Equipment
Table 78. China Smart Mining Market Revenue and Forecasts To 2030 (US$ Mn) – By Hardware Component
Table 79. China Smart Mining Market Revenue and Forecasts To 2030 (US$ Mn) – By Software Solution
Table 80. China Smart Mining Market Revenue And Forecasts To 2030 (US$ Million) – Mining Type
Table 81. India Smart Mining Market Revenue And Forecasts To 2030 (US$ Million) – Component
Table 82. India Smart Mining Market Revenue and Forecasts To 2030 (US$ Mn) – By Automated Equipment
Table 83. India Smart Mining Market Revenue and Forecasts To 2030 (US$ Mn) – By Hardware Component
Table 84. India Smart Mining Market Revenue and Forecasts To 2030 (US$ Mn) – By Software Solution
Table 85. India Smart Mining Market Revenue And Forecasts To 2030 (US$ Million) – Mining Type
Table 86. Japan Smart Mining Market Revenue And Forecasts To 2030 (US$ Million) – Component
Table 87. Japan Smart Mining Market Revenue and Forecasts To 2030 (US$ Mn) – By Automated Equipment
Table 88. Japan Smart Mining Market Revenue and Forecasts To 2030 (US$ Mn) – By Hardware Component
Table 89. Japan Smart Mining Market Revenue and Forecasts To 2030 (US$ Mn) – By Software Solution
Table 90. Japan Smart Mining Market Revenue And Forecasts To 2030 (US$ Million) – Mining Type
Table 91. South Korea Smart Mining Market Revenue And Forecasts To 2030 (US$ Million) – Component
Table 92. South Korea Smart Mining Market Revenue and Forecasts To 2030 (US$ Mn) – By Automated Equipment
Table 93. South Korea Smart Mining Market Revenue and Forecasts To 2030 (US$ Mn) – By Hardware Component
Table 94. South Korea Smart Mining Market Revenue and Forecasts To 2030 (US$ Mn) – By Software Solution
Table 95. South Korea Smart Mining Market Revenue And Forecasts To 2030 (US$ Million) – Mining Type
Table 96. Rest of Asia Pacific Smart Mining Market Revenue And Forecasts To 2030 (US$ Million) – Component
Table 97. Rest of Asia Pacific Smart Mining Market Revenue and Forecasts To 2030 (US$ Mn) – By Automated Equipment
Table 98. Rest of Asia Pacific Smart Mining Market Revenue and Forecasts To 2030 (US$ Mn) – By Hardware Component
Table 99. South Korea Smart Mining Market Revenue and Forecasts To 2030 (US$ Mn) – By Software Solution
Table 100. Rest of Asia Pacific Smart Mining Market Revenue And Forecasts To 2030 (US$ Million) – Mining Type
Table 101. Middle East & Africa Smart Mining Market Revenue and Forecasts To 2030 (US$ Million) – By Component
Table 102. Middle East & Africa Smart Mining Market Revenue and Forecasts To 2030 (US$ Mn) – By Automated Equipment
Table 103. Middle East & Africa Smart Mining Market Revenue and Forecasts To 2030 (US$ Mn) – By Hardware Component
Table 104. Middle East & Africa Smart Mining Market Revenue and Forecasts To 2030 (US$ Mn) – By Software Solution
Table 105. Middle East & Africa Smart Mining Market Revenue and Forecasts To 2030 (US$ Million) – By Mining Type
Table 106. Middle East and Africa Smart Mining Market, by Country – Revenue and Forecast to 2030 (USD Million)
Table 107. South Africa Smart Mining Market Revenue and Forecasts To 2030 (US$ Million) – By Component
Table 108. South Africa Smart Mining Market Revenue and Forecasts To 2030 (US$ Mn) – By Automated Equipment
Table 109. South Africa Smart Mining Market Revenue and Forecasts To 2030 (US$ Mn) – By Hardware Component
Table 110. South Africa Smart Mining Market Revenue and Forecasts To 2030 (US$ Mn) – By Software Solution
Table 111. South Africa Smart Mining Market Revenue and Forecasts To 2030 (US$ Million) – By Mining Type
Table 112. Saudi Arabia Smart Mining Market Revenue and Forecasts To 2030 (US$ Million) – By Component
Table 113. Saudi Arabia Smart Mining Market Revenue and Forecasts To 2030 (US$ Mn) – By Automated Equipment
Table 114. Saudi Arabia Smart Mining Market Revenue and Forecasts To 2030 (US$ Mn) – By Hardware Component
Table 115. Saudi Arabia Smart Mining Market Revenue and Forecasts To 2030 (US$ Mn) – By Software Solution
Table 116. Saudi Arabia Smart Mining Market Revenue and Forecasts To 2030 (US$ Million) – By Mining Type
Table 117. UAE Smart Mining Market Revenue and Forecasts To 2030 (US$ Million) – By Component
Table 118. UAE Smart Mining Market Revenue and Forecasts To 2030 (US$ Mn) – By Automated Equipment
Table 119. UAE Smart Mining Market Revenue and Forecasts To 2030 (US$ Mn) – By Hardware Component
Table 120. UAE Smart Mining Market Revenue and Forecasts To 2030 (US$ Mn) – By Software Solution
Table 121. UAE Smart Mining Market Revenue and Forecasts To 2030 (US$ Million) – By Mining Type
Table 122. Rest of Middle East & Africa Smart Mining Market Revenue and Forecasts To 2030 (US$ Million) – By Component
Table 123. Rest of Middle East & Africa Smart Mining Market Revenue and Forecasts To 2030 (US$ Mn) – By Automated Equipment
Table 124. Rest of Middle East & Africa Smart Mining Market Revenue and Forecasts To 2030 (US$ Mn) – By Hardware Component
Table 125. Rest of Middle East & Africa Smart Mining Market Revenue and Forecasts To 2030 (US$ Mn) – By Software Solution
Table 126. Rest of Middle East & Africa Smart Mining Market Revenue and Forecasts To 2030 (US$ Million) – By Mining Type
Table 127. South & Central America Smart Mining Market Revenue and Forecasts To 2030 (US$ Million) – By Component
Table 128. South & Central America Smart Mining Market Revenue and Forecasts To 2030 (US$ Mn) – By Automated Equipment
Table 129. South & Central America Smart Mining Market Revenue and Forecasts To 2030 (US$ Mn) – By Hardware Component
Table 130. South & Central America Smart Mining Market Revenue and Forecasts To 2030 (US$ Mn) – By Software Solution
Table 131. South & Central America Smart Mining Market Revenue and Forecasts To 2030 (US$ Million) – By Mining Type
Table 132. South and Central America Smart Mining Market, by Country – Revenue and Forecast to 2030 (USD Million)
Table 133. Brazil Smart Mining Market Revenue and Forecasts To 2030 (US$ Million) – By Component
Table 134. Brazil Smart Mining Market Revenue and Forecasts To 2030 (US$ Mn) – By Automated Equipment
Table 135. Brazil Smart Mining Market Revenue and Forecasts To 2030 (US$ Mn) – By Hardware Component
Table 136. Brazil Smart Mining Market Revenue and Forecasts To 2030 (US$ Mn) – By Software Solution
Table 137. Brazil Smart Mining Market Revenue and Forecasts To 2030 (US$ Million) – By Mining Type
Table 138. Argentina Smart Mining Market Revenue and Forecasts To 2030 (US$ Million) – By Component
Table 139. Argentina Smart Mining Market Revenue and Forecasts To 2030 (US$ Mn) – By Automated Equipment
Table 140. Argentina Smart Mining Market Revenue and Forecasts To 2030 (US$ Mn) – By Hardware Component
Table 141. Argentina Smart Mining Market Revenue and Forecasts To 2030 (US$ Mn) – By Software Solution
Table 142. Argentina Smart Mining Market Revenue and Forecasts To 2030 (US$ Million) – By Mining Type
Table 143. Rest of South & Central America Smart Mining Market Revenue and Forecasts To 2030 (US$ Million) – By Component
Table 144. Rest of South & Central America Smart Mining Market Revenue and Forecasts To 2030 (US$ Mn) – By Automated Equipment
Table 145. Rest of South & Central America Smart Mining Market Revenue and Forecasts To 2030 (US$ Mn) – By Hardware Component
Table 146. Rest of South & Central America Smart Mining Market Revenue and Forecasts To 2030 (US$ Mn) – By Software Solution
Table 147. Rest of South & Central America Smart Mining Market Revenue and Forecasts To 2030 (US$ Million) – By Mining Type
Table 148. Company Positioning & Concentration
Table 149. List of Abbreviation
List of Figures
Figure 1. Smart Mining Market Segmentation, By Geography
Figure 2. Global– PEST Analysis
Figure 3. Ecosystem: Smart Mining Market
Figure 4. Smart Mining Market - Key Industry Dynamics
Figure 5. Impact Analysis of Drivers And Restraints
Figure 6. Smart Mining Market Revenue (US$ Million), 2022 – 2030
Figure 7. Smart Mining Market Share (%) – Region, 2022 and 2030
Figure 8. Smart Mining Market Share (%) – Component, 2022 and 2030
Figure 9. Smart Mining Market Share (%) – Mining Type, 2022 and 2030
Figure 10. Smart Mining Market Breakdown by Geography, 2022 and 2030 (US$ Mn)
Figure 11. Smart Mining Market Revenue and Forecasts To 2030 (US$ Mn)
Figure 12. Smart Mining Market Breakdown by Component (2022 and 2030)
Figure 13. Smart Mining market Breakdown by Mining Type, 2022 and 2030 (%)
Figure 14. Smart Mining market Breakdown by Key Countries, 2022 and 2030 (%)
Figure 15. US Smart Mining Market Revenue and Forecasts To 2030 (US$ Mn)
Figure 16. Canada Smart Mining Market Revenue and Forecasts To 2030 (US$ Mn)
Figure 17. Mexico Smart Mining Market Revenue and Forecasts To 2030 (US$ Mn)
Figure 18. Smart Mining Market Revenue and Forecasts To 2030 (US$ Mn)
Figure 19. Smart Mining Market Breakdown by Component (2022 and 2030)
Figure 20. Smart Mining Market Breakdown by Mining Type (2022 and 2030)
Figure 21. Smart Mining market Breakdown by Key Countries, 2022 and 2030 (%)
Figure 22. Germany Smart Mining Market Revenue and Forecasts To 2030 (US$ Mn)
Figure 23. France Smart Mining Market Revenue and Forecasts To 2030 (US$ Mn)
Figure 24. Italy Smart Mining Market Revenue and Forecasts To 2030 (US$ Mn)
Figure 25. UK Smart Mining Market Revenue and Forecasts To 2030 (US$ Mn)
Figure 26. Russia Smart Mining Market Revenue and Forecasts To 2030 (US$ Mn)
Figure 27. Rest of Europe Smart Mining Market Revenue and Forecasts To 2030 (US$ Mn)
Figure 28. Asia Pacific Smart Mining Market Revenue And Forecasts To 2030 (US$ Million)
Figure 29. Asia Pacific Smart Mining Market Breakdown by Component (2022 and 2023)
Figure 30. Asia Pacific Smart Mining Market Breakdown by Mining Type (2022 and 2023)
Figure 31. Asia Pacific Smart Mining Market Breakdown By Key Countries, 2022 And 2030 (%)
Figure 32. Australia Smart Mining Market Revenue And Forecasts To 2030 (US$ Million)
Figure 33. China Smart Mining Market Revenue And Forecasts To 2030 (US$ Million)
Figure 34. India Smart Mining Market Revenue And Forecasts To 2030 (US$ Million)
Figure 35. Japan Smart Mining Market Revenue And Forecasts To 2030 (US$ Million)
Figure 36. South Korea Smart Mining Market Revenue And Forecasts To 2030 (US$ Million)
Figure 37. Rest of Asia Pacific Smart Mining Market Revenue And Forecasts To 2030 (US$ Million)
Figure 38. Smart Mining Market Revenue and Forecasts To 2030 (US$ Million)
Figure 39. Middle East & Africa Smart Mining Market Breakdown by Component (2022 and 2023)
Figure 40. Middle East & Africa Smart Mining Market Breakdown by Mining Type (2022 and 2023)
Figure 41. Smart Mining Market Breakdown by Key Countries, 2022 and 2030 (%)
Figure 42. South Africa Smart Mining Market Revenue and Forecasts To 2030 (US$ Million)
Figure 43. Saudi Arabia Smart Mining Market Revenue and Forecasts To 2030 (US$ Million)
Figure 44. UAE Smart Mining Market Revenue and Forecasts To 2030 (US$ Million)
Figure 45. Rest of Middle East & Africa Smart Mining Market Revenue and Forecasts To 2030 (US$ Million)
Figure 46. Smart Mining Market Revenue and Forecasts To 2030 (US$ Million)
Figure 47. South & Central America Smart Mining Market Breakdown by Component (2022 and 2023)
Figure 48. South & Central America Smart Mining Market Breakdown by Mining Type (2022 and 2023)
Figure 49. Smart Mining Market Breakdown by Key Countries, 2022 and 2030 (%)
Figure 50. Brazil Smart Mining Market Revenue and Forecasts To 2030 (US$ Million)
Figure 51. Argentina Smart Mining Market Revenue and Forecasts To 2030 (US$ Million)
Figure 52. Rest of South & Central America Smart Mining Market Revenue and Forecasts To 2030 (US$ Million)
Figure 53. Heat Map Analysis By Key Players
The List of Companies - Smart Mining Market
- ABB Ltd
- Alastri
- Caterpillar Inc
- Intellisense.io
- Hexagon AB
- Hitachi Ltd
- MineSense
- Rockwell Automation Inc
- SAP SE
- Trimble Inc
The Insight Partners performs research in 4 major stages: Data Collection & Secondary Research, Primary Research, Data Analysis and Data Triangulation & Final Review.
- Data Collection and Secondary Research:
As a market research and consulting firm operating from a decade, we have published many reports and advised several clients across the globe. First step for any study will start with an assessment of currently available data and insights from existing reports. Further, historical and current market information is collected from Investor Presentations, Annual Reports, SEC Filings, etc., and other information related to company’s performance and market positioning are gathered from Paid Databases (Factiva, Hoovers, and Reuters) and various other publications available in public domain.
Several associations trade associates, technical forums, institutes, societies and organizations are accessed to gain technical as well as market related insights through their publications such as research papers, blogs and press releases related to the studies are referred to get cues about the market. Further, white papers, journals, magazines, and other news articles published in the last 3 years are scrutinized and analyzed to understand the current market trends.
- Primary Research:
The primarily interview analysis comprise of data obtained from industry participants interview and answers to survey questions gathered by in-house primary team.
For primary research, interviews are conducted with industry experts/CEOs/Marketing Managers/Sales Managers/VPs/Subject Matter Experts from both demand and supply side to get a 360-degree view of the market. The primary team conducts several interviews based on the complexity of the markets to understand the various market trends and dynamics which makes research more credible and precise.
A typical research interview fulfils the following functions:
- Provides first-hand information on the market size, market trends, growth trends, competitive landscape, and outlook
- Validates and strengthens in-house secondary research findings
- Develops the analysis team’s expertise and market understanding
Primary research involves email interactions and telephone interviews for each market, category, segment, and sub-segment across geographies. The participants who typically take part in such a process include, but are not limited to:
- Industry participants: VPs, business development managers, market intelligence managers and national sales managers
- Outside experts: Valuation experts, research analysts and key opinion leaders specializing in the electronics and semiconductor industry.
Below is the breakup of our primary respondents by company, designation, and region:

Once we receive the confirmation from primary research sources or primary respondents, we finalize the base year market estimation and forecast the data as per the macroeconomic and microeconomic factors assessed during data collection.
- Data Analysis:
Once data is validated through both secondary as well as primary respondents, we finalize the market estimations by hypothesis formulation and factor analysis at regional and country level.
- 3.1 Macro-Economic Factor Analysis:
We analyse macroeconomic indicators such the gross domestic product (GDP), increase in the demand for goods and services across industries, technological advancement, regional economic growth, governmental policies, the influence of COVID-19, PEST analysis, and other aspects. This analysis aids in setting benchmarks for various nations/regions and approximating market splits. Additionally, the general trend of the aforementioned components aid in determining the market's development possibilities.
- 3.2 Country Level Data:
Various factors that are especially aligned to the country are taken into account to determine the market size for a certain area and country, including the presence of vendors, such as headquarters and offices, the country's GDP, demand patterns, and industry growth. To comprehend the market dynamics for the nation, a number of growth variables, inhibitors, application areas, and current market trends are researched. The aforementioned elements aid in determining the country's overall market's growth potential.
- 3.3 Company Profile:
The “Table of Contents” is formulated by listing and analyzing more than 25 - 30 companies operating in the market ecosystem across geographies. However, we profile only 10 companies as a standard practice in our syndicate reports. These 10 companies comprise leading, emerging, and regional players. Nonetheless, our analysis is not restricted to the 10 listed companies, we also analyze other companies present in the market to develop a holistic view and understand the prevailing trends. The “Company Profiles” section in the report covers key facts, business description, products & services, financial information, SWOT analysis, and key developments. The financial information presented is extracted from the annual reports and official documents of the publicly listed companies. Upon collecting the information for the sections of respective companies, we verify them via various primary sources and then compile the data in respective company profiles. The company level information helps us in deriving the base number as well as in forecasting the market size.
- 3.4 Developing Base Number:
Aggregation of sales statistics (2020-2022) and macro-economic factor, and other secondary and primary research insights are utilized to arrive at base number and related market shares for 2022. The data gaps are identified in this step and relevant market data is analyzed, collected from paid primary interviews or databases. On finalizing the base year market size, forecasts are developed on the basis of macro-economic, industry and market growth factors and company level analysis.
- Data Triangulation and Final Review:
The market findings and base year market size calculations are validated from supply as well as demand side. Demand side validations are based on macro-economic factor analysis and benchmarks for respective regions and countries. In case of supply side validations, revenues of major companies are estimated (in case not available) based on industry benchmark, approximate number of employees, product portfolio, and primary interviews revenues are gathered. Further revenue from target product/service segment is assessed to avoid overshooting of market statistics. In case of heavy deviations between supply and demand side values, all thes steps are repeated to achieve synchronization.
We follow an iterative model, wherein we share our research findings with Subject Matter Experts (SME’s) and Key Opinion Leaders (KOLs) until consensus view of the market is not formulated – this model negates any drastic deviation in the opinions of experts. Only validated and universally acceptable research findings are quoted in our reports.
We have important check points that we use to validate our research findings – which we call – data triangulation, where we validate the information, we generate from secondary sources with primary interviews and then we re-validate with our internal data bases and Subject matter experts. This comprehensive model enables us to deliver high quality, reliable data in shortest possible time.
 Get Free Sample For