The smart water metering market size is projected to reach US$ 7.36 billion by 2031 from US$ 3.80 billion in 2023. The market is expected to register a CAGR of 9.9% during 2023–2031. Increase in demand for smart water meters with the rise in smart city Initiatives is likely to remain a key trend in the market during the forecast period.
Smart Water Metering Market Analysis
Several government initiatives are helping the smart water metering market to flourish in the current scenario. For instance, several parts of North America have successfully implemented smart water meters with the help of government funding. Also, many city authorities across the region have been launching several projects for new installation or modernization of the existing smart water meter infrastructure. In November 2021, the city of Wilmer in Texas announced the launch of a smart water meter modernization project worth US$ 880,780 to modernize the city's water service infrastructure. The main aim of this project is to allow residential customers to access water usage data in real time and improve operational efficiencies. This also helps in more precise water meter readings along with accurate billings for the water transmission service providers and end users.
Smart Water Metering Market Overview
Water providers and water utilities constantly adopt various technologies to provide an adequate amount of water to every area. It also assists in reducing operational costs, managing assets, and promoting conservation. Among the end users, the residential sector in developed countries and developing economies is adopting technologically advanced water meters to monitor and check the water consumption pattern. The smart water meters also facilitate the residential areas by preventing pipeline leakage, tampering efforts, and reverse flow, which reduces water loss and associated losses. The industrial sector is upgrading their water systems with smart water meters as these meters help understand the quantity of water allotted to them, the quantity of water supplied at the end, and the quantity of water billed at the end of the period. A smart water meter can detect inefficiencies and patterns in water consumption. These meters contain IoT sensors that track each consumer's water usage on a regular basis. The data generated by the sensor’s suite may be further monitored, allowing utilities and customers to better understand their consumption habits and identify areas where they are using excessive water. This decreases instances of excessive water consumption and waste. To reduce nonrevenue water bill generation, industries are increasingly acquiring smart water meters, enabling the market to expand.
Customize Research To Suit Your Requirement
We can optimize and tailor the analysis and scope which is unmet through our standard offerings. This flexibility will help you gain the exact information needed for your business planning and decision making.
Smart Water Metering Market: Strategic Insights
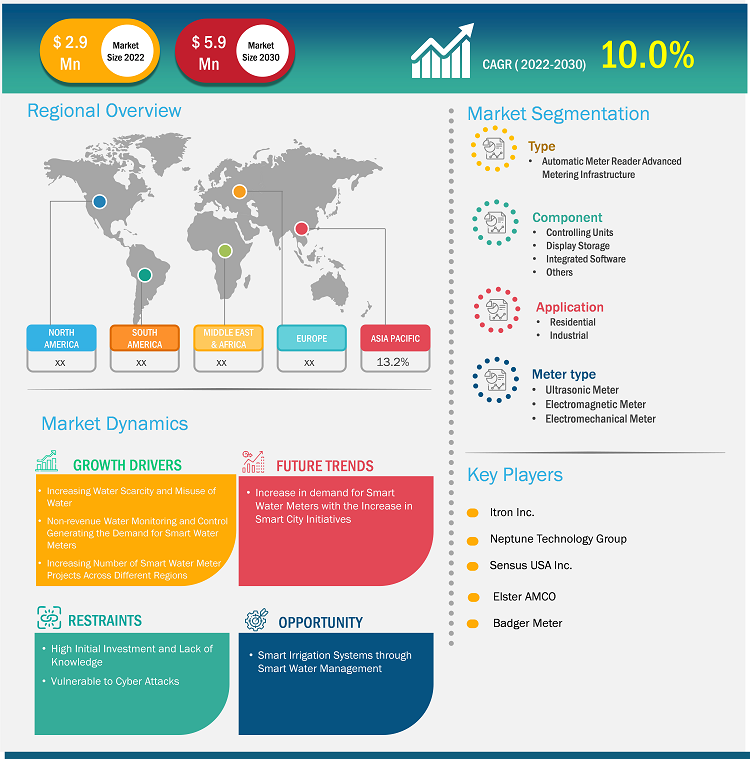
Market Size Value in US$ 3,359.84 million in 2022 Market Size Value by US$ 5,954.65 million by 2028 Growth rate CAGR of 10.0% from 2022 to 2028 Forecast Period 2022-2028 Base Year 2022

Naveen
Have a question?
Naveen will walk you through a 15-minute call to present the report’s content and answer all queries if you have any.
 Speak to Analyst
Customize Research To Suit Your Requirement
We can optimize and tailor the analysis and scope which is unmet through our standard offerings. This flexibility will help you gain the exact information needed for your business planning and decision making.
Smart Water Metering Market: Strategic Insights
| Market Size Value in | US$ 3,359.84 million in 2022 |
| Market Size Value by | US$ 5,954.65 million by 2028 |
| Growth rate | CAGR of 10.0% from 2022 to 2028 |
| Forecast Period | 2022-2028 |
| Base Year | 2022 |
Naveen
Have a question?
Naveen will walk you through a 15-minute call to present the report’s content and answer all queries if you have any.
Speak to Analyst
Smart Water Metering Market Drivers and Opportunities
Nonrevenue Water Monitoring and Control
Nonrevenue water is the discrepancy between the amount of water produced and the amount of water billed to customers. Water loss from source to destination occurs due to various reasons, including leaks (physical loss) and metering mistakes, manipulation, and theft (apparent losses). The NRW is increasing at an exponential rate, resulting in water scarcity and other concerns. On average, according to the research, water theft or illegal tapping is responsible for 8% of nonrevenue water in North America year on year. According to recent research by the International Water Association (IWA), global water waste is around 346 million cubic meters per day or 126 billion cubic meters per year in water distribution networks on their way to customers. Such losses are also known as NRW, and they amount to around US$39 billion per year as the average water cost in North America. The requirement to troubleshoot nonrevenue water has resulted in the need for the development of several technologies, such as smart water meters, which are generally approved by various governments. Smart water meter records hourly data on leaks or losses, as well as the time and date of occurrence. The system also enables the operator to review obtained data on-site or from any platform. Many smart water meters include alarms to reduce the likelihood of pipeline theft or manipulation. These warning systems help generate income from the end users' location. The increasing demand to monitor, control, and reduce nonrevenue water is driving companies in the industry to innovate and design robust technologies, which is driving the smart water metering market growth.
Smart Irrigation Systems Through Smart Water Management
Smart irrigation or smart agriculture is a flourishing sector in North America and Europe due to the fact that the regions have sufficient agricultural land. However, they lack human labor and time for the conventional form of agriculture. Smart agriculture or smart irrigation systems involve the usage of several sensors, data loggers, and communication systems along with data platforms with which the operator can easily review the procedures. Pertaining to the trends mentioned above in the agriculture industry among North American and European countries and the upsurge in prices of individual sensors, data loggers, and other components, farmers or farming organizations implement smart water meters on the grounds. Smart metering technology can be integrated into irrigation systems to monitor and manage water consumption for landscape and agriculture. Smart irrigation controllers and sensors can help users optimize their water usage and avoid water waste. This can result in significant water conservation in regions where irrigation is a major water consumer. In addition, smart water meters benefit farmers or farming organizations by coupling all the individual components into one unit, which, in turn, reduces the upfront costs of the company. The meters facilitate farmer's or farming organizations' enhanced energy management, water usage, water conservation, and ultimately saving costs. The advantages of smart water meters in irrigation or agriculture are sensing the amount of water needed and spraying the required amount. It reduces time, minimizes human labor, and enhances accuracy, thereby resulting in high-quality crop yield. The technological advancements in water conservation are highly benefiting the agriculture industry in countries such as the US, Canada, Mexico, Germany, France, the UK, Italy, Australia, and others. The high adoption of smart technologies in irrigation is expected to bolster the growth of the smart water metering market in the coming years.
Smart Water Metering Market Report Segmentation Analysis
Key segments that contributed to the derivation of the smart water metering market analysis are type, component, end user, and meter type.
- Based on type, the smart water metering market is bifurcated into AMR and AMI. The automatic meter reader segment held a larger market share in 2023.
- Based on component, the market is bifurcated into controlling units; display, storage, and integrated software; and others. The display, storage, and integrated software segment accounted for the largest market share in 2023.
- By end user, the smart water metering market is bifurcated into residential and industrial. The residential segment held a larger market share in 2023.
- By meter type, the market is segmented into ultrasonic meter, electromagnetic meter, and electromechanical meter. The ultrasonic meter segment held the largest smart water metering market share in 2023.
Smart Water Metering Market Share Analysis by Geography
The geographic scope of the smart water metering market report is mainly divided into five regions: North America, Asia Pacific, Europe, the Middle East & Africa, and South & Central America.
North America held a significant market share in 2023. North America comprises the US, Canada, and Mexico. The US is a developed country in terms of the adoption of modern technology, standard of living, infrastructure development, and others. Also, affordability concerns regarding the development of water infrastructures have reached a critical stage. The US Environmental Protection Agency (EPA) manages two State Revolving Fund programs — the Clean Water State Revolving Fund (CWSRF) and the Drinking Water State Revolving Fund (DWSRF). In addition, DWSRF is co-funded by the federal and state governments, with 80% and 20%, respectively.
The water industry's investors have focused on opportunistic upgrades—primarily to support smart meter installation and data collection and visualization rather than full network optimization. Governments of the region continue to take measures to reduce unyielding water usage and undergo modernization and replace older water meters with avant-garde smart water meters, which is becoming a major trend in North America.
Smart Water Metering Market Report Scope
Smart Water Metering Market News and Recent Developments
The smart water metering market is evaluated by gathering qualitative and quantitative data post primary and secondary research, which includes important corporate publications, association data, and databases. A few of the developments in the smart water metering market are listed below:
- The water utility across Mexico deployed Xylem's AMI solution in 2011. In addition,, in 2022, the utility deployed additional cloud-hosted Sensus analytics and residential water meters via the FlexNet communication network to collect water pressure data. (Source: Sensus USA Inc, Press Release, July 2022)
- Neptune Technology Group Inc. announced the launch of its MACH 10 ultrasonic water meters for commercial and industrial (C&I) applications in extension to its residential and intermediate MACH 10 meters operational across North America. (Source: Neptune Technology Group Inc., Press Release, June 2022)
Smart Water Metering Market Report Coverage and Deliverables
The "Smart Water Metering Market Size and Forecast (2021–2031)" report provides a detailed analysis of the market covering below areas:
- Smart water metering market size and forecast at global, regional, and country levels for all the key market segments covered under the scope
- Smart water metering market trends, as well as market dynamics such as drivers, restraints, and key opportunities
- Detailed PEST and SWOT analysis
- Smart water metering market analysis covering key market trends, global and regional framework, major players, regulations, and recent market developments
- Industry landscape and competition analysis covering market concentration, heat map analysis, prominent players, and recent developments for the smart water metering market
- Detailed company profiles

Report Coverage
Revenue forecast, Company Analysis, Industry landscape, Growth factors, and Trends

Segment Covered
Type, Component, Application, and Meter Type

Regional Scope
North America, Europe, Asia Pacific, Middle East & Africa, South & Central America

Country Scope
Argentina, Australia, Brazil, Canada, China, France, Germany, India, Italy, Japan, Mexico, Russia, Saudi Arabia, South Africa, South Korea, UAE, UK, US
Frequently Asked Questions
The smart water metering market was valued at US$ 3.80 billion in 2023 and is projected to reach US$ 7.36 billion by 2031; it is expected to grow at a CAGR of 9.9% during 2023–2031.
Increasing water scarcity, misuse of water and nonrevenue water monitoring and control and increasing number of smart water meter projects across different region are the driving factors impacting the smart water metering market.
Europe is anticipated to grow with the highest CAGR over the forecast period 2024-2031.
The key players, holding majority shares, in smart water metering market includes Badger Meter Inc, Sensus USA Inc., Itron Inc., Mueller Water Products Inc., and Kamstrup AS.
Increase in demand for smart water meters with rise in smart city initiatives is the future trends of the smart water metering market.
The Europe held the largest market share in 2023, followed by North America.
1. Introduction
1.1 The Insight Partners Research Report Guidance
1.2 Market Segmentation
2. Executive Summary
2.1 Key Insights
2.2 Market Attractiveness
3. Research Methodology
3.1 Secondary Research
3.2 Primary Research
3.2.1 Hypothesis formulation:
3.2.2 Macro-economic factor analysis:
3.2.3 Developing base number:
3.2.4 Data Triangulation:
3.2.5 Country level data:
4. Smart Water Metering Market Landscape
4.1 Overview
4.2 PEST Analysis
4.3 Ecosystem Analysis
4.3.1 List of Vendors in the Value Chain
5. Smart Water Metering Market – Key Market Dynamics
5.1 Smart Water Metering Market – Key Market Dynamics
5.2 Market Drivers
5.2.1 Increasing Water Scarcity and Misuse of Water
5.2.2 Nonrevenue Water Monitoring and Control
5.2.3 Increasing Number of Smart Water Meter Projects across Different Region
5.3 Market Restraints
5.3.1 High Initial Investment and Lack of Knowledge
5.3.2 Vulnerable to Cyber Attacks
5.4 Market Opportunities
5.4.1 Smart Irrigation Systems Through Smart Water Management
5.5 Future Trends
5.5.1 Increase in Demand for Smart Water Meters with Rise in Smart City Initiatives
5.6 Impact of Drivers and Restraints:
6. Smart Water Metering Market – Global Market Analysis
6.1 Smart Water Metering Market Revenue (US$ Million), 2021–2031
6.2 Smart Water Metering Market Forecast Analysis
7. Smart Water Metering Market Analysis – by Type
7.1 AMI
7.1.1 Overview
7.1.2 AMI: Smart Water Metering Market – Revenue and Forecast to 2031 (US$ Million)
7.2 AMR
7.2.1 Overview
7.2.2 AMR: Smart Water Metering Market – Revenue and Forecast to 2031 (US$ Million)
8. Smart Water Metering Market Analysis – by Component
8.1 Controlling Unit
8.1.1 Overview
8.1.2 Controlling Unit: Smart Water Metering Market – Revenue and Forecast to 2031 (US$ Million)
8.2 Display Storage and Integrated Software
8.2.1 Overview
8.2.2 Display Storage and Integrated Software: Smart Water Metering Market – Revenue and Forecast to 2031 (US$ Million)
8.3 Others
8.3.1 Overview
8.3.2 Others: Smart Water Metering Market – Revenue and Forecast to 2031 (US$ Million)
9. Smart Water Metering Market Analysis – by End User
9.1 Residential
9.1.1 Overview
9.1.2 Residential: Smart Water Metering Market – Revenue and Forecast to 2031 (US$ Million)
9.2 Industrial
9.2.1 Overview
9.2.2 Industrial: Smart Water Metering Market – Revenue and Forecast to 2031 (US$ Million)
10. Smart Water Metering Market Analysis – by Meter Type
10.1 Ultrasonic Meters
10.1.1 Overview
10.1.2 Ultrasonic Meters: Smart Water Metering Market – Revenue and Forecast to 2031 (US$ Million)
10.2 Electromagnetic Meters
10.2.1 Overview
10.2.2 Electromagnetic Meters: Smart Water Metering Market – Revenue and Forecast to 2031 (US$ Million)
10.3 Electromechanical Meter
10.3.1 Overview
10.3.2 Electromechanical Meter: Smart Water Metering Market – Revenue and Forecast to 2031 (US$ Million)
11. Smart Water Metering Market – Geographical Analysis
11.1 Overview
11.2 North America
11.2.1 North America Smart Water Metering Market Overview
11.2.2 North America: Smart Water Metering Market – Revenue and Forecast to 2031 (US$ Million)
11.2.3 North America: Smart Water Metering Market Breakdown, by Type
11.2.3.1 North America: Smart Water Metering Market – Revenue and Forecast Analysis – by Type
11.2.4 North America: Smart Water Metering Market Breakdown, by Component
11.2.4.1 North America: Smart Water Metering Market – Revenue and Forecast Analysis – by Component
11.2.5 North America: Smart Water Metering Market Breakdown, by End User
11.2.5.1 North America: Smart Water Metering Market – Revenue and Forecast Analysis – by End User
11.2.6 North America: Smart Water Metering Market Breakdown, by Meter Type
11.2.6.1 North America: Smart Water Metering Market – Revenue and Forecast Analysis – by Meter Type
11.2.7 North America: Smart Water Metering Market – Revenue and Forecast Analysis – by Country
11.2.7.1 North America: Smart Water Metering Market – Revenue and Forecast Analysis – by Country
11.2.7.2 United States: Smart Water Metering Market – Revenue and Forecast to 2031 (US$ Million)
11.2.7.2.1 United States: Smart Water Metering Market Breakdown, by Type
11.2.7.2.2 United States: Smart Water Metering Market Breakdown, by Component
11.2.7.2.3 United States: Smart Water Metering Market Breakdown, by End User
11.2.7.2.4 United States: Smart Water Metering Market Breakdown, by Meter Type
11.2.7.3 Canada: Smart Water Metering Market – Revenue and Forecast to 2031 (US$ Million)
11.2.7.3.1 Canada: Smart Water Metering Market Breakdown, by Type
11.2.7.3.2 Canada: Smart Water Metering Market Breakdown, by Component
11.2.7.3.3 Canada: Smart Water Metering Market Breakdown, by End User
11.2.7.3.4 Canada: Smart Water Metering Market Breakdown, by Meter Type
11.2.7.4 Mexico: Smart Water Metering Market – Revenue and Forecast to 2031 (US$ Million)
11.2.7.4.1 Mexico: Smart Water Metering Market Breakdown, by Type
11.2.7.4.2 Mexico: Smart Water Metering Market Breakdown, by Component
11.2.7.4.3 Mexico: Smart Water Metering Market Breakdown, by End User
11.2.7.4.4 Mexico: Smart Water Metering Market Breakdown, by Meter Type
11.3 Europe
11.3.1 Europe Smart Water Metering Market Overview
11.3.2 Europe: Smart Water Metering Market – Revenue and Forecast to 2031 (US$ Million)
11.3.3 Europe: Smart Water Metering Market Breakdown, by Type
11.3.3.1 Europe: Smart Water Metering Market – Revenue and Forecast Analysis – by Type
11.3.4 Europe: Smart Water Metering Market Breakdown, by Component
11.3.4.1 Europe: Smart Water Metering Market – Revenue and Forecast Analysis – by Component
11.3.5 Europe: Smart Water Metering Market Breakdown, by End User
11.3.5.1 Europe: Smart Water Metering Market – Revenue and Forecast Analysis – by End User
11.3.6 Europe: Smart Water Metering Market Breakdown, by Meter Type
11.3.6.1 Europe: Smart Water Metering Market – Revenue and Forecast Analysis – by Meter Type
11.3.7 Europe: Smart Water Metering Market – Revenue and Forecast Analysis – by Country
11.3.7.1 Europe: Smart Water Metering Market – Revenue and Forecast Analysis – by Country
11.3.7.2 Germany: Smart Water Metering Market – Revenue and Forecast to 2031 (US$ Million)
11.3.7.2.1 Germany: Smart Water Metering Market Breakdown, by Type
11.3.7.2.2 Germany: Smart Water Metering Market Breakdown, by Component
11.3.7.2.3 Germany: Smart Water Metering Market Breakdown, by End User
11.3.7.2.4 Germany: Smart Water Metering Market Breakdown, by Meter Type
11.3.7.3 France: Smart Water Metering Market – Revenue and Forecast to 2031 (US$ Million)
11.3.7.3.1 France: Smart Water Metering Market Breakdown, by Type
11.3.7.3.2 France: Smart Water Metering Market Breakdown, by Component
11.3.7.3.3 France: Smart Water Metering Market Breakdown, by End User
11.3.7.3.4 France: Smart Water Metering Market Breakdown, by Meter Type
11.3.7.4 Italy: Smart Water Metering Market – Revenue and Forecast to 2031 (US$ Million)
11.3.7.4.1 Italy: Smart Water Metering Market Breakdown, by Type
11.3.7.4.2 Italy: Smart Water Metering Market Breakdown, by Component
11.3.7.4.3 Italy: Smart Water Metering Market Breakdown, by End User
11.3.7.4.4 Italy: Smart Water Metering Market Breakdown, by Meter Type
11.3.7.5 United Kingdom: Smart Water Metering Market – Revenue and Forecast to 2031 (US$ Million)
11.3.7.5.1 United Kingdom: Smart Water Metering Market Breakdown, by Type
11.3.7.5.2 United Kingdom: Smart Water Metering Market Breakdown, by Component
11.3.7.5.3 United Kingdom: Smart Water Metering Market Breakdown, by End User
11.3.7.5.4 United Kingdom: Smart Water Metering Market Breakdown, by Meter Type
11.3.7.6 Russian Federation: Smart Water Metering Market – Revenue and Forecast to 2031 (US$ Million)
11.3.7.6.1 Russian Federation: Smart Water Metering Market Breakdown, by Type
11.3.7.6.2 Russian Federation: Smart Water Metering Market Breakdown, by Component
11.3.7.6.3 Russian Federation: Smart Water Metering Market Breakdown, by End User
11.3.7.6.4 Russian Federation: Smart Water Metering Market Breakdown, by Meter Type
11.3.7.7 Spain: Smart Water Metering Market – Revenue and Forecast to 2031 (US$ Million)
11.3.7.7.1 Spain: Smart Water Metering Market Breakdown, by Type
11.3.7.7.2 Spain: Smart Water Metering Market Breakdown, by Component
11.3.7.7.3 Spain: Smart Water Metering Market Breakdown, by End User
11.3.7.7.4 Spain: Smart Water Metering Market Breakdown, by Meter Type
11.3.7.8 Greece: Smart Water Metering Market – Revenue and Forecast to 2031 (US$ Million)
11.3.7.8.1 Greece: Smart Water Metering Market Breakdown, by Type
11.3.7.8.2 Greece: Smart Water Metering Market Breakdown, by Component
11.3.7.8.3 Greece: Smart Water Metering Market Breakdown, by End User
11.3.7.8.4 Greece: Smart Water Metering Market Breakdown, by Meter Type
11.3.7.9 Rest of Europe: Smart Water Metering Market – Revenue and Forecast to 2031 (US$ Million)
11.3.7.9.1 Rest of Europe: Smart Water Metering Market Breakdown, by Type
11.3.7.9.2 Rest of Europe: Smart Water Metering Market Breakdown, by Component
11.3.7.9.3 Rest of Europe: Smart Water Metering Market Breakdown, by End User
11.3.7.9.4 Rest of Europe: Smart Water Metering Market Breakdown, by Meter Type
11.4 Asia Pacific
11.4.1 Asia Pacific Smart Water Metering Market Overview
11.4.2 Asia Pacific: Smart Water Metering Market – Revenue and Forecast to 2031 (US$ Million)
11.4.3 Asia Pacific: Smart Water Metering Market Breakdown, by Type
11.4.3.1 Asia Pacific: Smart Water Metering Market – Revenue and Forecast Analysis – by Type
11.4.4 Asia Pacific: Smart Water Metering Market Breakdown, by Component
11.4.4.1 Asia Pacific: Smart Water Metering Market – Revenue and Forecast Analysis – by Component
11.4.5 Asia Pacific: Smart Water Metering Market Breakdown, by End User
11.4.5.1 Asia Pacific: Smart Water Metering Market – Revenue and Forecast Analysis – by End User
11.4.6 Asia Pacific: Smart Water Metering Market Breakdown, by Meter Type
11.4.6.1 Asia Pacific: Smart Water Metering Market – Revenue and Forecast Analysis – by Meter Type
11.4.7 Asia Pacific: Smart Water Metering Market – Revenue and Forecast Analysis – by Country
11.4.7.1 Asia Pacific: Smart Water Metering Market – Revenue and Forecast Analysis – by Country
11.4.7.2 Australia: Smart Water Metering Market – Revenue and Forecast to 2031 (US$ Million)
11.4.7.2.1 Australia: Smart Water Metering Market Breakdown, by Type
11.4.7.2.2 Australia: Smart Water Metering Market Breakdown, by Component
11.4.7.2.3 Australia: Smart Water Metering Market Breakdown, by End User
11.4.7.2.4 Australia: Smart Water Metering Market Breakdown, by Meter Type
11.4.7.3 China: Smart Water Metering Market – Revenue and Forecast to 2031 (US$ Million)
11.4.7.3.1 China: Smart Water Metering Market Breakdown, by Type
11.4.7.3.2 China: Smart Water Metering Market Breakdown, by Component
11.4.7.3.3 China: Smart Water Metering Market Breakdown, by End User
11.4.7.3.4 China: Smart Water Metering Market Breakdown, by Meter Type
11.4.7.4 India: Smart Water Metering Market – Revenue and Forecast to 2031 (US$ Million)
11.4.7.4.1 India: Smart Water Metering Market Breakdown, by Type
11.4.7.4.2 India: Smart Water Metering Market Breakdown, by Component
11.4.7.4.3 India: Smart Water Metering Market Breakdown, by End User
11.4.7.4.4 India: Smart Water Metering Market Breakdown, by Meter Type
11.4.7.5 Japan: Smart Water Metering Market – Revenue and Forecast to 2031 (US$ Million)
11.4.7.5.1 Japan: Smart Water Metering Market Breakdown, by Type
11.4.7.5.2 Japan: Smart Water Metering Market Breakdown, by Component
11.4.7.5.3 Japan: Smart Water Metering Market Breakdown, by End User
11.4.7.5.4 Japan: Smart Water Metering Market Breakdown, by Meter Type
11.4.7.6 South Korea: Smart Water Metering Market – Revenue and Forecast to 2031 (US$ Million)
11.4.7.6.1 South Korea: Smart Water Metering Market Breakdown, by Type
11.4.7.6.2 South Korea: Smart Water Metering Market Breakdown, by Component
11.4.7.6.3 South Korea: Smart Water Metering Market Breakdown, by End User
11.4.7.6.4 South Korea: Smart Water Metering Market Breakdown, by Meter Type
11.4.7.7 Rest of APAC: Smart Water Metering Market – Revenue and Forecast to 2031 (US$ Million)
11.4.7.7.1 Rest of APAC: Smart Water Metering Market Breakdown, by Type
11.4.7.7.2 Rest of APAC: Smart Water Metering Market Breakdown, by Component
11.4.7.7.3 Rest of APAC: Smart Water Metering Market Breakdown, by End User
11.4.7.7.4 Rest of APAC: Smart Water Metering Market Breakdown, by Meter Type
11.5 Middle East and Africa
11.5.1 Middle East and Africa Smart Water Metering Market Overview
11.5.2 Middle East and Africa: Smart Water Metering Market – Revenue and Forecast to 2031 (US$ Million)
11.5.3 Middle East and Africa: Smart Water Metering Market Breakdown, by Type
11.5.3.1 Middle East and Africa: Smart Water Metering Market – Revenue and Forecast Analysis – by Type
11.5.4 Middle East and Africa: Smart Water Metering Market Breakdown, by Component
11.5.4.1 Middle East and Africa: Smart Water Metering Market – Revenue and Forecast Analysis – by Component
11.5.5 Middle East and Africa: Smart Water Metering Market Breakdown, by End User
11.5.5.1 Middle East and Africa: Smart Water Metering Market – Revenue and Forecast Analysis – by End User
11.5.6 Middle East and Africa: Smart Water Metering Market Breakdown, by Meter Type
11.5.6.1 Middle East and Africa: Smart Water Metering Market – Revenue and Forecast Analysis – by Meter Type
11.5.7 Middle East and Africa: Smart Water Metering Market – Revenue and Forecast Analysis – by Country
11.5.7.1 Middle East and Africa: Smart Water Metering Market – Revenue and Forecast Analysis – by Country
11.5.7.2 South Africa: Smart Water Metering Market – Revenue and Forecast to 2031 (US$ Million)
11.5.7.2.1 South Africa: Smart Water Metering Market Breakdown, by Type
11.5.7.2.2 South Africa: Smart Water Metering Market Breakdown, by Component
11.5.7.2.3 South Africa: Smart Water Metering Market Breakdown, by End User
11.5.7.2.4 South Africa: Smart Water Metering Market Breakdown, by Meter Type
11.5.7.3 Saudi Arabia: Smart Water Metering Market – Revenue and Forecast to 2031 (US$ Million)
11.5.7.3.1 Saudi Arabia: Smart Water Metering Market Breakdown, by Type
11.5.7.3.2 Saudi Arabia: Smart Water Metering Market Breakdown, by Component
11.5.7.3.3 Saudi Arabia: Smart Water Metering Market Breakdown, by End User
11.5.7.3.4 Saudi Arabia: Smart Water Metering Market Breakdown, by Meter Type
11.5.7.4 United Arab Emirates: Smart Water Metering Market – Revenue and Forecast to 2031 (US$ Million)
11.5.7.4.1 United Arab Emirates: Smart Water Metering Market Breakdown, by Type
11.5.7.4.2 United Arab Emirates: Smart Water Metering Market Breakdown, by Component
11.5.7.4.3 United Arab Emirates: Smart Water Metering Market Breakdown, by End User
11.5.7.4.4 United Arab Emirates: Smart Water Metering Market Breakdown, by Meter Type
11.5.7.5 Egypt: Smart Water Metering Market – Revenue and Forecast to 2031 (US$ Million)
11.5.7.5.1 Egypt: Smart Water Metering Market Breakdown, by Type
11.5.7.5.2 Egypt: Smart Water Metering Market Breakdown, by Component
11.5.7.5.3 Egypt: Smart Water Metering Market Breakdown, by End User
11.5.7.5.4 Egypt: Smart Water Metering Market Breakdown, by Meter Type
11.5.7.6 West Africa: Smart Water Metering Market – Revenue and Forecast to 2031 (US$ Million)
11.5.7.6.1 West Africa: Smart Water Metering Market Breakdown, by Type
11.5.7.6.2 West Africa: Smart Water Metering Market Breakdown, by Component
11.5.7.6.3 West Africa: Smart Water Metering Market Breakdown, by End User
11.5.7.6.4 West Africa: Smart Water Metering Market Breakdown, by Meter Type
11.5.7.7 Rest of Middle East and Africa: Smart Water Metering Market – Revenue and Forecast to 2031 (US$ Million)
11.5.7.7.1 Rest of Middle East and Africa: Smart Water Metering Market Breakdown, by Type
11.5.7.7.2 Rest of Middle East and Africa: Smart Water Metering Market Breakdown, by Component
11.5.7.7.3 Rest of Middle East and Africa: Smart Water Metering Market Breakdown, by End User
11.5.7.7.4 Rest of Middle East and Africa: Smart Water Metering Market Breakdown, by Meter Type
11.6 South and Central America
11.6.1 South and Central America Smart Water Metering Market Overview
11.6.2 South and Central America: Smart Water Metering Market – Revenue and Forecast to 2031 (US$ Million)
11.6.3 South and Central America: Smart Water Metering Market Breakdown, by Type
11.6.3.1 South and Central America: Smart Water Metering Market – Revenue and Forecast Analysis – by Type
11.6.4 South and Central America: Smart Water Metering Market Breakdown, by Component
11.6.4.1 South and Central America: Smart Water Metering Market – Revenue and Forecast Analysis – by Component
11.6.5 South and Central America: Smart Water Metering Market Breakdown, by End User
11.6.5.1 South and Central America: Smart Water Metering Market – Revenue and Forecast Analysis – by End User
11.6.6 South and Central America: Smart Water Metering Market Breakdown, by Meter Type
11.6.6.1 South and Central America: Smart Water Metering Market – Revenue and Forecast Analysis – by Meter Type
11.6.7 South and Central America: Smart Water Metering Market – Revenue and Forecast Analysis – by Country
11.6.7.1 South and Central America: Smart Water Metering Market – Revenue and Forecast Analysis – by Country
11.6.7.2 Brazil: Smart Water Metering Market – Revenue and Forecast to 2031 (US$ Million)
11.6.7.2.1 Brazil: Smart Water Metering Market Breakdown, by Type
11.6.7.2.2 Brazil: Smart Water Metering Market Breakdown, by Component
11.6.7.2.3 Brazil: Smart Water Metering Market Breakdown, by End User
11.6.7.2.4 Brazil: Smart Water Metering Market Breakdown, by Meter Type
11.6.7.3 Argentina: Smart Water Metering Market – Revenue and Forecast to 2031 (US$ Million)
11.6.7.3.1 Argentina: Smart Water Metering Market Breakdown, by Type
11.6.7.3.2 Argentina: Smart Water Metering Market Breakdown, by Component
11.6.7.3.3 Argentina: Smart Water Metering Market Breakdown, by End User
11.6.7.3.4 Argentina: Smart Water Metering Market Breakdown, by Meter Type
11.6.7.4 Rest of South and Central America: Smart Water Metering Market – Revenue and Forecast to 2031 (US$ Million)
11.6.7.4.1 Rest of South and Central America: Smart Water Metering Market Breakdown, by Type
11.6.7.4.2 Rest of South and Central America: Smart Water Metering Market Breakdown, by Component
11.6.7.4.3 Rest of South and Central America: Smart Water Metering Market Breakdown, by End User
11.6.7.4.4 Rest of South and Central America: Smart Water Metering Market Breakdown, by Meter Type
12. Competitive Landscape
12.1 Heat Map Analysis by Key Players
12.2 Company Positioning & Concentration
13. Industry Landscape
13.1 Overview
13.2 Market Initiative
13.3 Product Development
13.4 Mergers & Acquisitions
14. Company Profiles
14.1 Kamstrup AS
14.1.1 Key Facts
14.1.2 Business Description
14.1.3 Products and Services
14.1.4 Financial Overview
14.1.5 SWOT Analysis
14.1.6 Key Developments
14.2 Mueller Water Products Inc
14.2.1 Key Facts
14.2.2 Business Description
14.2.3 Products and Services
14.2.4 Financial Overview
14.2.5 SWOT Analysis
14.2.6 Key Developments
14.3 Badger Meter Inc
14.3.1 Key Facts
14.3.2 Business Description
14.3.3 Products and Services
14.3.4 Financial Overview
14.3.5 SWOT Analysis
14.3.6 Key Developments
14.4 Itron Inc
14.4.1 Key Facts
14.4.2 Business Description
14.4.3 Products and Services
14.4.4 Financial Overview
14.4.5 SWOT Analysis
14.4.6 Key Developments
14.5 Neptune Technology Group Inc
14.5.1 Key Facts
14.5.2 Business Description
14.5.3 Products and Services
14.5.4 Financial Overview
14.5.5 SWOT Analysis
14.5.6 Key Developments
14.6 Arad Ltd
14.6.1 Key Facts
14.6.2 Business Description
14.6.3 Products and Services
14.6.4 Financial Overview
14.6.5 SWOT Analysis
14.6.6 Key Developments
14.7 Sensus USA Inc
14.7.1 Key Facts
14.7.2 Business Description
14.7.3 Products and Services
14.7.4 Financial Overview
14.7.5 SWOT Analysis
14.7.6 Key Developments
14.8 WAVIoT Integrated Systems LLC
14.8.1 Key Facts
14.8.2 Business Description
14.8.3 Products and Services
14.8.4 Financial Overview
14.8.5 SWOT Analysis
14.8.6 Key Developments
14.9 Bmeters SRL
14.9.1 Key Facts
14.9.2 Business Description
14.9.3 Products and Services
14.9.4 Financial Overview
14.9.5 SWOT Analysis
14.9.6 Key Developments
14.10 Diehl Stiftung & Co KG
14.10.1 Key Facts
14.10.2 Business Description
14.10.3 Products and Services
14.10.4 Financial Overview
14.10.5 SWOT Analysis
14.10.6 Key Developments
15. Appendix
15.1 About The Insight Partners
15.2 Word Index
List of Tables
Table 1. Smart Water Metering Market Segmentation
Table 2. List of Vendors
Table 3. Smart Water Metering Market – Revenue and Forecast to 2031 (US$ Million)
Table 4. Smart Water Metering Market – Revenue and Forecast to 2031 (US$ Million) – by Type
Table 5. Smart Water Metering Market – Revenue and Forecast to 2031 (US$ Million) – by Component
Table 6. Smart Water Metering Market – Revenue and Forecast to 2031 (US$ Million) – by End User
Table 7. Smart Water Metering Market – Revenue and Forecast to 2031 (US$ Million) – by Meter Type
Table 8. North America: Smart Water Metering Market – Revenue and Forecast to 2031(US$ Million) – by Type
Table 9. North America: Smart Water Metering Market – Revenue and Forecast to 2031(US$ Million) – by Component
Table 10. North America: Smart Water Metering Market – Revenue and Forecast to 2031(US$ Million) – by End User
Table 11. North America: Smart Water Metering Market – Revenue and Forecast to 2031(US$ Million) – by Meter Type
Table 12. North America: Smart Water Metering Market – Revenue and Forecast to 2031(US$ Million) – by Country
Table 13. United States: Smart Water Metering Market – Revenue and Forecast to 2031(US$ Million) – by Type
Table 14. United States: Smart Water Metering Market – Revenue and Forecast to 2031(US$ Million) – by Component
Table 15. United States: Smart Water Metering Market – Revenue and Forecast to 2031(US$ Million) – by End User
Table 16. United States: Smart Water Metering Market – Revenue and Forecast to 2031(US$ Million) – by Meter Type
Table 17. Canada: Smart Water Metering Market – Revenue and Forecast to 2031(US$ Million) – by Type
Table 18. Canada: Smart Water Metering Market – Revenue and Forecast to 2031(US$ Million) – by Component
Table 19. Canada: Smart Water Metering Market – Revenue and Forecast to 2031(US$ Million) – by End User
Table 20. Canada: Smart Water Metering Market – Revenue and Forecast to 2031(US$ Million) – by Meter Type
Table 21. Mexico: Smart Water Metering Market – Revenue and Forecast to 2031(US$ Million) – by Type
Table 22. Mexico: Smart Water Metering Market – Revenue and Forecast to 2031(US$ Million) – by Component
Table 23. Mexico: Smart Water Metering Market – Revenue and Forecast to 2031(US$ Million) – by End User
Table 24. Mexico: Smart Water Metering Market – Revenue and Forecast to 2031(US$ Million) – by Meter Type
Table 25. Europe: Smart Water Metering Market – Revenue and Forecast to 2031(US$ Million) – by Type
Table 26. Europe: Smart Water Metering Market – Revenue and Forecast to 2031(US$ Million) – by Component
Table 27. Europe: Smart Water Metering Market – Revenue and Forecast to 2031(US$ Million) – by End User
Table 28. Europe: Smart Water Metering Market – Revenue and Forecast to 2031(US$ Million) – by Meter Type
Table 29. Europe: Smart Water Metering Market – Revenue and Forecast to 2031(US$ Million) – by Country
Table 30. Germany: Smart Water Metering Market – Revenue and Forecast to 2031(US$ Million) – by Type
Table 31. Germany: Smart Water Metering Market – Revenue and Forecast to 2031(US$ Million) – by Component
Table 32. Germany: Smart Water Metering Market – Revenue and Forecast to 2031(US$ Million) – by End User
Table 33. Germany: Smart Water Metering Market – Revenue and Forecast to 2031(US$ Million) – by Meter Type
Table 34. France: Smart Water Metering Market – Revenue and Forecast to 2031(US$ Million) – by Type
Table 35. France: Smart Water Metering Market – Revenue and Forecast to 2031(US$ Million) – by Component
Table 36. France: Smart Water Metering Market – Revenue and Forecast to 2031(US$ Million) – by End User
Table 37. France: Smart Water Metering Market – Revenue and Forecast to 2031(US$ Million) – by Meter Type
Table 38. Italy: Smart Water Metering Market – Revenue and Forecast to 2031(US$ Million) – by Type
Table 39. Italy: Smart Water Metering Market – Revenue and Forecast to 2031(US$ Million) – by Component
Table 40. Italy: Smart Water Metering Market – Revenue and Forecast to 2031(US$ Million) – by End User
Table 41. Italy: Smart Water Metering Market – Revenue and Forecast to 2031(US$ Million) – by Meter Type
Table 42. United Kingdom: Smart Water Metering Market – Revenue and Forecast to 2031(US$ Million) – by Type
Table 43. United Kingdom: Smart Water Metering Market – Revenue and Forecast to 2031(US$ Million) – by Component
Table 44. United Kingdom: Smart Water Metering Market – Revenue and Forecast to 2031(US$ Million) – by End User
Table 45. United Kingdom: Smart Water Metering Market – Revenue and Forecast to 2031(US$ Million) – by Meter Type
Table 46. Russian Federation: Smart Water Metering Market – Revenue and Forecast to 2031(US$ Million) – by Type
Table 47. Russian Federation: Smart Water Metering Market – Revenue and Forecast to 2031(US$ Million) – by Component
Table 48. Russian Federation: Smart Water Metering Market – Revenue and Forecast to 2031(US$ Million) – by End User
Table 49. Russian Federation: Smart Water Metering Market – Revenue and Forecast to 2031(US$ Million) – by Meter Type
Table 50. Spain: Smart Water Metering Market – Revenue and Forecast to 2031(US$ Million) – by Type
Table 51. Spain: Smart Water Metering Market – Revenue and Forecast to 2031(US$ Million) – by Component
Table 52. Spain: Smart Water Metering Market – Revenue and Forecast to 2031(US$ Million) – by End User
Table 53. Spain: Smart Water Metering Market – Revenue and Forecast to 2031(US$ Million) – by Meter Type
Table 54. Greece: Smart Water Metering Market – Revenue and Forecast to 2031(US$ Million) – by Type
Table 55. Greece: Smart Water Metering Market – Revenue and Forecast to 2031(US$ Million) – by Component
Table 56. Greece: Smart Water Metering Market – Revenue and Forecast to 2031(US$ Million) – by End User
Table 57. Greece: Smart Water Metering Market – Revenue and Forecast to 2031(US$ Million) – by Meter Type
Table 58. Rest of Europe: Smart Water Metering Market – Revenue and Forecast to 2031(US$ Million) – by Type
Table 59. Rest of Europe: Smart Water Metering Market – Revenue and Forecast to 2031(US$ Million) – by Component
Table 60. Rest of Europe: Smart Water Metering Market – Revenue and Forecast to 2031(US$ Million) – by End User
Table 61. Rest of Europe: Smart Water Metering Market – Revenue and Forecast to 2031(US$ Million) – by Meter Type
Table 62. Asia Pacific: Smart Water Metering Market – Revenue and Forecast to 2031(US$ Million) – by Type
Table 63. Asia Pacific: Smart Water Metering Market – Revenue and Forecast to 2031(US$ Million) – by Component
Table 64. Asia Pacific: Smart Water Metering Market – Revenue and Forecast to 2031(US$ Million) – by End User
Table 65. Asia Pacific: Smart Water Metering Market – Revenue and Forecast to 2031(US$ Million) – by Meter Type
Table 66. Asia Pacific: Smart Water Metering Market – Revenue and Forecast to 2031(US$ Million) – by Country
Table 67. Australia: Smart Water Metering Market – Revenue and Forecast to 2031(US$ Million) – by Type
Table 68. Australia: Smart Water Metering Market – Revenue and Forecast to 2031(US$ Million) – by Component
Table 69. Australia: Smart Water Metering Market – Revenue and Forecast to 2031(US$ Million) – by End User
Table 70. Australia: Smart Water Metering Market – Revenue and Forecast to 2031(US$ Million) – by Meter Type
Table 71. China: Smart Water Metering Market – Revenue and Forecast to 2031(US$ Million) – by Type
Table 72. China: Smart Water Metering Market – Revenue and Forecast to 2031(US$ Million) – by Component
Table 73. China: Smart Water Metering Market – Revenue and Forecast to 2031(US$ Million) – by End User
Table 74. China: Smart Water Metering Market – Revenue and Forecast to 2031(US$ Million) – by Meter Type
Table 75. India: Smart Water Metering Market – Revenue and Forecast to 2031(US$ Million) – by Type
Table 76. India: Smart Water Metering Market – Revenue and Forecast to 2031(US$ Million) – by Component
Table 77. India: Smart Water Metering Market – Revenue and Forecast to 2031(US$ Million) – by End User
Table 78. India: Smart Water Metering Market – Revenue and Forecast to 2031(US$ Million) – by Meter Type
Table 79. Japan: Smart Water Metering Market – Revenue and Forecast to 2031(US$ Million) – by Type
Table 80. Japan: Smart Water Metering Market – Revenue and Forecast to 2031(US$ Million) – by Component
Table 81. Japan: Smart Water Metering Market – Revenue and Forecast to 2031(US$ Million) – by End User
Table 82. Japan: Smart Water Metering Market – Revenue and Forecast to 2031(US$ Million) – by Meter Type
Table 83. South Korea: Smart Water Metering Market – Revenue and Forecast to 2031(US$ Million) – by Type
Table 84. South Korea: Smart Water Metering Market – Revenue and Forecast to 2031(US$ Million) – by Component
Table 85. South Korea: Smart Water Metering Market – Revenue and Forecast to 2031(US$ Million) – by End User
Table 86. South Korea: Smart Water Metering Market – Revenue and Forecast to 2031(US$ Million) – by Meter Type
Table 87. Rest of APAC: Smart Water Metering Market – Revenue and Forecast to 2031(US$ Million) – by Type
Table 88. Rest of APAC: Smart Water Metering Market – Revenue and Forecast to 2031(US$ Million) – by Component
Table 89. Rest of APAC: Smart Water Metering Market – Revenue and Forecast to 2031(US$ Million) – by End User
Table 90. Rest of APAC: Smart Water Metering Market – Revenue and Forecast to 2031(US$ Million) – by Meter Type
Table 91. Middle East and Africa: Smart Water Metering Market – Revenue and Forecast to 2031(US$ Million) – by Type
Table 92. Middle East and Africa: Smart Water Metering Market – Revenue and Forecast to 2031(US$ Million) – by Component
Table 93. Middle East and Africa: Smart Water Metering Market – Revenue and Forecast to 2031(US$ Million) – by End User
Table 94. Middle East and Africa: Smart Water Metering Market – Revenue and Forecast to 2031(US$ Million) – by Meter Type
Table 95. Middle East and Africa: Smart Water Metering Market – Revenue and Forecast to 2031(US$ Million) – by Country
Table 96. South Africa: Smart Water Metering Market – Revenue and Forecast to 2031(US$ Million) – by Type
Table 97. South Africa: Smart Water Metering Market – Revenue and Forecast to 2031(US$ Million) – by Component
Table 98. South Africa: Smart Water Metering Market – Revenue and Forecast to 2031(US$ Million) – by End User
Table 99. South Africa: Smart Water Metering Market – Revenue and Forecast to 2031(US$ Million) – by Meter Type
Table 100. Saudi Arabia: Smart Water Metering Market – Revenue and Forecast to 2031(US$ Million) – by Type
Table 101. Saudi Arabia: Smart Water Metering Market – Revenue and Forecast to 2031(US$ Million) – by Component
Table 102. Saudi Arabia: Smart Water Metering Market – Revenue and Forecast to 2031(US$ Million) – by End User
Table 103. Saudi Arabia: Smart Water Metering Market – Revenue and Forecast to 2031(US$ Million) – by Meter Type
Table 104. United Arab Emirates: Smart Water Metering Market – Revenue and Forecast to 2031(US$ Million) – by Type
Table 105. United Arab Emirates: Smart Water Metering Market – Revenue and Forecast to 2031(US$ Million) – by Component
Table 106. United Arab Emirates: Smart Water Metering Market – Revenue and Forecast to 2031(US$ Million) – by End User
Table 107. United Arab Emirates: Smart Water Metering Market – Revenue and Forecast to 2031(US$ Million) – by Meter Type
Table 108. Egypt: Smart Water Metering Market – Revenue and Forecast to 2031(US$ Million) – by Type
Table 109. Egypt: Smart Water Metering Market – Revenue and Forecast to 2031(US$ Million) – by Component
Table 110. Egypt: Smart Water Metering Market – Revenue and Forecast to 2031(US$ Million) – by End User
Table 111. Egypt: Smart Water Metering Market – Revenue and Forecast to 2031(US$ Million) – by Meter Type
Table 112. West Africa: Smart Water Metering Market – Revenue and Forecast to 2031(US$ Million) – by Type
Table 113. West Africa: Smart Water Metering Market – Revenue and Forecast to 2031(US$ Million) – by Component
Table 114. West Africa: Smart Water Metering Market – Revenue and Forecast to 2031(US$ Million) – by End User
Table 115. West Africa: Smart Water Metering Market – Revenue and Forecast to 2031(US$ Million) – by Meter Type
Table 116. Rest of Middle East and Africa: Smart Water Metering Market – Revenue and Forecast to 2031(US$ Million) – by Type
Table 117. Rest of Middle East and Africa: Smart Water Metering Market – Revenue and Forecast to 2031(US$ Million) – by Component
Table 118. Rest of Middle East and Africa: Smart Water Metering Market – Revenue and Forecast to 2031(US$ Million) – by End User
Table 119. Rest of Middle East and Africa: Smart Water Metering Market – Revenue and Forecast to 2031(US$ Million) – by Meter Type
Table 120. South and Central America: Smart Water Metering Market – Revenue and Forecast to 2031(US$ Million) – by Type
Table 121. South and Central America: Smart Water Metering Market – Revenue and Forecast to 2031(US$ Million) – by Component
Table 122. South and Central America: Smart Water Metering Market – Revenue and Forecast to 2031(US$ Million) – by End User
Table 123. South and Central America: Smart Water Metering Market – Revenue and Forecast to 2031(US$ Million) – by Meter Type
Table 124. South and Central America: Smart Water Metering Market – Revenue and Forecast to 2031(US$ Million) – by Country
Table 125. Brazil: Smart Water Metering Market – Revenue and Forecast to 2031(US$ Million) – by Type
Table 126. Brazil: Smart Water Metering Market – Revenue and Forecast to 2031(US$ Million) – by Component
Table 127. Brazil: Smart Water Metering Market – Revenue and Forecast to 2031(US$ Million) – by End User
Table 128. Brazil: Smart Water Metering Market – Revenue and Forecast to 2031(US$ Million) – by Meter Type
Table 129. Argentina: Smart Water Metering Market – Revenue and Forecast to 2031(US$ Million) – by Type
Table 130. Argentina: Smart Water Metering Market – Revenue and Forecast to 2031(US$ Million) – by Component
Table 131. Argentina: Smart Water Metering Market – Revenue and Forecast to 2031(US$ Million) – by End User
Table 132. Argentina: Smart Water Metering Market – Revenue and Forecast to 2031(US$ Million) – by Meter Type
Table 133. Rest of South and Central America: Smart Water Metering Market – Revenue and Forecast to 2031(US$ Million) – by Type
Table 134. Rest of South and Central America: Smart Water Metering Market – Revenue and Forecast to 2031(US$ Million) – by Component
Table 135. Rest of South and Central America: Smart Water Metering Market – Revenue and Forecast to 2031(US$ Million) – by End User
Table 136. Rest of South and Central America: Smart Water Metering Market – Revenue and Forecast to 2031(US$ Million) – by Meter Type
Table 137. List of Abbreviation
List of Figures
Figure 1. Smart Water Metering Market Segmentation, by Geography
Figure 2. PEST Analysis
Figure 3. Ecosystem: Smart Water Metering Market
Figure 4. Impact Analysis of Drivers and Restraints
Figure 5. Smart Water Metering Market Breakdown by Geography, 2023 and 2031 (%)
Figure 6. Smart Water Metering Market Revenue (US$ Million), 2021–2031
Figure 7. Smart Water Metering Market Share (%) – by Type (2023 and 2031)
Figure 8. AMI: Smart Water Metering Market – Revenue and Forecast to 2031 (US$ Million)
Figure 9. AMR: Smart Water Metering Market – Revenue and Forecast to 2031 (US$ Million)
Figure 10. Smart Water Metering Market Share (%) – by Component (2023 and 2031)
Figure 11. Controlling Unit: Smart Water Metering Market – Revenue and Forecast to 2031 (US$ Million)
Figure 12. Display Storage and Integrated Software: Smart Water Metering Market – Revenue and Forecast to 2031 (US$ Million)
Figure 13. Others: Smart Water Metering Market – Revenue and Forecast to 2031 (US$ Million)
Figure 14. Smart Water Metering Market Share (%) – by End User (2023 and 2031)
Figure 15. Residential: Smart Water Metering Market – Revenue and Forecast to 2031 (US$ Million)
Figure 16. Industrial: Smart Water Metering Market – Revenue and Forecast to 2031 (US$ Million)
Figure 17. Smart Water Metering Market Share (%) – by Meter Type (2023 and 2031)
Figure 18. Ultrasonic Meters: Smart Water Metering Market – Revenue and Forecast to 2031 (US$ Million)
Figure 19. Electromagnetic Meters: Smart Water Metering Market – Revenue and Forecast to 2031 (US$ Million)
Figure 20. Electromechanical Meter: Smart Water Metering Market – Revenue and Forecast to 2031 (US$ Million)
Figure 21. Smart Water Metering Market Breakdown by Region, 2023 and 2031 (%)
Figure 22. North America: Smart Water Metering Market – Revenue and Forecast to 2031(US$ Million)
Figure 23. North America: Smart Water Metering Market Breakdown, by Type (2023 and 2031)
Figure 24. North America: Smart Water Metering Market Breakdown, by Component (2023 and 2031)
Figure 25. North America: Smart Water Metering Market Breakdown, by End User (2023 and 2031)
Figure 26. North America: Smart Water Metering Market Breakdown, by Meter Type (2023 and 2031)
Figure 27. North America: Smart Water Metering Market Breakdown, by Key Countries, 2023 and 2031 (%)
Figure 28. United States: Smart Water Metering Market – Revenue and Forecast to 2031(US$ Million)
Figure 29. Canada: Smart Water Metering Market – Revenue and Forecast to 2031(US$ Million)
Figure 30. Mexico: Smart Water Metering Market – Revenue and Forecast to 2031(US$ Million)
Figure 31. Europe: Smart Water Metering Market – Revenue and Forecast to 2031(US$ Million)
Figure 32. Europe: Smart Water Metering Market Breakdown, by Type (2023 and 2031)
Figure 33. Europe: Smart Water Metering Market Breakdown, by Component (2023 and 2031)
Figure 34. Europe: Smart Water Metering Market Breakdown, by End User (2023 and 2031)
Figure 35. Europe: Smart Water Metering Market Breakdown, by Meter Type (2023 and 2031)
Figure 36. Europe: Smart Water Metering Market Breakdown, by Key Countries, 2023 and 2031 (%)
Figure 37. Germany: Smart Water Metering Market – Revenue and Forecast to 2031(US$ Million)
Figure 38. France: Smart Water Metering Market – Revenue and Forecast to 2031(US$ Million)
Figure 39. Italy: Smart Water Metering Market – Revenue and Forecast to 2031(US$ Million)
Figure 40. United Kingdom: Smart Water Metering Market – Revenue and Forecast to 2031(US$ Million)
Figure 41. Russian Federation: Smart Water Metering Market – Revenue and Forecast to 2031(US$ Million)
Figure 42. Spain: Smart Water Metering Market – Revenue and Forecast to 2031(US$ Million)
Figure 43. Greece: Smart Water Metering Market – Revenue and Forecast to 2031(US$ Million)
Figure 44. Rest of Europe: Smart Water Metering Market – Revenue and Forecast to 2031(US$ Million)
Figure 45. Asia Pacific: Smart Water Metering Market – Revenue and Forecast to 2031(US$ Million)
Figure 46. Asia Pacific: Smart Water Metering Market Breakdown, by Type (2023 and 2031)
Figure 47. Asia Pacific: Smart Water Metering Market Breakdown, by Component (2023 and 2031)
Figure 48. Asia Pacific: Smart Water Metering Market Breakdown, by End User (2023 and 2031)
Figure 49. Asia Pacific: Smart Water Metering Market Breakdown, by Meter Type (2023 and 2031)
Figure 50. Asia Pacific: Smart Water Metering Market Breakdown, by Key Countries, 2023 and 2031 (%)
Figure 51. Australia: Smart Water Metering Market – Revenue and Forecast to 2031(US$ Million)
Figure 52. China: Smart Water Metering Market – Revenue and Forecast to 2031(US$ Million)
Figure 53. India: Smart Water Metering Market – Revenue and Forecast to 2031(US$ Million)
Figure 54. Japan: Smart Water Metering Market – Revenue and Forecast to 2031(US$ Million)
Figure 55. South Korea: Smart Water Metering Market – Revenue and Forecast to 2031(US$ Million)
Figure 56. Rest of APAC: Smart Water Metering Market – Revenue and Forecast to 2031(US$ Million)
Figure 57. Middle East and Africa: Smart Water Metering Market – Revenue and Forecast to 2031(US$ Million)
Figure 58. Middle East and Africa: Smart Water Metering Market Breakdown, by Type (2023 and 2031)
Figure 59. Middle East and Africa: Smart Water Metering Market Breakdown, by Component (2023 and 2031)
Figure 60. Middle East and Africa: Smart Water Metering Market Breakdown, by End User (2023 and 2031)
Figure 61. Middle East and Africa: Smart Water Metering Market Breakdown, by Meter Type (2023 and 2031)
Figure 62. Middle East and Africa: Smart Water Metering Market Breakdown, by Key Countries, 2023 and 2031 (%)
Figure 63. South Africa: Smart Water Metering Market – Revenue and Forecast to 2031(US$ Million)
Figure 64. Saudi Arabia: Smart Water Metering Market – Revenue and Forecast to 2031(US$ Million)
Figure 65. United Arab Emirates: Smart Water Metering Market – Revenue and Forecast to 2031(US$ Million)
Figure 66. Egypt: Smart Water Metering Market – Revenue and Forecast to 2031(US$ Million)
Figure 67. West Africa: Smart Water Metering Market – Revenue and Forecast to 2031(US$ Million)
Figure 68. Rest of Middle East and Africa: Smart Water Metering Market – Revenue and Forecast to 2031(US$ Million)
Figure 69. South and Central America: Smart Water Metering Market – Revenue and Forecast to 2031(US$ Million)
Figure 70. South and Central America: Smart Water Metering Market Breakdown, by Type (2023 and 2031)
Figure 71. South and Central America: Smart Water Metering Market Breakdown, by Component (2023 and 2031)
Figure 72. South and Central America: Smart Water Metering Market Breakdown, by End User (2023 and 2031)
Figure 73. South and Central America: Smart Water Metering Market Breakdown, by Meter Type (2023 and 2031)
Figure 74. South and Central America: Smart Water Metering Market Breakdown, by Key Countries, 2023 and 2031 (%)
Figure 75. Brazil: Smart Water Metering Market – Revenue and Forecast to 2031(US$ Million)
Figure 76. Argentina: Smart Water Metering Market – Revenue and Forecast to 2031(US$ Million)
Figure 77. Rest of South and Central America: Smart Water Metering Market – Revenue and Forecast to 2031(US$ Million)
Figure 78. Heat Map Analysis by Key Players
Figure 79. Company Positioning & Concentration
The List of Companies - Smart Water Metering Market
- Kamstrup AS
- Mueller Water Products Inc
- Badger Meter Inc
- Itron Inc
- Neptune Technology Group Inc
- Arad Ltd
- Sensus USA Inc
- WAVIoT Integrated Systems LLC
- Bmeters SRL
- Diehl Stiftung & Co KG
The Insight Partners performs research in 4 major stages: Data Collection & Secondary Research, Primary Research, Data Analysis and Data Triangulation & Final Review.
- Data Collection and Secondary Research:
As a market research and consulting firm operating from a decade, we have published many reports and advised several clients across the globe. First step for any study will start with an assessment of currently available data and insights from existing reports. Further, historical and current market information is collected from Investor Presentations, Annual Reports, SEC Filings, etc., and other information related to company’s performance and market positioning are gathered from Paid Databases (Factiva, Hoovers, and Reuters) and various other publications available in public domain.
Several associations trade associates, technical forums, institutes, societies and organizations are accessed to gain technical as well as market related insights through their publications such as research papers, blogs and press releases related to the studies are referred to get cues about the market. Further, white papers, journals, magazines, and other news articles published in the last 3 years are scrutinized and analyzed to understand the current market trends.
- Primary Research:
The primarily interview analysis comprise of data obtained from industry participants interview and answers to survey questions gathered by in-house primary team.
For primary research, interviews are conducted with industry experts/CEOs/Marketing Managers/Sales Managers/VPs/Subject Matter Experts from both demand and supply side to get a 360-degree view of the market. The primary team conducts several interviews based on the complexity of the markets to understand the various market trends and dynamics which makes research more credible and precise.
A typical research interview fulfils the following functions:
- Provides first-hand information on the market size, market trends, growth trends, competitive landscape, and outlook
- Validates and strengthens in-house secondary research findings
- Develops the analysis team’s expertise and market understanding
Primary research involves email interactions and telephone interviews for each market, category, segment, and sub-segment across geographies. The participants who typically take part in such a process include, but are not limited to:
- Industry participants: VPs, business development managers, market intelligence managers and national sales managers
- Outside experts: Valuation experts, research analysts and key opinion leaders specializing in the electronics and semiconductor industry.
Below is the breakup of our primary respondents by company, designation, and region:

Once we receive the confirmation from primary research sources or primary respondents, we finalize the base year market estimation and forecast the data as per the macroeconomic and microeconomic factors assessed during data collection.
- Data Analysis:
Once data is validated through both secondary as well as primary respondents, we finalize the market estimations by hypothesis formulation and factor analysis at regional and country level.
- 3.1 Macro-Economic Factor Analysis:
We analyse macroeconomic indicators such the gross domestic product (GDP), increase in the demand for goods and services across industries, technological advancement, regional economic growth, governmental policies, the influence of COVID-19, PEST analysis, and other aspects. This analysis aids in setting benchmarks for various nations/regions and approximating market splits. Additionally, the general trend of the aforementioned components aid in determining the market's development possibilities.
- 3.2 Country Level Data:
Various factors that are especially aligned to the country are taken into account to determine the market size for a certain area and country, including the presence of vendors, such as headquarters and offices, the country's GDP, demand patterns, and industry growth. To comprehend the market dynamics for the nation, a number of growth variables, inhibitors, application areas, and current market trends are researched. The aforementioned elements aid in determining the country's overall market's growth potential.
- 3.3 Company Profile:
The “Table of Contents” is formulated by listing and analyzing more than 25 - 30 companies operating in the market ecosystem across geographies. However, we profile only 10 companies as a standard practice in our syndicate reports. These 10 companies comprise leading, emerging, and regional players. Nonetheless, our analysis is not restricted to the 10 listed companies, we also analyze other companies present in the market to develop a holistic view and understand the prevailing trends. The “Company Profiles” section in the report covers key facts, business description, products & services, financial information, SWOT analysis, and key developments. The financial information presented is extracted from the annual reports and official documents of the publicly listed companies. Upon collecting the information for the sections of respective companies, we verify them via various primary sources and then compile the data in respective company profiles. The company level information helps us in deriving the base number as well as in forecasting the market size.
- 3.4 Developing Base Number:
Aggregation of sales statistics (2020-2022) and macro-economic factor, and other secondary and primary research insights are utilized to arrive at base number and related market shares for 2022. The data gaps are identified in this step and relevant market data is analyzed, collected from paid primary interviews or databases. On finalizing the base year market size, forecasts are developed on the basis of macro-economic, industry and market growth factors and company level analysis.
- Data Triangulation and Final Review:
The market findings and base year market size calculations are validated from supply as well as demand side. Demand side validations are based on macro-economic factor analysis and benchmarks for respective regions and countries. In case of supply side validations, revenues of major companies are estimated (in case not available) based on industry benchmark, approximate number of employees, product portfolio, and primary interviews revenues are gathered. Further revenue from target product/service segment is assessed to avoid overshooting of market statistics. In case of heavy deviations between supply and demand side values, all thes steps are repeated to achieve synchronization.
We follow an iterative model, wherein we share our research findings with Subject Matter Experts (SME’s) and Key Opinion Leaders (KOLs) until consensus view of the market is not formulated – this model negates any drastic deviation in the opinions of experts. Only validated and universally acceptable research findings are quoted in our reports.
We have important check points that we use to validate our research findings – which we call – data triangulation, where we validate the information, we generate from secondary sources with primary interviews and then we re-validate with our internal data bases and Subject matter experts. This comprehensive model enables us to deliver high quality, reliable data in shortest possible time.
 Get Free Sample For