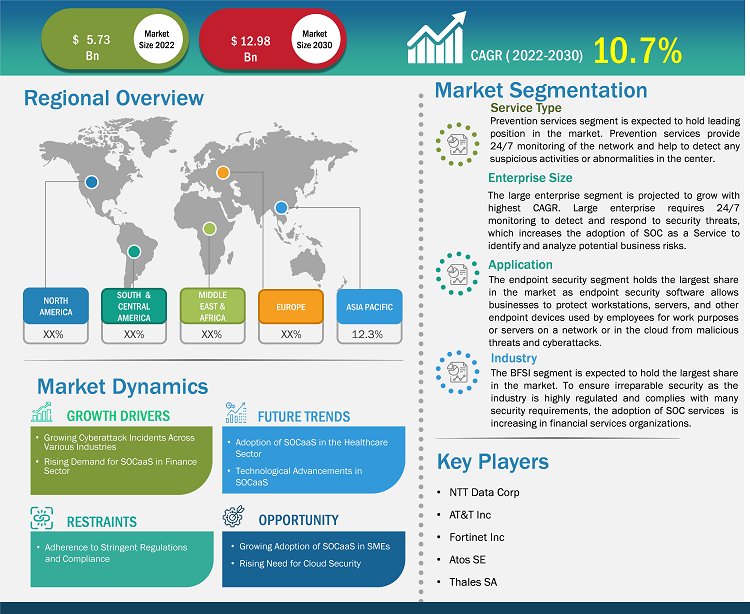
The SOC as a service market size is projected to reach US$ 12.98 billion by 2030 from US$ 5.73 billion in 2022. The market is expected to register a CAGR of 10.7% during 2022–2030. The adoption of SOCaaS in the healthcare industry and technological advancement in SOCaaS are likely to remain a key trend in the market.
SOC as a Service Market Analysis
The rise in data breach cases in various organizations across the globe is considered one of the major factors propelling the SOC as a service market growth. Per IBM’s 2022 Cost of a Data Breach report, ransomware attacks grew in 2022, leading to a loss of approximately US$ 4.54 million. In addition, various organizations face a large number of cyberattacks worldwide. Finance institutions lose ~US$ 5.9 million per data breach, which is 28% higher than the global average. Thus, such growing cyberattacks in the financial sector are raising the adoption of SOCaaS. Also, healthcare organizations are adopting SOCaaS to protect sensitive patient data, which includes medical records and personal information. SOC 2 compliance helps healthcare organizations ensure they comply with federal requirements for protecting their sensitive data. Furthermore, as cyberattacks are increasing in SMEs, the demand for SOCaaS is expected to increase, creating future opportunities for the growth of the market.
SOC as a Service Market Overview
SOC as a service (SOCaaS) is a security model where a third-party vendor operates and maintains a fully managed SOC. It provides various security functions such as network monitoring, threat detection and intelligence, incident investigation and response, log management, reporting, and risk and compliance. By combining SOC with advanced technology such as artificial intelligence (AI) and automation, the SOC team can accurately identify, categorize, prioritize, and remediate security events. As data breach cases continuously increase, organizations must reduce the time spent on investigating false positives. They should focus more on the issues that pose a real threat to the business. In addition, SOCaaS operates continuously, providing 24/7 monitoring, detection, and response capabilities, which help tackle threats quickly, allowing organizations to reduce their breakout time, thus boosting the SOC as a service market growth.
Customize Research To Suit Your Requirement
We can optimize and tailor the analysis and scope which is unmet through our standard offerings. This flexibility will help you gain the exact information needed for your business planning and decision making.
SOC as a Service Market: Strategic Insights
Market Size Value in US$ 5.73 billion in 2022 Market Size Value by US$ 12.98 billion by 2030 Growth rate CAGR of 10.7% from 2022 to 2030 Forecast Period 2022-2030 Base Year 2022

Naveen
Have a question?
Naveen will walk you through a 15-minute call to present the report’s content and answer all queries if you have any.
 Speak to Analyst
Customize Research To Suit Your Requirement
We can optimize and tailor the analysis and scope which is unmet through our standard offerings. This flexibility will help you gain the exact information needed for your business planning and decision making.
SOC as a Service Market: Strategic Insights
| Market Size Value in | US$ 5.73 billion in 2022 |
| Market Size Value by | US$ 12.98 billion by 2030 |
| Growth rate | CAGR of 10.7% from 2022 to 2030 |
| Forecast Period | 2022-2030 |
| Base Year | 2022 |
Naveen
Have a question?
Naveen will walk you through a 15-minute call to present the report’s content and answer all queries if you have any.
Speak to Analyst
SOC as a Service Market Drivers and Opportunities
Rising Demand for SOCaaS in the Finance Sector to Favor Market
Financial and banking institutes handle a vast amount of sensitive data, which makes them a prime target for cyberattacks. Also, digitalization and securing business continuity are highly prioritized in the finance industry. This increases the demand for SOCaaS solutions. SOCaaS providers help banks monitor networks and systems 24/7, ensuring quick detection and mitigation of potential security threats and reducing the data breach risk. In addition, SOCaaS providers also help banks to comply with various regulatory requirements. For instance, the Payment Card Industry Data Security Standard (PCI DSS) requires banks to have a robust security program. They can help banks meet such regulatory requirements by providing the needed monitoring, analysis, and reporting capabilities. Thus, the growing recognition of the essential need for comprehensive and exhaustive SIEM and threat intelligence solutions by banks is raising the demand for SOCaaS, thereby driving the market.
Increasing Adoption of AI and ML
The adoption of technologies such as artificial intelligence (AI) and machine learning (ML) is revolutionizing threat detection within SOCs. Both of these technologies automate tasks, enhance the personalization of security responses, and analyze vast amounts of data. Organizations struggle to detect and respond to incidents swiftly and accurately due to the increasing volume and complexity of cyber threats. Technologies such as AI and ML enable SOCs to analyze patterns and anomalies in security data and predict potential threats, which enables organizations to prioritize tasks effectively. Thus, increasing adoption of AI and ML provides growth opportunities for the SOC as a service market growth.
SOC as a Service Market Report Segmentation Analysis
Key segments that contributed to the derivation of the SOC as a service market analysis are the service type, enterprise size, application and industry.
- Based on the service type, the SOC as a service market is divided into prevention service, detection service, and incident response service. The prevention service segment will hold a significant market share in 2022.
- By enterprise size, the market is segmented into large enterprises and SMEs. The large enterprises segment held the largest market share in 2022.
- In terms of application, the market is segmented into network security, endpoint security, application security, and cloud security. The endpoint security segment is expected to grow with the highest CAGR over the forecast period.
- In terms of industry, the market is segmented into BFSI, IT & telecom, manufacturing, retail, government & public sector, healthcare, and others. The BFSI segment is expected to grow with the highest CAGR over the forecast period.
SOC as a Service Market Share Analysis by Geography
The geographic scope of the SOC as a service market report is mainly divided into five regions: North America, Asia Pacific, Europe, Middle East & Africa, and South & Central America.
North America contributes a noteworthy share to the global SOC as a service market owing to the wide presence of key market players such as Fortinet, Inc.; Verizon; AT&T; Arctic Wolf Networks Inc.; and Cloudflare, Inc. These players continuously develop and expand their service portfolio to attract new customers. For instance, in April 2023, Fortinet, Inc. launched FortiOS 7.4 to support organizations in building cybersecurity platforms across endpoint security, SOC automation, application security, identity and access, and threat intelligence. FortiOS 7.4 has new real-time response and automation capabilities that help the user increase effectiveness, improve efficacy, and accelerate time to resolve sophisticated attacks. In addition, Fortinet, Inc. expands Fortinet Security Fabric by adding new and enhanced products and capabilities that allow its users to advance threat prevention and coordinate response for a self-defending ecosystem across networks, clouds, and endpoints. Moreover, implementing IoT in business operations makes hyperconnectivity affordable to enterprises, which increases the demand for IoT among enterprises. According to Cisco, the US is expected to register 13.6 billion per capita IoT devices and connections by the end of 2023. The adoption of IoT devices and connections adds complexity for the SOC team to detect cyberattacks. The security team is already dealing with the ever-changing cybersecurity industry, implementing IoT in business operations, and creating challenges for the SOC team to understand patterns of cyberattacks.
SOC as a Service Market Report Scope
SOC as a Service Market News and Recent Developments
The SOC as a service market is evaluated by gathering qualitative and quantitative data post primary and secondary research, which includes important corporate publications, association data, and databases. A few of the developments in the SOC as a service market are listed below:
- Palo Alto Networks announced a new milestone in how security operations centers (SOC) secure the cloud. The innovations as part of Cortex XSIAM for Cloud bolster the Palo Alto Networks Cortex XSIAM platform to natively deliver Cloud Detection and Response capabilities in one unified solution, making Cortex XSIAM the industry's first SOC platform optimized for the cloud. (Source: Palo Alto Networks, Press Release, April 2024)
- Exclusive Networks, in partnership with Palo Alto Networks, announced the launch of Managed SOC as a Service, a revolutionary solution designed to empower Palo Alto Networks partners in EMEA to capitalize on the rapidly growing Managed Security Service (MSSP) market. (Source: Exclusive Networks, Press Release, March 2024)
SOC as a Service Market Report Coverage and Deliverables
The “SOC as a Service Market Size and Forecast (2020–2030)” report provides a detailed analysis of the market covering below areas:
- SOC as a service market size and forecast at global, regional, and country levels for all the key market segments covered under the scope
- SOC as a service market trends, as well as market dynamics such as drivers, restraints, and key opportunities
- Detailed PEST/Porter’s Five Forces and SWOT analysis
- SOC as a service market analysis covering key market trends, global and regional framework, major players, regulations, and recent market developments
- Industry landscape and competition analysis covering market concentration, heat map analysis, prominent players, and recent developments for the SOC as a service market
- Detailed company profiles

Report Coverage
Revenue forecast, Company Analysis, Industry landscape, Growth factors, and Trends

Segment Covered
Service Type, Enterprise Size, Application, and Industry

Regional Scope
North America, Europe, Asia Pacific, Middle East & Africa, South & Central America

Country Scope
This text is related
to country scope.
Frequently Asked Questions
The leading players operating in the SOC as a service market are Fortinet Inc, Atos SE, NTT Data Corp, Verizon Communications Inc, Thales SA, AT&T Inc, Arctic Wolf Networks Inc, Cloudflare Inc, ESDS Software Solution Ltd, and ConnectWise LLC.
The SOC as a service market size is projected to reach US$ 12.98 billion by 2030.
North America is expected to dominate the SOC as a service market with the highest market share in 2023.
The adoption of SOCaaS in the healthcare industry and technological advancement in SOCaaS are anticipated to play a significant role in the global SOC as a service market in the coming years.
The global SOC as a service market is expected to grow at a CAGR of 10.7% during the forecast period 2023 - 2030.
The major factors driving the SOC as a service market are rising demand for SOCaaS in the finance sector and rising cyberattack incidents across various industries.
1. Introduction
1.1 The Insight Partners Research Report Guidance
1.2 Market Segmentation
2. Executive Summary
2.1 Key Insights
2.2 Market Attractiveness
3. Research Methodology
3.1 Coverage
3.2 Secondary Research
3.3 Primary Research
4. SOC as a Service Market Landscape
4.1 Overview
4.2 PEST Analysis
4.3 Ecosystem Analysis
4.3.1 List of Vendors in Value Chain:
5. SOC as a Service Market - Key Industry Dynamics
5.1 Drivers
5.1.1 Growing Cyberattack Incidents Across Various Industries
5.1.2 Rising Demand for SOCaaS in Finance Sector
5.2 Market Restraints
5.2.1 Adherence to Stringent Regulations and Compliance
5.3 Market Opportunities
5.3.1 Growing Adoption of SOCaaS in SMEs
5.3.2 Rising Need for Cloud Security
5.4 Market Trends
5.4.1 Adoption of SOCaaS in the Healthcare Sector
5.4.2 Technological Advancements in SOCaaS
5.5 Impact of Drivers and Restraints:
6. SOC as a Service Market - Global Market Analysis
6.1 SOC as a Service Market Overview
6.2 SOC as a Service Market Revenue (US$ Million), 2022 – 2030
6.3 SOC as a Service Market Forecast and Analysis
7. SOC as a Service Market Analysis - Service Type
7.1 Prevention Service
7.1.1 Overview
7.1.2 Prevention Service Market Revenue and Forecasts To 2030 (US$ Million)
7.2 Detection Service
7.2.1 Overview
7.2.2 Detection Service Market Revenue and Forecasts To 2030 (US$ Million)
7.3 Incident Response Service
7.3.1 Overview
7.3.2 Incident Response Service Market Revenue and Forecasts To 2030 (US$ Million)
8. SOC as a Service Market Analysis - Enterprise Size
8.1 Large Enterprises
8.1.1 Overview
8.1.2 Large Enterprises Market Revenue and Forecasts To 2030 (US$ Million)
8.2 SMEs
8.2.1 Overview
8.2.2 SMEs Market Revenue and Forecasts To 2030 (US$ Million)
9. SOC as a Service Market Analysis - Application
9.1 Network Security
9.1.1 Overview
9.1.2 Network Security Market Revenue and Forecasts To 2030 (US$ Million)
9.2 Endpoint Security
9.2.1 Overview
9.2.2 Endpoint Security Market Revenue and Forecasts To 2030 (US$ Million)
9.3 Application Security
9.3.1 Overview
9.3.2 Application Security Market Revenue and Forecasts To 2030 (US$ Million)
9.4 Cloud Security
9.4.1 Overview
9.4.2 Large Enterprises Security Market Revenue and Forecasts To 2030 (US$ Million)
10. SOC as a Service Market Analysis – Industry
10.1 BFSI
10.1.1 Overview
10.1.2 BFSI Market Revenue and Forecasts To 2030 (US$ Million)
10.2 IT and Telecom
10.2.1 Overview
10.2.2 IT and Telecom Market Revenue and Forecasts To 2030 (US$ Million)
10.3 Manufacturing
10.3.1 Overview
10.3.2 Manufacturing Market Revenue and Forecasts To 2030 (US$ Million)
10.4 Retail
10.4.1 Overview
10.4.2 Retail Market Revenue and Forecasts To 2030 (US$ Million)
10.5 Government and Public Sector
10.5.1 Overview
10.5.2 Government and Public Sector Market Revenue and Forecasts To 2030 (US$ Million)
10.6 Healthcare
10.6.1 Overview
10.6.2 Healthcare Market Revenue and Forecasts To 2030 (US$ Million)
10.7 Others
10.7.1 Overview
10.7.2 Others Market Revenue and Forecasts To 2030 (US$ Million)
11. SOC as a Service Market - Geographical Analysis
11.1 North America
11.1.1 North America SOC as a Service Market Overview
11.1.2 North America SOC as a Service Market Revenue and Forecasts to 2030 (US$ Mn)
11.1.3 North America SOC as a Service Market Breakdown by Service Type
11.1.3.1 North America SOC as a Service Market Revenue and Forecasts To 2030 (US$ Mn) – By Service Type
11.1.4 North America SOC as a Service Market Breakdown by Enterprise Size
11.1.4.1 North America SOC as a Service Market Revenue and Forecasts To 2030 (US$ Mn) – By Enterprise Size
11.1.5 North America SOC as a Service Market Breakdown by Application
11.1.5.1 North America SOC as a Service Market Revenue and Forecasts To 2030 (US$ Mn) – By Application
11.1.6 North America SOC as a Service Market Breakdown by Industry
11.1.6.1 North America SOC as a Service Market Revenue and Forecasts To 2030 (US$ Mn) – By Industry
11.1.7 North America SOC as a Service Market Revenue and Forecasts and Analysis - By Countries
11.1.7.1 US SOC as a Service Market Revenue and Forecasts to 2030 (US$ Mn)
11.1.7.1.1 US SOC as a Service Market Breakdown by Service Type
11.1.7.1.2 US SOC as a Service Market Breakdown by Enterprise Size
11.1.7.1.3 US SOC as a Service Market Breakdown by Application
11.1.7.1.4 US SOC as a Service Market Breakdown by Industry
11.1.7.2 Canada SOC as a Service Market Revenue and Forecasts to 2030 (US$ Mn)
11.1.7.2.1 Canada SOC as a Service Market Breakdown by Service Type
11.1.7.2.2 Canada SOC as a Service Market Breakdown by Enterprise Size
11.1.7.2.3 Canada SOC as a Service Market Breakdown by Application
11.1.7.2.4 Canada SOC as a Service Market Breakdown by Industry
11.1.7.3 Mexico SOC as a Service Market Revenue and Forecasts to 2030 (US$ Mn)
11.1.7.3.1 Mexico SOC as a Service Market Breakdown by Service Type
11.1.7.3.2 Mexico SOC as a Service Market Breakdown by Enterprise Size
11.1.7.3.3 Mexico SOC as a Service Market Breakdown by Application
11.1.7.3.4 Mexico SOC as a Service Market Breakdown by Industry
11.2 Europe
11.2.1 Europe SOC as a Service Market Overview
11.2.2 Europe SOC as a Service Market Revenue and Forecasts to 2030 (US$ Mn)
11.2.3 Europe SOC as a Service Market Breakdown by Service Type
11.2.3.1 Europe SOC as a Service Market Revenue and Forecasts and Analysis - By Service Type
11.2.4 Europe SOC as a Service Market Breakdown by Enterprise Size
11.2.4.1 Europe SOC as a Service Market Revenue and Forecasts and Analysis - By Enterprise Size
11.2.5 Europe SOC as a Service Market Breakdown by Application
11.2.5.1 Europe SOC as a Service Market Revenue and Forecasts and Analysis - By Application
11.2.6 Europe SOC as a Service Market Breakdown by Industry
11.2.6.1 Europe SOC as a Service Market Revenue and Forecasts and Analysis - By Industry
11.2.7 Europe SOC as a Service Market Revenue and Forecasts and Analysis - By Countries
11.2.7.1 France SOC as a Service Market Revenue and Forecasts to 2030 (US$ Mn)
11.2.7.1.1 France SOC as a Service Market Breakdown by Service Type
11.2.7.1.2 France SOC as a Service Market Breakdown by Enterprise Size
11.2.7.1.3 France SOC as a Service Market Breakdown by Application
11.2.7.1.4 France SOC as a Service Market Breakdown by Industry
11.2.7.2 Germany SOC as a Service Market Revenue and Forecasts to 2030 (US$ Mn)
11.2.7.2.1 Germany SOC as a Service Market Breakdown by Service Type
11.2.7.2.2 Germany SOC as a Service Market Breakdown by Enterprise Size
11.2.7.2.3 Germany SOC as a Service Market Breakdown by Application
11.2.7.2.4 Germany SOC as a Service Market Breakdown by Industry
11.2.7.3 UK SOC as a Service Market Revenue and Forecasts to 2030 (US$ Mn)
11.2.7.3.1 UK SOC as a Service Market Breakdown by Service Type
11.2.7.3.2 UK SOC as a Service Market Breakdown by Enterprise Size
11.2.7.3.3 UK SOC as a Service Market Breakdown by Application
11.2.7.3.4 UK SOC as a Service Market Breakdown by Industry
11.2.7.4 Italy SOC as a Service Market Revenue and Forecasts to 2030 (US$ Mn)
11.2.7.4.1 Italy SOC as a Service Market Breakdown by Service Type
11.2.7.4.2 Italy SOC as a Service Market Breakdown by Enterprise Size
11.2.7.4.3 Italy SOC as a Service Market Breakdown by Application
11.2.7.4.4 Italy SOC as a Service Market Breakdown by Industry
11.2.7.5 Russia SOC as a Service Market Revenue and Forecasts to 2030 (US$ Mn)
11.2.7.5.1 Russia SOC as a Service Market Breakdown by Service Type
11.2.7.5.2 Russia SOC as a Service Market Breakdown by Enterprise Size
11.2.7.5.3 Russia SOC as a Service Market Breakdown by Application
11.2.7.5.4 Russia SOC as a Service Market Breakdown by Industry
11.2.7.6 Rest of Europe SOC as a Service Market Revenue and Forecasts to 2030 (US$ Mn)
11.2.7.6.1 Rest of Europe SOC as a Service Market Breakdown by Service Type
11.2.7.6.2 Rest of Europe SOC as a Service Market Breakdown by Enterprise Size
11.2.7.6.3 Rest of Europe SOC as a Service Market Breakdown by Application
11.2.7.6.4 Rest of Europe SOC as a Service Market Breakdown by Industry
11.3 Asia Pacific SOC as a Service Market
11.3.1 Overview
11.3.2 Asia Pacific SOC as a Service Market Revenue and Forecasts To 2030 (US$ Million)
11.3.3 Asia Pacific SOC as a Service Market Breakdown by Service Type
11.3.3.1 Asia Pacific SOC as a Service Market Revenue and Forecasts and Analysis - By Service Type
11.3.4 Asia Pacific SOC as a Service Market Breakdown by Enterprise Size
11.3.4.1 Asia Pacific SOC as a Service Market Revenue and Forecasts and Analysis - By Enterprise Size
11.3.5 Asia Pacific SOC as a Service Market Breakdown by Application
11.3.5.1 Asia Pacific SOC as a Service Market Revenue and Forecasts and Analysis - By Application
11.3.6 Asia Pacific SOC as a Service Market Breakdown by Industry
11.3.6.1 Asia Pacific SOC as a Service Market Revenue and Forecasts and Analysis - By Industry
11.3.7 SOC as a service market Breakdown by Countries
11.3.7.1 Australia SOC as a Service Market Revenue and Forecasts to 2030 (US$ Mn)
11.3.7.1.1 Australia SOC as a Service Market Breakdown by Service Type
11.3.7.1.2 Australia SOC as a Service Market Breakdown by Enterprise Size
11.3.7.1.3 Australia SOC as a Service Market Breakdown by Application
11.3.7.1.4 Australia SOC as a Service Market Breakdown by Industry
11.3.7.2 China SOC as a Service Market Revenue and Forecasts to 2030 (US$ Mn)
11.3.7.2.1 China SOC as a Service Market Breakdown by Service Type
11.3.7.2.2 China SOC as a Service Market Breakdown by Enterprise Size
11.3.7.2.3 China SOC as a Service Market Breakdown by Application
11.3.7.2.4 China SOC as a Service Market Breakdown by Industry
11.3.7.3 India SOC as a Service Market Revenue and Forecasts to 2030 (US$ Mn)
11.3.7.3.1 India SOC as a Service Market Breakdown by Service Type
11.3.7.3.2 India SOC as a Service Market Breakdown by Enterprise Size
11.3.7.3.3 India SOC as a Service Market Breakdown by Application
11.3.7.3.4 India SOC as a Service Market Breakdown by Industry
11.3.7.4 Japan SOC as a Service Market Revenue and Forecasts to 2030 (US$ Mn)
11.3.7.4.1 Japan SOC as a Service Market Breakdown by Service Type
11.3.7.4.2 Japan SOC as a Service Market Breakdown by Enterprise Size
11.3.7.4.3 Japan SOC as a Service Market Breakdown by Application
11.3.7.4.4 Japan SOC as a Service Market Breakdown by Industry
11.3.7.5 South Korea SOC as a Service Market Revenue and Forecasts to 2030 (US$ Mn)
11.3.7.5.1 South Korea SOC as a Service Market Breakdown by Service Type
11.3.7.5.2 South Korea SOC as a Service Market Breakdown by Enterprise Size
11.3.7.5.3 South Korea SOC as a Service Market Breakdown by Application
11.3.7.5.4 South Korea SOC as a Service Market Breakdown by Industry
11.3.7.6 Rest of Asia Pacific SOC as a Service Market Revenue and Forecasts to 2030 (US$ Mn)
11.3.7.6.1 Rest of Asia Pacific SOC as a Service Market Breakdown by Service Type
11.3.7.6.2 Rest of Asia Pacific SOC as a Service Market Breakdown by Enterprise Size
11.3.7.6.3 Rest of Asia Pacific SOC as a Service Market Breakdown by Application
11.3.7.6.4 Rest of Asia Pacific SOC as a Service Market Breakdown by Industry
11.4 Middle East & Africa
11.4.1 Middle East & Africa SOC as a Service Market Overview
11.4.2 Middle East & Africa SOC as a Service Market Revenue and Forecasts to 2030 (US$ Million)
11.4.3 Middle East & Africa SOC as a Service Market Breakdown by Service Type
11.4.3.1 Middle East & Africa SOC as a Service Market and Forecasts and Analysis - By Service Type
11.4.4 Middle East & Africa SOC as a Service Market Breakdown by Enterprise Size
11.4.4.1 Middle East & Africa SOC as a Service Market and Forecasts and Analysis - By Enterprise Size
11.4.5 Middle East & Africa SOC as a Service Market Breakdown by Application
11.4.5.1 Middle East & Africa SOC as a Service Market and Forecasts and Analysis - By Application
11.4.6 Middle East & Africa SOC as a Service Market Breakdown by Industry
11.4.6.1 Middle East & Africa SOC as a Service Market and Forecasts and Analysis - By Industry
11.4.7 Middle East & Africa SOC as a Service Market Revenue and Forecasts and Analysis - By Countries
11.4.7.1 South Africa SOC as a Service Market Revenue and Forecasts to 2030 (US$ Mn)
11.4.7.1.1 South Africa SOC as a Service Market Breakdown by Service Type
11.4.7.1.2 South Africa SOC as a Service Market Breakdown by Enterprise Size
11.4.7.1.3 South Africa SOC as a Service Market Breakdown by Application
11.4.7.1.4 South Africa SOC as a Service Market Breakdown by Industry
11.4.7.2 Saudi Arabia SOC as a Service Market Revenue and Forecasts to 2030 (US$ Mn)
11.4.7.2.1 Saudi Arabia SOC as a Service Market Breakdown by Service Type
11.4.7.2.2 Saudi Arabia SOC as a Service Market Breakdown by Enterprise Size
11.4.7.2.3 Saudi Arabia SOC as a Service Market Breakdown by Application
11.4.7.2.4 Saudi Arabia SOC as a Service Market Breakdown by Industry
11.4.7.3 UAE SOC as a Service Market Revenue and Forecasts to 2030 (US$ Mn)
11.4.7.3.1 UAE SOC as a Service Market Breakdown by Service Type
11.4.7.3.2 UAE SOC as a Service Market Breakdown by Enterprise Size
11.4.7.3.3 UAE SOC as a Service Market Breakdown by Application
11.4.7.3.4 UAE SOC as a Service Market Breakdown by Industry
11.4.7.4 Rest of Middle East & Africa SOC as a Service Market Revenue and Forecasts to 2030 (US$ Mn)
11.4.7.4.1 Rest of Middle East & Africa SOC as a Service Market Breakdown by Service Type
11.4.7.4.2 Rest of Middle East & Africa SOC as a Service Market Breakdown by Enterprise Size
11.4.7.4.3 Rest of Middle East & Africa SOC as a Service Market Breakdown by Application
11.4.7.4.4 Rest of Middle East & Africa SOC as a Service Market Breakdown by Industry
11.5 South & Central America
11.5.1 South & Central America SOC as a Service Market Overview
11.5.2 South & Central America SOC as a Service Market Revenue and Forecasts to 2030 (US$ Million)
11.5.3 South & Central America SOC as a Service Market Breakdown by Service Type
11.5.3.1 South & Central America SOC as a Service Market and Forecasts and Analysis - By Service Type
11.5.4 South & Central America SOC as a Service Market Breakdown by Enterprise Size
11.5.4.1 South & Central America SOC as a Service Market Revenue and Forecasts and Analysis - By Enterprise Size
11.5.5 South & Central America SOC as a Service Market Breakdown by Application
11.5.5.1 South & Central America SOC as a Service Market Revenue and Forecasts and Analysis - By Application
11.5.6 South & Central America SOC as a Service Market Breakdown by Industry
11.5.6.1 South & Central America SOC as a Service Market Revenue and Forecasts and Analysis - By Industry
11.5.7 South & Central America SOC as a Service Market Revenue and Forecasts and Analysis - By Countries
11.5.7.1
11.5.7.2 Brazil SOC as a Service Market Revenue and Forecasts to 2030 (US$ Mn)
11.5.7.2.1 Brazil SOC as a Service Market Breakdown by Service Type
11.5.7.2.2 Brazil SOC as a Service Market Breakdown by Enterprise Size
11.5.7.2.3 Brazil SOC as a Service Market Breakdown by Application
11.5.7.2.4 Brazil SOC as a Service Market Breakdown by Industry
11.5.7.3 Argentina SOC as a Service Market Revenue and Forecasts to 2030 (US$ Mn)
11.5.7.3.1 Argentina SOC as a Service Market Breakdown by Service Type
11.5.7.3.2 Argentina SOC as a Service Market Breakdown by Enterprise Size
11.5.7.3.3 Argentina SOC as a Service Market Breakdown by Application
11.5.7.3.4 Argentina SOC as a Service Market Breakdown by Industry
11.5.7.4 Rest of South & Central America SOC as a Service Market Revenue and Forecasts to 2030 (US$ Mn)
11.5.7.4.1 Rest of South & Central America SOC as a Service Market Breakdown by Service Type
11.5.7.4.2 Rest of South & Central America SOC as a Service Market Breakdown by Enterprise Size
11.5.7.4.3 Rest of South & Central America SOC as a Service Market Breakdown by Application
11.5.7.4.4 Rest of South & Central America SOC as a Service Market Breakdown by Industry
12. SOC as a Service Market – Impact of COVID-19 Pandemic
12.1 Pre & Post Covid-19 Impact
13. Competitive Landscape
13.1 Heat Map Analysis By Key Players
13.2 Company Positioning & Concentration
14. Industry Landscape
14.1 Overview
14.2 Market Initiative
14.3 New Product Development
15. Company Profiles
15.1 Fortinet Inc
15.1.1 Key Facts
15.1.2 Business Description
15.1.3 Products and Services
15.1.4 Financial Overview
15.1.5 SWOT Analysis
15.1.6 Key Developments
15.2 Atos SE
15.2.1 Key Facts
15.2.2 Business Description
15.2.3 Products and Services
15.2.4 Financial Overview
15.2.5 SWOT Analysis
15.2.6 Key Developments
15.3 NTT Data Corp
15.3.1 Key Facts
15.3.2 Business Description
15.3.3 Products and Services
15.3.4 Financial Overview
15.3.5 SWOT Analysis
15.3.6 Key Developments
15.4 Verizon Communications Inc
15.4.1 Key Facts
15.4.2 Business Description
15.4.3 Products and Services
15.4.4 Financial Overview
15.4.5 SWOT Analysis
15.4.6 Key Developments
15.5 Thales SA
15.5.1 Key Facts
15.5.2 Business Description
15.5.3 Products and Services
15.5.4 Financial Overview
15.5.5 SWOT Analysis
15.5.6 Key Developments
15.6 AT&T Inc
15.6.1 Key Facts
15.6.2 Business Description
15.6.3 Products and Services
15.6.4 Financial Overview
15.6.5 SWOT Analysis
15.6.6 Key Developments
15.7 Arctic Wolf Networks Inc
15.7.1 Key Facts
15.7.2 Business Description
15.7.3 Products and Services
15.7.4 Financial Overview
15.7.5 SWOT Analysis
15.7.6 Key Developments
15.8 Cloudflare Inc
15.8.1 Key Facts
15.8.2 Business Description
15.8.3 Products and Services
15.8.4 Financial Overview
15.8.5 SWOT Analysis
15.8.6 Key Developments
15.9 ESDS Software Solution Ltd
15.9.1 Key Facts
15.9.2 Business Description
15.9.3 Products and Services
15.9.4 Financial Overview
15.9.5 SWOT Analysis
15.9.6 Key Developments
15.10 ConnectWise LLC
15.10.1 Key Facts
15.10.2 Business Description
15.10.3 Products and Services
15.10.4 Financial Overview
15.10.5 SWOT Analysis
15.10.6 Key Developments
16. Appendix
16.1 Word Index
List of Tables
Table 1. SOC as a Service Market Segmentation
Table 2. SOC as a Service Market Revenue and Forecasts To 2030 (US$ Million)
Table 3. SOC as a Service Market Revenue and Forecasts To 2030 (US$ Million) – Service Type
Table 4. SOC as a Service Market Revenue and Forecasts To 2030 (US$ Million) – Enterprise Size
Table 5. SOC as a Service Market Revenue and Forecasts To 2030 (US$ Million) – Application
Table 6. SOC as a Service Market Revenue and Forecasts To 2030 (US$ Million) – Industry
Table 7. North America SOC as a Service Market Revenue and Forecasts To 2030 (US$ Mn) – By Service Type
Table 8. North America SOC as a Service Market Revenue and Forecasts To 2030 (US$ Mn) – By Enterprise Size
Table 9. North America SOC as a Service Market Revenue and Forecasts To 2030 (US$ Mn) – By Application
Table 10. North America SOC as a Service Market Revenue and Forecasts To 2030 (US$ Mn) – By Industry
Table 11. North America SOC as a Service Market, by Country – Revenue and Forecast to 2030 (USD Million)
Table 12. US SOC as a Service Market Revenue and Forecasts To 2030 (US$ Mn) – By Service Type
Table 13. US SOC as a Service Market Revenue and Forecasts To 2030 (US$ Mn) – By Enterprise Size
Table 14. US SOC as a Service Market Revenue and Forecasts To 2030 (US$ Mn) – By Application
Table 15. US SOC as a Service Market Revenue and Forecasts To 2030 (US$ Mn) – By Industry
Table 16. Canada SOC as a Service Market Revenue and Forecasts To 2030 (US$ Mn) – By Service Type
Table 17. Canada SOC as a Service Market Revenue and Forecasts To 2030 (US$ Mn) – By Enterprise Size
Table 18. Canada SOC as a Service Market Revenue and Forecasts To 2030 (US$ Mn) – By Application
Table 19. Canada SOC as a Service Market Revenue and Forecasts To 2030 (US$ Mn) – By Industry
Table 20. Mexico SOC as a Service Market Revenue and Forecasts To 2030 (US$ Mn) – By Service Type
Table 21. Mexico SOC as a Service Market Revenue and Forecasts To 2030 (US$ Mn) – By Enterprise Size
Table 22. Mexico SOC as a Service Market Revenue and Forecasts To 2030 (US$ Mn) – By Application
Table 23. Mexico SOC as a Service Market Revenue and Forecasts To 2030 (US$ Mn) – By Industry
Table 24. Europe SOC as a Service Market Revenue and Forecasts To 2030 (US$ Mn) – By Service Type
Table 25. Europe SOC as a Service Market Revenue and Forecasts To 2030 (US$ Mn) – By Enterprise Size
Table 26. Europe SOC as a Service Market Revenue and Forecasts To 2030 (US$ Mn) – By Application
Table 27. Europe SOC as a Service Market Revenue and Forecasts To 2030 (US$ Mn) – By Industry
Table 28. Europe SOC as a Service Market, by Country – Revenue and Forecast to 2030 (USD Million)
Table 29. France SOC as a Service Market Revenue and Forecasts To 2030 (US$ Mn) – By Service Type
Table 30. France SOC as a Service Market Revenue and Forecasts To 2030 (US$ Mn) – By Enterprise Size
Table 31. France SOC as a Service Market Revenue and Forecasts To 2030 (US$ Mn) – By Application
Table 32. France SOC as a Service Market Revenue and Forecasts To 2030 (US$ Mn) – By Industry
Table 33. Germany SOC as a Service Market Revenue and Forecasts To 2030 (US$ Mn) – By Service Type
Table 34. Germany SOC as a Service Market Revenue and Forecasts To 2030 (US$ Mn) – By Enterprise Size
Table 35. Germany SOC as a Service Market Revenue and Forecasts To 2030 (US$ Mn) – By Application
Table 36. Germany SOC as a Service Market Revenue and Forecasts To 2030 (US$ Mn) – By Industry
Table 37. UK SOC as a Service Market Revenue and Forecasts To 2030 (US$ Mn) – By Service Type
Table 38. UK SOC as a Service Market Revenue and Forecasts To 2030 (US$ Mn) – By Enterprise Size
Table 39. UK SOC as a Service Market Revenue and Forecasts To 2030 (US$ Mn) – By Application
Table 40. UK SOC as a Service Market Revenue and Forecasts To 2030 (US$ Mn) – By Industry
Table 41. Italy SOC as a Service Market Revenue and Forecasts To 2030 (US$ Mn) – By Service Type
Table 42. Italy SOC as a Service Market Revenue and Forecasts To 2030 (US$ Mn) – By Enterprise Size
Table 43. Italy SOC as a Service Market Revenue and Forecasts To 2030 (US$ Mn) – By Application
Table 44. Italy SOC as a Service Market Revenue and Forecasts To 2030 (US$ Mn) – By Industry
Table 45. Russia SOC as a Service Market Revenue and Forecasts To 2030 (US$ Mn) – By Service Type
Table 46. Russia SOC as a Service Market Revenue and Forecasts To 2030 (US$ Mn) – By Enterprise Size
Table 47. Russia SOC as a Service Market Revenue and Forecasts To 2030 (US$ Mn) – By Application
Table 48. Russia SOC as a Service Market Revenue and Forecasts To 2030 (US$ Mn) – By Industry
Table 49. Rest of Europe SOC as a Service Market Revenue and Forecasts To 2030 (US$ Mn) – By Service Type
Table 50. Rest of Europe SOC as a Service Market Revenue and Forecasts To 2030 (US$ Mn) – By Enterprise Size
Table 51. Rest of Europe SOC as a Service Market Revenue and Forecasts To 2030 (US$ Mn) – By Application
Table 52. Rest of Europe SOC as a Service Market Revenue and Forecasts To 2030 (US$ Mn) – By Industry
Table 53. Asia Pacific SOC as a Service Market Revenue And Forecasts To 2030 (US$ Million) – Service Type
Table 54. Asia Pacific SOC as a Service Market Revenue And Forecasts To 2030 (US$ Million) – Enterprise Size
Table 55. Asia Pacific SOC as a Service Market Revenue And Forecasts To 2030 (US$ Million) – Application
Table 56. Asia Pacific SOC as a Service Market Revenue And Forecasts To 2030 (US$ Million) – Industry
Table 57. Asia Pacific SOC as a Service Market, by Country – Revenue and Forecast to 2030 (USD Million)
Table 58. Australia SOC as a Service Market Revenue and Forecasts To 2030 (US$ Mn) – By Service Type
Table 59. Australia SOC as a Service Market Revenue and Forecasts To 2030 (US$ Mn) – By Enterprise Size
Table 60. Australia SOC as a Service Market Revenue and Forecasts To 2030 (US$ Mn) – By Application
Table 61. Australia SOC as a Service Market Revenue and Forecasts To 2030 (US$ Mn) – By Industry
Table 62. China SOC as a Service Market Revenue and Forecasts To 2030 (US$ Mn) – By Service Type
Table 63. China SOC as a Service Market Revenue and Forecasts To 2030 (US$ Mn) – By Enterprise Size
Table 64. China SOC as a Service Market Revenue and Forecasts To 2030 (US$ Mn) – By Application
Table 65. China SOC as a Service Market Revenue and Forecasts To 2030 (US$ Mn) – By Industry
Table 66. India SOC as a Service Market Revenue and Forecasts To 2030 (US$ Mn) – By Service Type
Table 67. India SOC as a Service Market Revenue and Forecasts To 2030 (US$ Mn) – By Enterprise Size
Table 68. India SOC as a Service Market Revenue and Forecasts To 2030 (US$ Mn) – By Application
Table 69. India SOC as a Service Market Revenue and Forecasts To 2030 (US$ Mn) – By Industry
Table 70. Japan SOC as a Service Market Revenue and Forecasts To 2030 (US$ Mn) – By Service Type
Table 71. Japan SOC as a Service Market Revenue and Forecasts To 2030 (US$ Mn) – By Enterprise Size
Table 72. Japan SOC as a Service Market Revenue and Forecasts To 2030 (US$ Mn) – By Application
Table 73. Japan SOC as a Service Market Revenue and Forecasts To 2030 (US$ Mn) – By Industry
Table 74. South Korea SOC as a Service Market Revenue and Forecasts To 2030 (US$ Mn) – By Service Type
Table 75. South Korea SOC as a Service Market Revenue and Forecasts To 2030 (US$ Mn) – By Enterprise Size
Table 76. South Korea SOC as a Service Market Revenue and Forecasts To 2030 (US$ Mn) – By Application
Table 77. South Korea SOC as a Service Market Revenue and Forecasts To 2030 (US$ Mn) – By Industry
Table 78. Rest of Asia Pacific SOC as a Service Market Revenue and Forecasts To 2030 (US$ Mn) – By Service Type
Table 79. Rest of Asia Pacific SOC as a Service Market Revenue and Forecasts To 2030 (US$ Mn) – By Enterprise Size
Table 80. Rest of Asia Pacific SOC as a Service Market Revenue and Forecasts To 2030 (US$ Mn) – By Application
Table 81. Rest of Asia Pacific SOC as a Service Market Revenue and Forecasts To 2030 (US$ Mn) – By Industry
Table 82. Middle East & Africa SOC as a Service Market Revenue and Forecasts To 2030 (US$ Million) – By Service Type
Table 83. Middle East & Africa SOC as a Service Market Revenue and Forecasts To 2030 (US$ Million) – By Enterprise Size
Table 84. Middle East & Africa SOC as a Service Market Revenue and Forecasts To 2030 (US$ Million) – By Application
Table 85. Middle East & Africa SOC as a Service Market Revenue and Forecasts To 2030 (US$ Million) – By Industry
Table 86. Middle East and Africa SOC as a Service Market, by Country – Revenue and Forecast to 2030 (USD Million)
Table 87. South Africa SOC as a Service Market Revenue and Forecasts To 2030 (US$ Mn) – By Service Type
Table 88. South Africa SOC as a Service Market Revenue and Forecasts To 2030 (US$ Mn) – By Enterprise Size
Table 89. South Africa SOC as a Service Market Revenue and Forecasts To 2030 (US$ Mn) – By Application
Table 90. South Africa SOC as a Service Market Revenue and Forecasts To 2030 (US$ Mn) – By Industry
Table 91. Saudi Arabia SOC as a Service Market Revenue and Forecasts To 2030 (US$ Mn) – By Service Type
Table 92. Saudi Arabia SOC as a Service Market Revenue and Forecasts To 2030 (US$ Mn) – By Enterprise Size
Table 93. Saudi Arabia SOC as a Service Market Revenue and Forecasts To 2030 (US$ Mn) – By Application
Table 94. Saudi Arabia SOC as a Service Market Revenue and Forecasts To 2030 (US$ Mn) – By Industry
Table 95. UAE SOC as a Service Market Revenue and Forecasts To 2030 (US$ Mn) – By Service Type
Table 96. UAE SOC as a Service Market Revenue and Forecasts To 2030 (US$ Mn) – By Enterprise Size
Table 97. UAE SOC as a Service Market Revenue and Forecasts To 2030 (US$ Mn) – By Application
Table 98. UAE SOC as a Service Market Revenue and Forecasts To 2030 (US$ Mn) – By Industry
Table 99. Rest of Middle East & Africa SOC as a Service Market Revenue and Forecasts To 2030 (US$ Mn) – By Service Type
Table 100. Rest of Middle East & Africa SOC as a Service Market Revenue and Forecasts To 2030 (US$ Mn) – By Enterprise Size
Table 101. Rest of Middle East & Africa SOC as a Service Market Revenue and Forecasts To 2030 (US$ Mn) – By Application
Table 102. Rest of Middle East & Africa SOC as a Service Market Revenue and Forecasts To 2030 (US$ Mn) – By Industry
Table 103. South & Central America SOC as a Service Market Revenue and Forecasts To 2030 (US$ Million) – By Service Type
Table 104. South & Central America SOC as a Service Market Revenue and Forecasts To 2030 (US$ Million) – By Enterprise Size
Table 105. South & Central America SOC as a Service Market Revenue and Forecasts To 2030 (US$ Million) – By Application
Table 106. South & Central America SOC as a Service Market Revenue and Forecasts To 2030 (US$ Million) – By Industry
Table 107. South and Central America SOC as a Service Market, by Country – Revenue and Forecast to 2030 (USD Million)
Table 108. Brazil SOC as a Service Market Revenue and Forecasts To 2030 (US$ Mn) – By Service Type
Table 109. Brazil SOC as a Service Market Revenue and Forecasts To 2030 (US$ Mn) – By Enterprise Size
Table 110. Brazil SOC as a Service Market Revenue and Forecasts To 2030 (US$ Mn) – By Application
Table 111. Brazil SOC as a Service Market Revenue and Forecasts To 2030 (US$ Mn) – By Industry
Table 112. Argentina SOC as a Service Market Revenue and Forecasts To 2030 (US$ Mn) – By Service Type
Table 113. Argentina SOC as a Service Market Revenue and Forecasts To 2030 (US$ Mn) – By Enterprise Size
Table 114. Argentina SOC as a Service Market Revenue and Forecasts To 2030 (US$ Mn) – By Application
Table 115. Argentina SOC as a Service Market Revenue and Forecasts To 2030 (US$ Mn) – By Industry
Table 116. Rest of South & Central America SOC as a Service Market Revenue and Forecasts To 2030 (US$ Mn) – By Service Type
Table 117. Rest of South & Central America SOC as a Service Market Revenue and Forecasts To 2030 (US$ Mn) – By Enterprise Size
Table 118. Rest of South & Central America SOC as a Service Market Revenue and Forecasts To 2030 (US$ Mn) – By Application
Table 119. Rest of South & Central America SOC as a Service Market Revenue and Forecasts To 2030 (US$ Mn) – By Industry
Table 120. Company Positioning & Concentration
Table 121. List of Abbreviation
List of Figures
Figure 1. SOC as a Service Market Segmentation, By Geography
Figure 2. Global– PEST Analysis
Figure 3. Ecosystem: SOC as a Service Market
Figure 4. SOC as a Service Market - Key Industry Dynamics
Figure 5. Impact Analysis of Drivers and Restraints
Figure 6. 6.2 SOC as a Service Market Breakdown by Geography, 2022 and 2030 (%)
Figure 7. SOC as a Service Market Revenue (US$ Million), 2022 & 2030
Figure 8. SOC as a Service Market Share (%) – Service Type, 2022 and 2030
Figure 9. Prevention Service Market Revenue and Forecasts To 2030 (US$ Million)
Figure 10. Detection Service Market Revenue and Forecasts To 2030 (US$ Million)
Figure 11. Incident Response Service Market Revenue and Forecasts To 2030 (US$ Million)
Figure 12. SOC as a Service Market Share (%) – Enterprise Size, 2022 and 2030
Figure 13. Large Enterprises Market Revenue and Forecasts To 2030 (US$ Million)
Figure 14. SMEs Market Revenue and Forecasts To 2030 (US$ Million)
Figure 15. SOC as a Service Market Share (%) – Application, 2022 and 2030
Figure 16. Network Security Market Revenue and Forecasts To 2030 (US$ Million)
Figure 17. Endpoint Security Market Revenue and Forecasts To 2030 (US$ Million)
Figure 18. Application Security Market Revenue and Forecasts To 2030 (US$ Million)
Figure 19. Large Enterprises Security Market Revenue and Forecasts To 2030 (US$ Million)
Figure 20. SOC as a Service Market Share (%) – Industry, 2022 and 2030
Figure 21. BFSI Market Revenue and Forecasts To 2030 (US$ Million)
Figure 22. IT and Telecom Market Revenue and Forecasts To 2030 (US$ Million)
Figure 23. Manufacturing Market Revenue and Forecasts To 2030 (US$ Million)
Figure 24. Retail Market Revenue and Forecasts To 2030 (US$ Million)
Figure 25. Government and Public Sector Market Revenue and Forecasts To 2030 (US$ Million)
Figure 26. Healthcare Market Revenue and Forecasts To 2030 (US$ Million)
Figure 27. Others Market Revenue and Forecasts To 2030 (US$ Million)
Figure 28. SOC as a Service Market Revenue Share, By Region (2022 & 2030)
Figure 29. SOC as a Service Market Revenue and Forecasts To 2030 (US$ Mn)
Figure 30. SOC as a Service Market Breakdown by Service Type (2022 and 2030)
Figure 31. SOC as a service market Breakdown by Enterprise Size, 2022 and 2030 (%)
Figure 32. SOC as a service market Breakdown by Application, 2022 and 2030 (%)
Figure 33. SOC as a service market Breakdown by Industry, 2022 and 2030 (%)
Figure 34. SOC as a service market Breakdown by Key Countries, 2022 and 2030 (%)
Figure 35. US SOC as a Service Market Revenue and Forecasts To 2030 (US$ Mn)
Figure 36. Canada SOC as a Service Market Revenue and Forecasts To 2030 (US$ Mn)
Figure 37. Mexico SOC as a Service Market Revenue and Forecasts To 2030 (US$ Mn)
Figure 38. SOC as a Service Market Revenue and Forecasts To 2030 (US$ Mn)
Figure 39. SOC as a Service Market Breakdown by Service Type (2022 and 2030)
Figure 40. SOC as a Service Market Breakdown by Enterprise Size (2022 and 2030)
Figure 41. SOC as a Service Market Breakdown by Application (2022 and 2030)
Figure 42. SOC as a Service Market Breakdown by Industry (2022 and 2030)
Figure 43. SOC as a service market Breakdown by Key Countries, 2022 and 2030 (%)
Figure 44. France SOC as a Service Market Revenue and Forecasts To 2030 (US$ Mn)
Figure 45. Germany SOC as a Service Market Revenue and Forecasts To 2030 (US$ Mn)
Figure 46. UK SOC as a Service Market Revenue and Forecasts To 2030 (US$ Mn)
Figure 47. Italy SOC as a Service Market Revenue and Forecasts To 2030 (US$ Mn)
Figure 48. Russia SOC as a Service Market Revenue and Forecasts To 2030 (US$ Mn)
Figure 49. Rest of Europe SOC as a Service Market Revenue and Forecasts To 2030 (US$ Mn)
Figure 50. Asia Pacific SOC as a Service Market Revenue And Forecasts To 2030 (US$ Million)
Figure 51. Asia Pacific SOC as a Service Market Breakdown by Service Type (2022 and 2023)
Figure 52. Asia Pacific SOC as a Service Market Breakdown by Enterprise Size (2022 and 2023)
Figure 53. Asia Pacific SOC as a Service Market Breakdown by Application (2022 and 2023)
Figure 54. Asia Pacific SOC as a Service Market Breakdown by Industry (2022 and 2023)
Figure 55. Asia Pacific SOC as a Service Market Breakdown By Key Countries, 2022 And 2030 (%)
Figure 56. Australia SOC as a Service Market Revenue and Forecasts To 2030 (US$ Mn)
Figure 57. China SOC as a Service Market Revenue and Forecasts To 2030 (US$ Mn)
Figure 58. India SOC as a Service Market Revenue and Forecasts To 2030 (US$ Mn)
Figure 59. Japan SOC as a Service Market Revenue and Forecasts To 2030 (US$ Mn)
Figure 60. South Korea SOC as a Service Market Revenue and Forecasts To 2030 (US$ Mn)
Figure 61. Rest of Asia Pacific SOC as a Service Market Revenue and Forecasts To 2030 (US$ Mn)
Figure 62. SOC as a Service Market Revenue and Forecasts To 2030 (US$ Million)
Figure 63. Middle East & Africa SOC as a Service Market Breakdown by Service Type (2022 and 2023)
Figure 64. Middle East & Africa SOC as a Service Market Breakdown by Enterprise Size (2022 and 2023)
Figure 65. Middle East & Africa SOC as a Service Market Breakdown by Application (2022 and 2023)
Figure 66. Middle East & Africa SOC as a Service Market Breakdown by Industry (2022 and 2023)
Figure 67. SOC as a Service Market Breakdown by Key Countries, 2022 and 2030 (%)
Figure 68. South Africa SOC as a Service Market Revenue and Forecasts To 2030 (US$ Mn)
Figure 69. Saudi Arabia SOC as a Service Market Revenue and Forecasts To 2030 (US$ Mn)
Figure 70. UAE SOC as a Service Market Revenue and Forecasts To 2030 (US$ Mn)
Figure 71. Rest of Middle East & Africa SOC as a Service Market Revenue and Forecasts To 2030 (US$ Mn)
Figure 72. SOC as a Service Market Revenue and Forecasts To 2030 (US$ Million)
Figure 73. South & Central America SOC as a Service Market Breakdown by Service Type (2022 and 2023)
Figure 74. South & Central America SOC as a Service Market Breakdown by Enterprise Size (2022 and 2023)
Figure 75. South & Central America SOC as a Service Market Breakdown by Application (2022 and 2023)
Figure 76. South & Central America SOC as a Service Market Breakdown by Industry (2022 and 2023)
Figure 77. SOC as a Service Market Breakdown by Key Countries, 2022 and 2030 (%)
Figure 78. Brazil SOC as a Service Market Revenue and Forecasts To 2030 (US$ Mn)
Figure 79. Argentina SOC as a Service Market Revenue and Forecasts To 2030 (US$ Mn)
Figure 80. Rest of South & Central America SOC as a Service Market Revenue and Forecasts To 2030 (US$ Mn)
Figure 81. Heat Map Analysis By Key Players
The List of Companies – SOC as a Service Market
- Fortinet Inc
- Atos SE
- NTT Data Corp
- Verizon Communications Inc
- Thales SA
- AT&T Inc
- Arctic Wolf Networks Inc
- Cloudflare Inc
- ESDS Software Solution Ltd
- ConnectWise LLC
The Insight Partners performs research in 4 major stages: Data Collection & Secondary Research, Primary Research, Data Analysis and Data Triangulation & Final Review.
- Data Collection and Secondary Research:
As a market research and consulting firm operating from a decade, we have published many reports and advised several clients across the globe. First step for any study will start with an assessment of currently available data and insights from existing reports. Further, historical and current market information is collected from Investor Presentations, Annual Reports, SEC Filings, etc., and other information related to company’s performance and market positioning are gathered from Paid Databases (Factiva, Hoovers, and Reuters) and various other publications available in public domain.
Several associations trade associates, technical forums, institutes, societies and organizations are accessed to gain technical as well as market related insights through their publications such as research papers, blogs and press releases related to the studies are referred to get cues about the market. Further, white papers, journals, magazines, and other news articles published in the last 3 years are scrutinized and analyzed to understand the current market trends.
- Primary Research:
The primarily interview analysis comprise of data obtained from industry participants interview and answers to survey questions gathered by in-house primary team.
For primary research, interviews are conducted with industry experts/CEOs/Marketing Managers/Sales Managers/VPs/Subject Matter Experts from both demand and supply side to get a 360-degree view of the market. The primary team conducts several interviews based on the complexity of the markets to understand the various market trends and dynamics which makes research more credible and precise.
A typical research interview fulfils the following functions:
- Provides first-hand information on the market size, market trends, growth trends, competitive landscape, and outlook
- Validates and strengthens in-house secondary research findings
- Develops the analysis team’s expertise and market understanding
Primary research involves email interactions and telephone interviews for each market, category, segment, and sub-segment across geographies. The participants who typically take part in such a process include, but are not limited to:
- Industry participants: VPs, business development managers, market intelligence managers and national sales managers
- Outside experts: Valuation experts, research analysts and key opinion leaders specializing in the electronics and semiconductor industry.
Below is the breakup of our primary respondents by company, designation, and region:

Once we receive the confirmation from primary research sources or primary respondents, we finalize the base year market estimation and forecast the data as per the macroeconomic and microeconomic factors assessed during data collection.
- Data Analysis:
Once data is validated through both secondary as well as primary respondents, we finalize the market estimations by hypothesis formulation and factor analysis at regional and country level.
- 3.1 Macro-Economic Factor Analysis:
We analyse macroeconomic indicators such the gross domestic product (GDP), increase in the demand for goods and services across industries, technological advancement, regional economic growth, governmental policies, the influence of COVID-19, PEST analysis, and other aspects. This analysis aids in setting benchmarks for various nations/regions and approximating market splits. Additionally, the general trend of the aforementioned components aid in determining the market's development possibilities.
- 3.2 Country Level Data:
Various factors that are especially aligned to the country are taken into account to determine the market size for a certain area and country, including the presence of vendors, such as headquarters and offices, the country's GDP, demand patterns, and industry growth. To comprehend the market dynamics for the nation, a number of growth variables, inhibitors, application areas, and current market trends are researched. The aforementioned elements aid in determining the country's overall market's growth potential.
- 3.3 Company Profile:
The “Table of Contents” is formulated by listing and analyzing more than 25 - 30 companies operating in the market ecosystem across geographies. However, we profile only 10 companies as a standard practice in our syndicate reports. These 10 companies comprise leading, emerging, and regional players. Nonetheless, our analysis is not restricted to the 10 listed companies, we also analyze other companies present in the market to develop a holistic view and understand the prevailing trends. The “Company Profiles” section in the report covers key facts, business description, products & services, financial information, SWOT analysis, and key developments. The financial information presented is extracted from the annual reports and official documents of the publicly listed companies. Upon collecting the information for the sections of respective companies, we verify them via various primary sources and then compile the data in respective company profiles. The company level information helps us in deriving the base number as well as in forecasting the market size.
- 3.4 Developing Base Number:
Aggregation of sales statistics (2020-2022) and macro-economic factor, and other secondary and primary research insights are utilized to arrive at base number and related market shares for 2022. The data gaps are identified in this step and relevant market data is analyzed, collected from paid primary interviews or databases. On finalizing the base year market size, forecasts are developed on the basis of macro-economic, industry and market growth factors and company level analysis.
- Data Triangulation and Final Review:
The market findings and base year market size calculations are validated from supply as well as demand side. Demand side validations are based on macro-economic factor analysis and benchmarks for respective regions and countries. In case of supply side validations, revenues of major companies are estimated (in case not available) based on industry benchmark, approximate number of employees, product portfolio, and primary interviews revenues are gathered. Further revenue from target product/service segment is assessed to avoid overshooting of market statistics. In case of heavy deviations between supply and demand side values, all thes steps are repeated to achieve synchronization.
We follow an iterative model, wherein we share our research findings with Subject Matter Experts (SME’s) and Key Opinion Leaders (KOLs) until consensus view of the market is not formulated – this model negates any drastic deviation in the opinions of experts. Only validated and universally acceptable research findings are quoted in our reports.
We have important check points that we use to validate our research findings – which we call – data triangulation, where we validate the information, we generate from secondary sources with primary interviews and then we re-validate with our internal data bases and Subject matter experts. This comprehensive model enables us to deliver high quality, reliable data in shortest possible time.
 Get Free Sample For